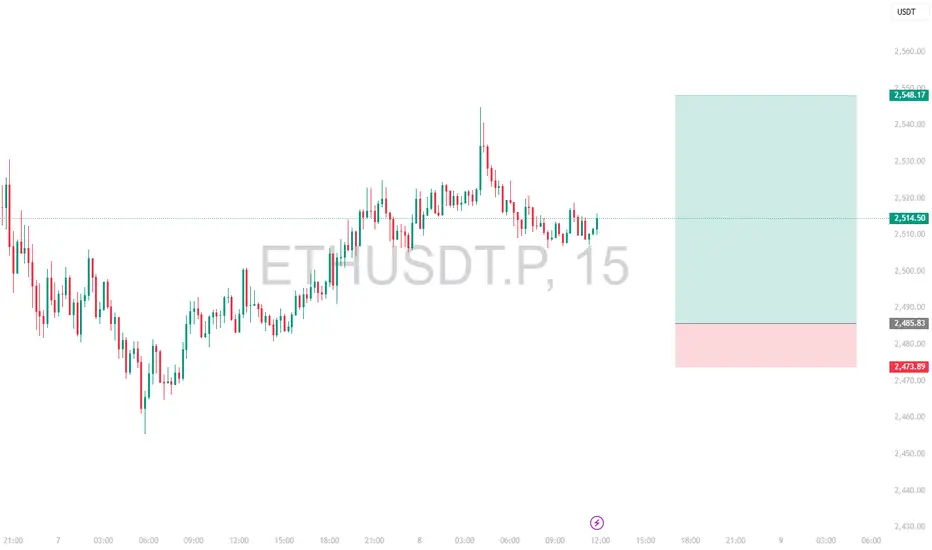
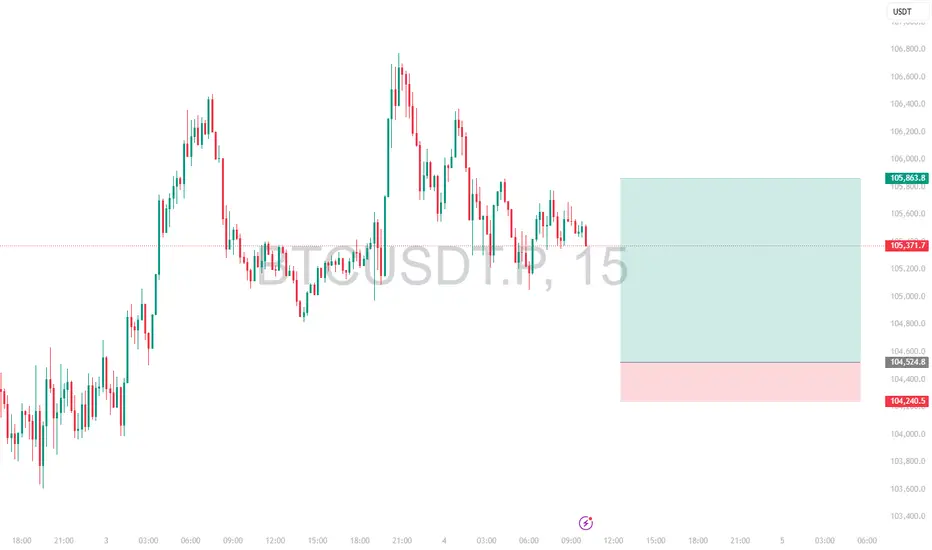
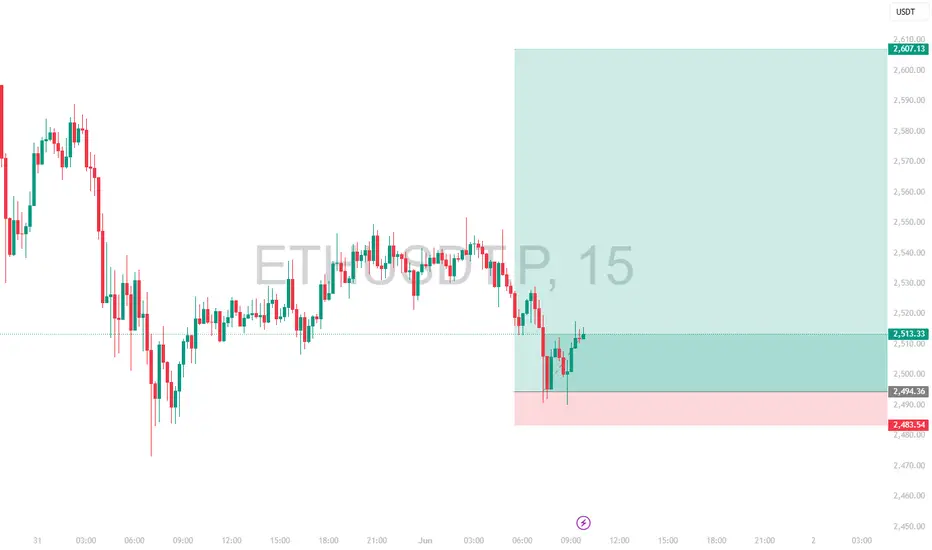
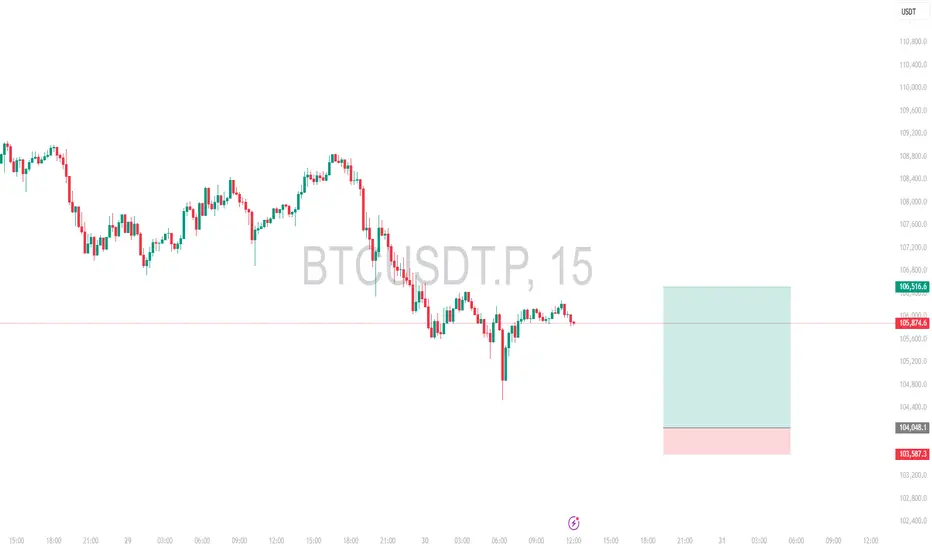
Intraday Long Setup | June 11th 2025 | Valid Until Daily ClosePrice is retracing to a strong pivot zone.
Structure remains bullish with potential for continuation after pullback.
Tight risk control.
Watch for price reaction within the red zone. Entry only if confirmation appears
The setup expires at end of the daily candle close.
Pivot Points
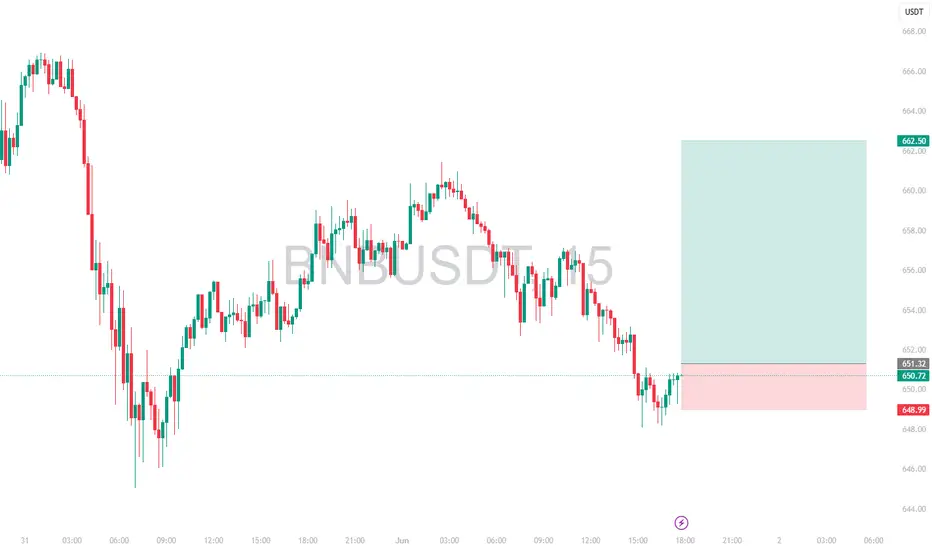
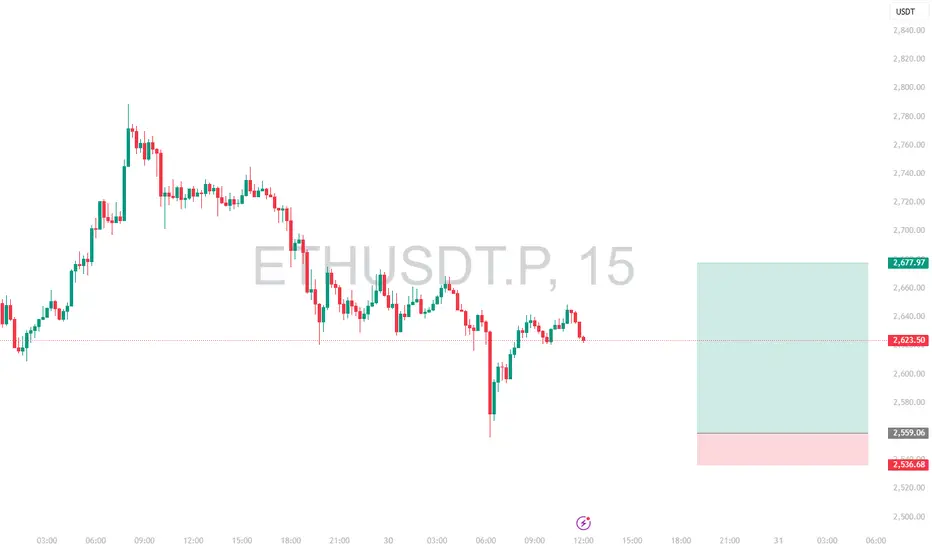
Intraday Long Setup | June 9th 2025 | Valid Until Daily ClosePrice is retracing to a strong pivot zone (marked by the red box).
Structure remains bullish with potential for continuation after pullback.
The green box represents a high-probability long opportunity with tight risk control.
Watch for price reaction within the red zone. Entry only if confirmation (e.g., bullish engulfing, strong wick rejections) appears.
The setup expires at end of the daily candle close.
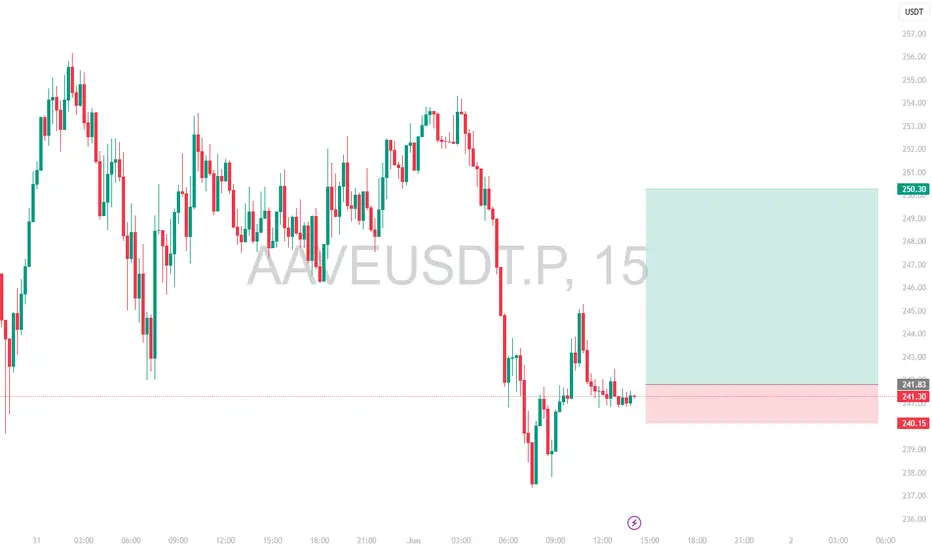
Intraday Long Setup | June 9th 2025 | Valid Until Daily ClosePrice is retracing to a strong pivot zone.
Structure remains bullish with potential for continuation after pullback.
Tight risk control.
Watch for price reaction within the red zone. Entry only if confirmation appears
The setup expires at end of the daily candle close.
Intraday Long Setup | June 8th 2025 | Valid Until Daily ClosePrice is retracing to a strong pivot zone (marked by the red box).
Structure remains bullish with potential for continuation after pullback.
The green box represents a high-probability long opportunity with tight risk control.
Watch for price reaction within the red zone. Entry only if confirmation (e.g., bullish engulfing, strong wick rejections) appears.
The setup expires at end of the daily candle close.

Construction - Arkade Developers - 52W high - RBI rate cutConstruction Realty sector is attractive now due to rate cut. Arkade developers has excellent fundamentals and rising profit margin. Technical breakout on daily chart with volume. Cup and handle formation. 18% - 65% potential is there.

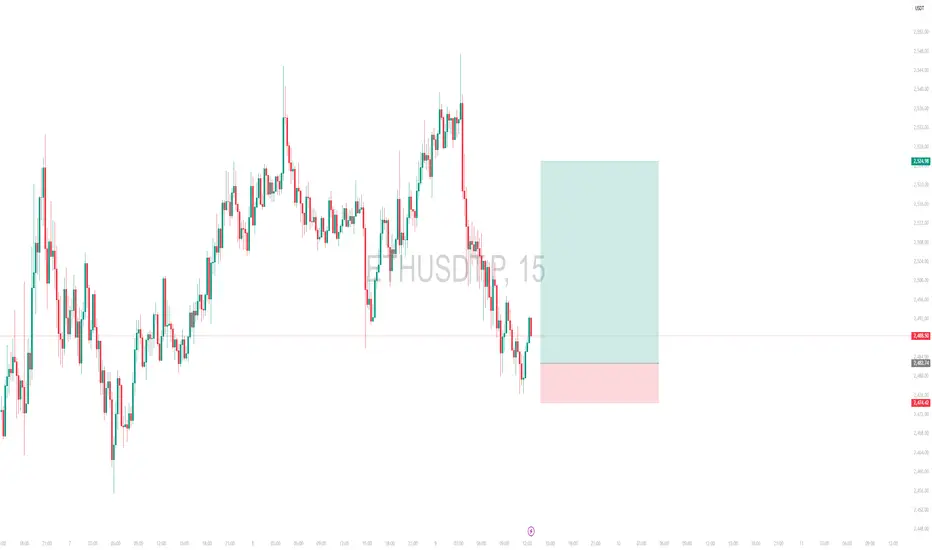
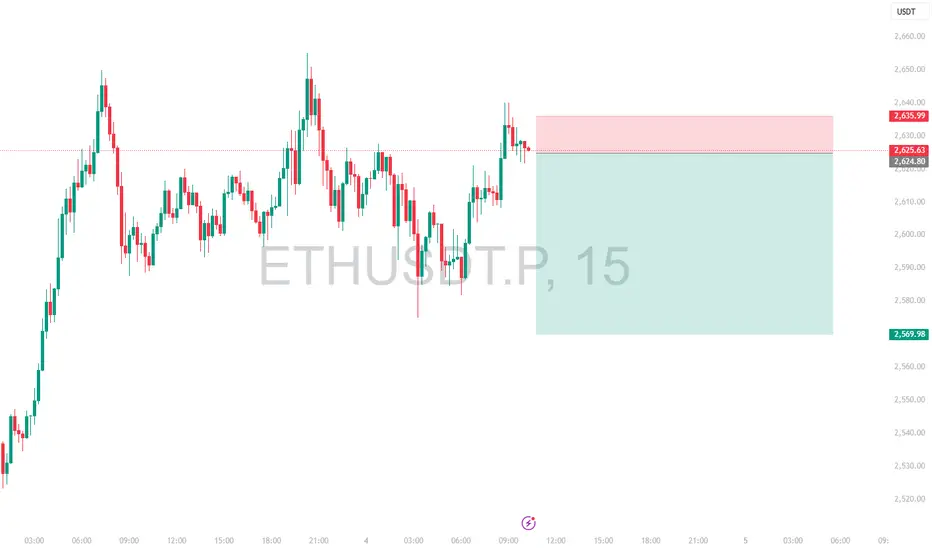
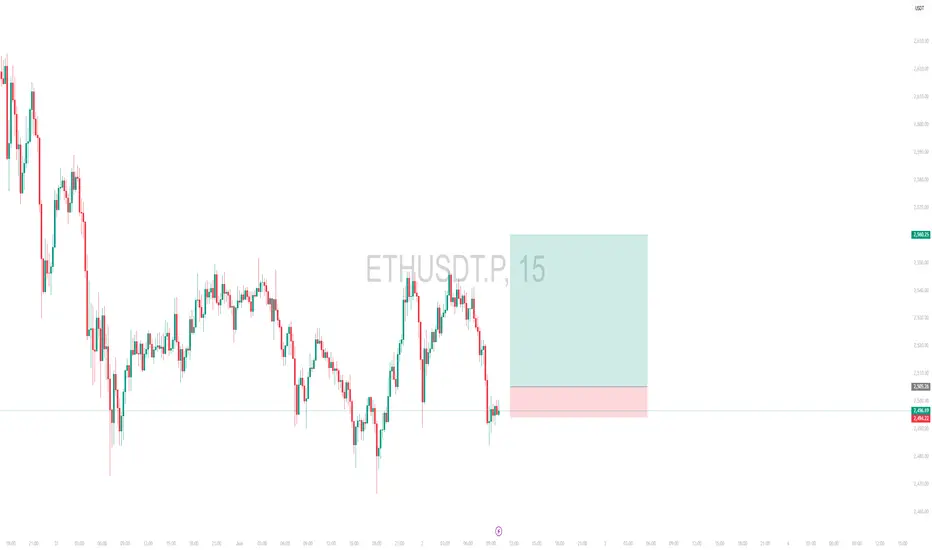
Intraday Short Setup | June 4th 2025 | Valid Until Daily ClosePrice has pushed into a potential intraday Pivot supply zone (red box) where sellers may step in. This trade is based on the expectation of a rejection from this area.
Entry: Red box — a short entry zone aligned with overhead supply
Stop Loss: Above the red zone (invalidates the setup)
Target: Green box — area to consider partial/full exit based on momentum
ETHUSDT has shown a strong bounce but is now approaching a key pivotal resistance zone
Risk-reward is favorable with a tight invalidation and clean downside target
Price may stall or reverse near the red box, creating short opportunity
Note:
This is an intraday trade idea that expires at 00:00 UTC (Daily Candle Close). Re-evaluate the setup if price remains indecisive near the entry zone close to that time.
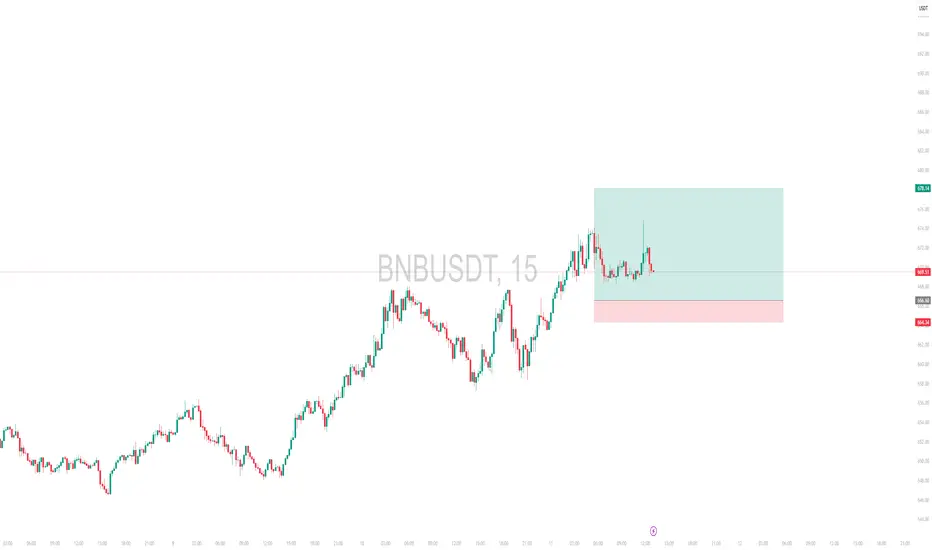
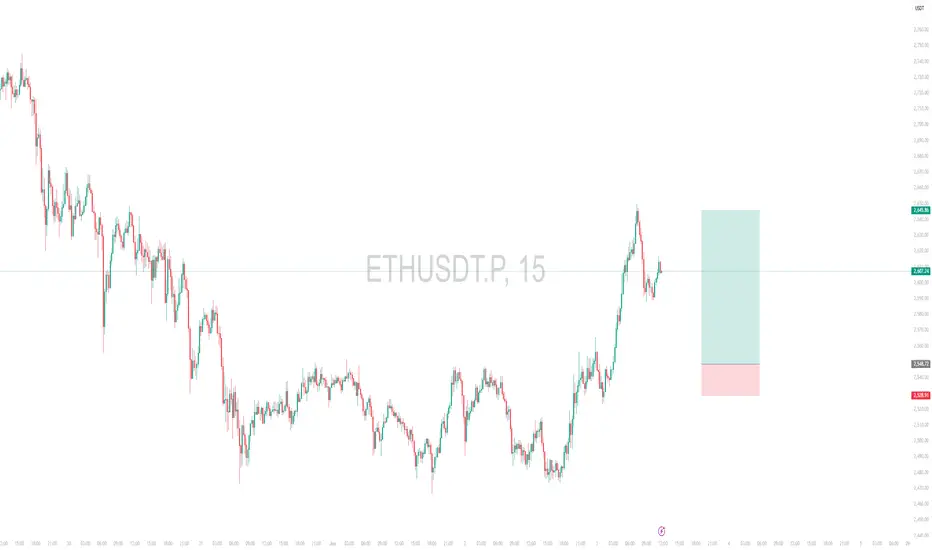
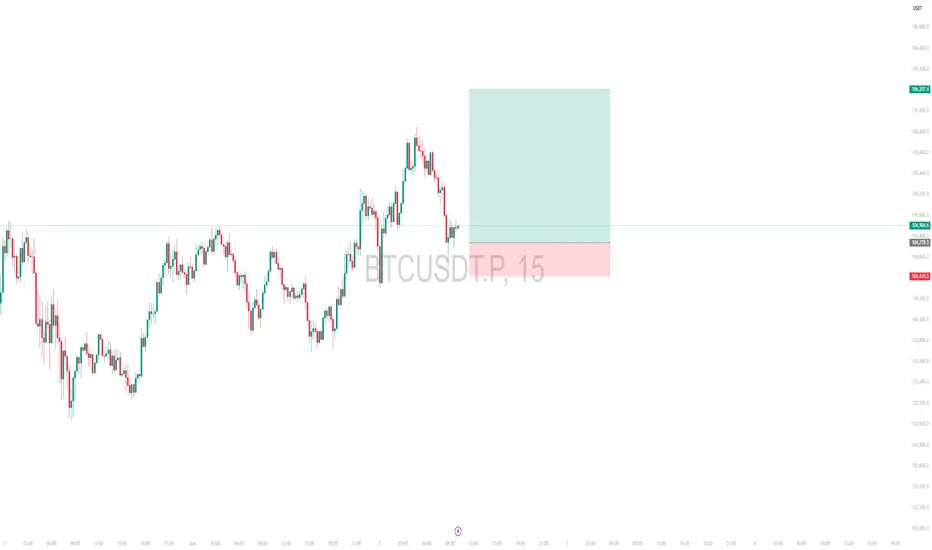
Intraday Long Setup | June 3rd 2025 | Valid Until Daily ClosePrice is retracing to a strong pivot zone (marked by the red box).
Structure remains bullish with potential for continuation after pullback.
The green box represents a high-probability long opportunity with tight risk control.
Watch for price reaction within the red zone. Entry only if confirmation (e.g., bullish engulfing, strong wick rejections) appears.
The setup expires at end of the daily candle close.
Intraday Long Setup | June 4th 2025 | Valid Until Daily ClosePrice is retracing to a strong pivot zone (marked by the red box).
Structure remains bullish with potential for continuation after pullback.
The green box represents a high-probability long opportunity with tight risk control.
Watch for price reaction within the red zone. Entry only if confirmation (e.g., bullish engulfing, strong wick rejections) appears.
The setup expires at end of the daily candle close.
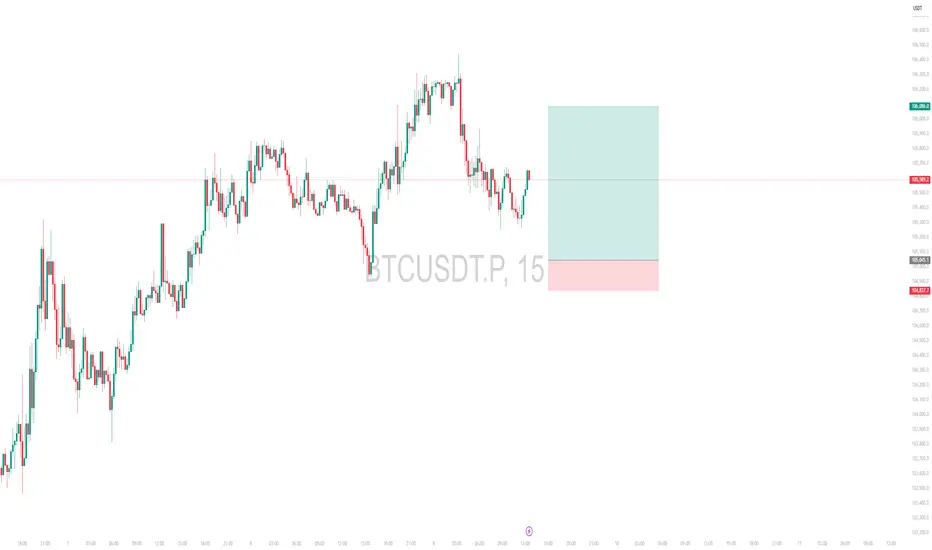
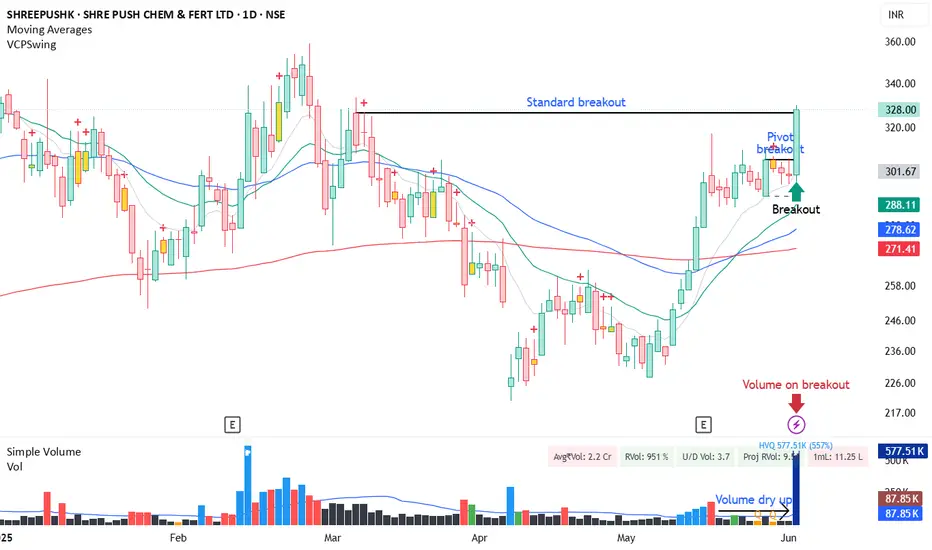
Difference between Pivot and Standard breakoutPivot:- When the stock consolidates for few days in tight range which is less than 8% for few days and volume dries up.
Standard Breakout:- When the stock breaks old resistance level.
DISCLAIMER: NOT INVESTED. This is only for educational purpose. I'm not a SEBI registered analyst.
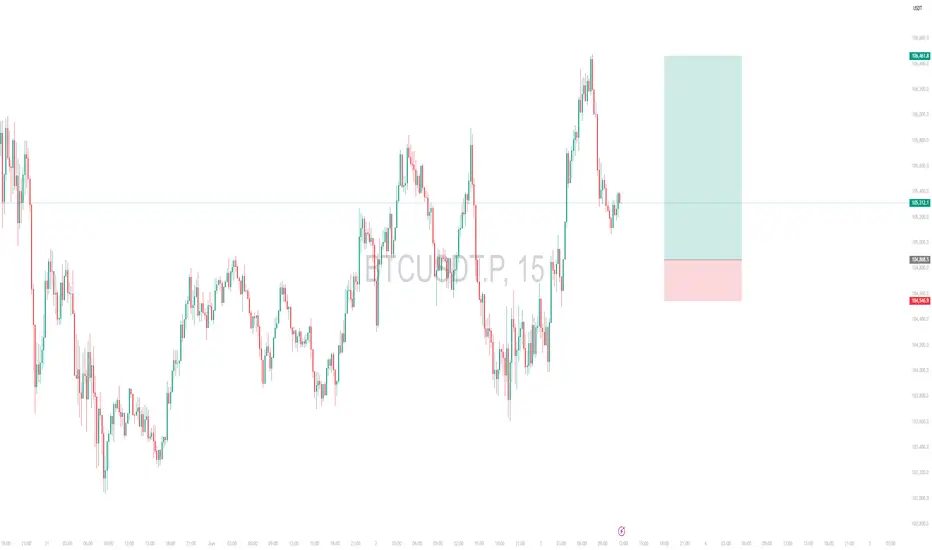
Intraday Long Setup | June 2nd 2025 | Valid Until Daily ClosePrice is retracing to a strong pivot zone (marked by the red box).
Structure remains bullish with potential for continuation after pullback.
The green box represents a high-probability long opportunity with tight risk control.
Watch for price reaction within the red zone. Entry only if confirmation (e.g., bullish engulfing, strong wick rejections) appears.
The setup expires at end of the daily candle close.
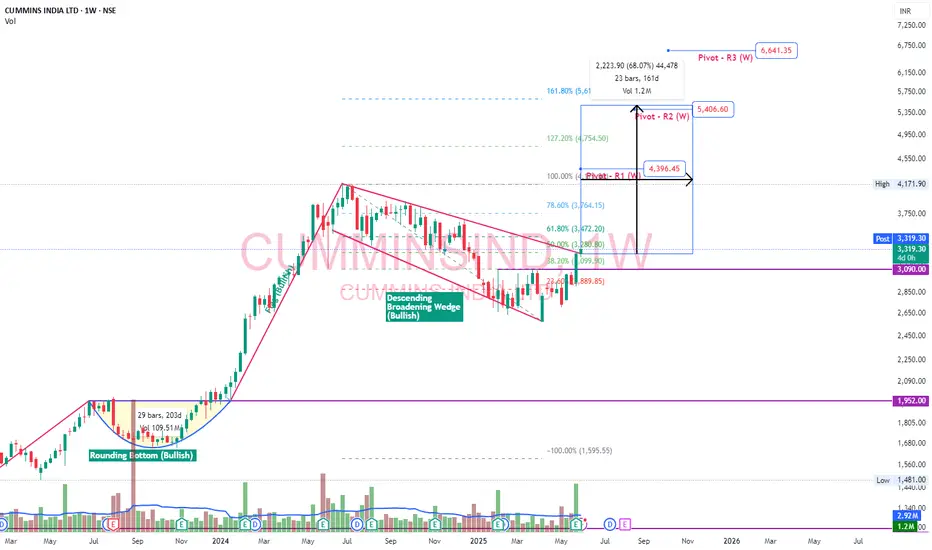
CumminsInd - Desc Broadening Wedge - BullishCumminsInd - Capital goods Non Electrical Equipment
Despite modest Q4 revenue growth, Cummins India expects double-digit growth in FY26 on the back of robust domestic demand, CPCB 4+ tailwinds, and export recovery
Chart is making Bullish flag with descending broadening Wedge bullish pattern in weekly timeframe
Fib level 161.8%, Pivot R1(W), Pivot R2 (W) will hold as resistances
Intraday Long Setup | June 1st 2025 | Valid Until Daily ClosePrice is retracing to a strong pivot zone (marked by the red box).
Structure remains bullish with potential for continuation after pullback.
The green box represents a high-probability long opportunity with tight risk control.
Watch for price reaction within the red zone. Entry only if confirmation (e.g., bullish engulfing, strong wick rejections) appears.
The setup expires at end of the daily candle close.

Intraday Long Setup | June 1st 2025 | Valid Until Daily ClosePrice has retraced to a strong pivot zone (marked by the red box).
Structure remains bullish with potential for continuation after pullback.
The green box represents a high-probability long opportunity with tight risk control.
Watch for price reaction within the red zone. Entry only if confirmation (e.g., bullish engulfing, strong wick rejections) appears.
The setup expires at end of the daily candle close.
Intraday Long Setup | May 30th 2025 | Valid Until Daily ClosePrice is retracing to a strong pivot zone (marked by the red box).
Structure remains bullish with potential for continuation after pullback.
The green box represents a high-probability long opportunity with tight risk control.
Watch for price reaction within the red zone. Entry only if confirmation (e.g., bullish engulfing, strong wick rejections) appears.
The setup expires at end of the daily candle close.
Long base breakout Long base breakout and then five days price tightness and breakout good for swing trading with SL 127

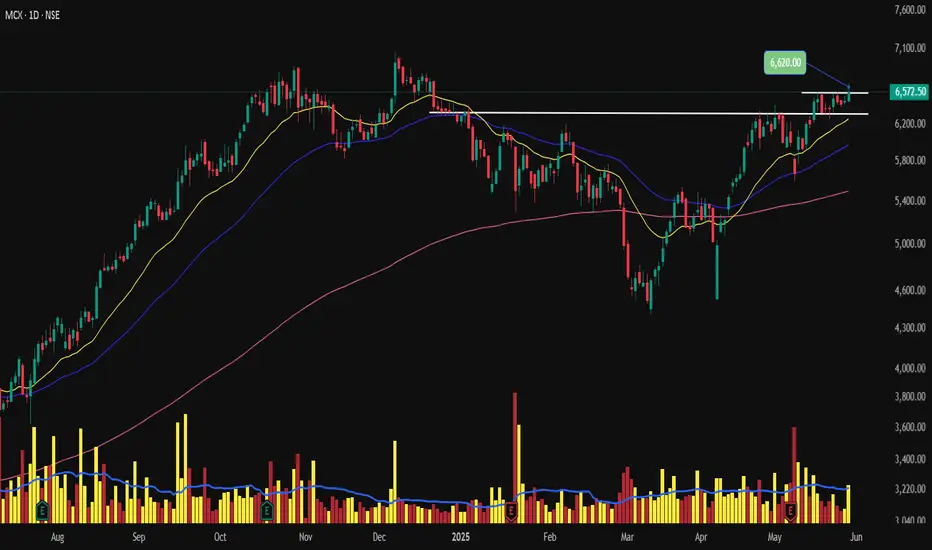
Inverted H&S breakout with tight consolidation Inverted H&S breakout and then price tightness for 7 days and breaking out with high volume good setup for swing trade with SL 6355