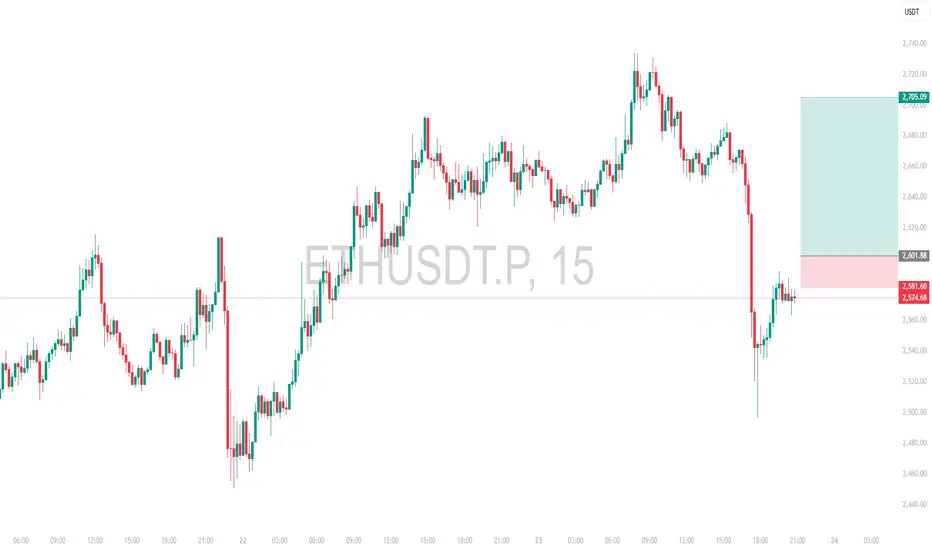
Intraday Long Setup | May 23rd 25 | Valid Until Daily ClosePrice has retraced below a strong pivot zone (marked by the red box).
Structure remains bullish with potential for continuation after pullback.
The green box represents a high-probability long opportunity with tight risk control.
Watch for price reaction within the red zone. Entry only if confirmation (e.g., bullish engulfing, strong wick rejections) appears.
The setup expires at end of the daily candle close.
Pivotstrategy
NIFTY50 : WEEKLY EXPIRY SPECIAL 🔍So, got a lot of enquiries for explanation of today's movement by Indices and here I will try to summarise the entire context for ongoing price movement with the help of my very own "Pivot Auction Chart" 📶
➖ To start with the general context of this week's price movement -
👉🏻 Currently both the indices are in grip of weekly participants (responsive).
👉🏻 So, either they show strength at the pullback to push the price in the ongoing direction or else the Monthly Responsive players will trap them in coming sessions which will lead to a situation of pullback getting turned into reversal.
This context was discussed on 8th August, 2023
What happens today??
📍 We saw a O=H opening today depicting strong selling pressure as we break the previous 2D low which happens to be at the Monthly Cam Level L3 (ML3) and Weekly Pivot (Pivot(W)) .
📍 Now with first hour being a seller's candle alongside daily narrow CPR setup which was an indicative of a possible trending day which turned the tables after the flush of weak daily sellers who enter in the market after a consolidation in the first half.
📍 With the market narrative being seen as a pause for further selling in the second half, we see a price breakout from the hourly price range and as the general context was given we see as soon as the price cam to previous 2D low in confluence to the price level of Monthly Responsive Buyers they trapped all the shorters for the day with the of help of Metals, OIl & Gas and Auto Sector in their bucket to push the price higher to the 2D high.
◇Attaching a snapshot of NSE:NIFTY in accordance to Auction Market Theory (AMT) which shows this phenomenon in more depth and will help you tomorrow too ▿
↘︎ A brief for tomorrow's expiry movement:
• We see a Bullish GPZ setup for tomorrow alongside an event day too that is "RBI MONETARY POLICY" meet which starts at 10am IST.
• So, here one thing is which is very straight and simple is that NSE:NIFTY will be in control of today's buyers until the GPZ is taken down.
• In case of GAP-UP opening we have a broader responsive range of "Weekly Responsive Sellers (WH3) - Quarterly Responsive Sellers (QH3) & also Daily Responsive Sellers (DH3) so, a dip can come towards the GPZ and if the GPZ is intact a good short covering can be seen tomorrow towards 19800.
• In case of GAP-DOWN opening we can price taking an initial bounce from the Daily Pivot and if the price unable to cross PDH then first we will break the GPZ and then if the news momentum joins in then we can go as deep as towards 19380-19410 levels.
So, here is a summarised brief of today's movement in the simplest yet as descriptive as possible and tomorrow's possible move in NSE:NIFTY and similar follow up in NSE:BANKNIFTY ✓
If you found it helpful then share it with your traders/friends/family ⏭️
Regards,
Mukkull 🫶

NIFTY50: (THE BROADER PICTURE) HEY FAM,
- As you see in the pictorial representation of NSE:NIFTY , the index took an upsurge at around 13th June, 2023 with a gap-up opening which happens to the level of previous month high (PMH).
- Moving on we also see a PEMA crossover with an initial retest of price at Monthly H3 (MH3) level which shows that monthly responsive players are in action now when the price takes the first support from marked zone that is -> (PMH - MH3)
- Now in the same week we form a Weekly high (PWH) at around 19th June, 2023 which you can see comes in a beautiful confluence with the level of Monthly H4 (MH4) thus making it a hot level on the upper side which is why the line is marked as 'orange'.
- Fast forward to this current week, we have a reference that the index has a responsive range of around 210 points which is clearly marked on the chart too.
- This week beautifully shows the fight between the weekly and monthly responsive players trying to break through from the responsive range and thus open gates for their respective initiative players to race towards their range targets.
NOTE:
I hope you understand the broader picture now and can also testify how simple things can be if you just connect the respective dots from multiple pivot timeframe.
So, I think that this information through a brief pictorial representation helps you in further projects and the same time shows you one of the way you can use PIVOT STUDY WITHOUT EVEN APPLYING ANY INDICATOR!!
Let me know your thoughts upon this publish in the comment section.
THANK YOU

How to Trade Camerilla Pivot Points with Live Trade exampleHow to Trade Camerilla Pivot Points with Live Trade example
Keep Eye on Stop loss levels they will either work as Support/Resistance breakout or breakdown can give Explosive moves which are good level for Options Buying
Disclaimer: These levels are purely based on Price action/demand and supply zones & and consumed only for educational purpose & should not be taken as buy/sell recommendation. I will not be responsible for any loss/profit incurred if anyone takes trades based on my view.
Please consult your Financial Advisor before making any trading decision.

How Trade Key Trading levels - Camarilla Pivots How Trade Key Trading levels Camarilla Pivots with combination of Previous day high & Low & Close
This video is not real live trade its made on reply trade.
Disclaimer: These levels are purely based on Price action/demand and supply zones & and consumed only for educational purpose & should not be taken as buy/sell recommendation. I will not be responsible for any loss/profit incurred if anyone takes trades based on my view.
Please consult your Financial Advisor before making any trading decision.

RAYMOND LTD shows strong buy indicated by PSAR, MACD & Fisher crossover followed by EMA & MA Crossover
Target 2: 1021.55
Target 1: 927.05
Stop Loss: 870.20
𝑫𝒊𝒔𝒄𝒍𝒂𝒊𝒎𝒆𝒓:
The analysis is only for illustration purposes only. Please consult your financial advisor, agent, broker before acting on any information. We may or may not have positions in the stock and our actions may be contrary to the one mentioned here. This analysis may or may not be updated. We would not be responsible for the profit/loss resulting from this analysis. NSE:RAYMOND

Reliance CPR and Money zone have formed a lower relation. Looking at price analysis, price has taken a strong rejection at previous month high and is currently trading below monthly pivot range. the price has been steadily trading lower and is currently at multiple resistances. Any strong rejection would push the price to new lows for the week.

OIL INDIA LTDNSE:OIL shows strong buy indicated by PSAR, MACD & Fisher crossover followed by EMA & MA Crossover
Target 2: 259.45
Target 1: 244.10
Stop Loss: 220.05
𝑫𝒊𝒔𝒄𝒍𝒂𝒊𝒎𝒆𝒓:
The analysis is only for illustration purposes only. Please consult your financial advisor, agent, broker before acting on any information. We may or may not have positions in the stock and our actions may be contrary to the one mentioned here. This analysis may or may not be updated. We would not be responsible for the profit/loss resulting from this analysis.

BankNifty Spot Weekly Outlook For Week May30th–Jun 03Falcon Analytics Outlook Bank Nifty for the week ( May 30 – Jun 03 )
Technically on the daily charts we see minor support on the downside for BankNifty index lies at 34164 levels,
whereas minor resistance on the upside is capped around 36263 levels.
If BankNifty index breaches minor support on the downside and closes below it, we may see fresh break down and index can drag towards major support on lower side around 33561/32958 and and if breaches minor resistance on the upside and closes above it, we may see fresh breakout and index can head towards major resistance at higher levels around 36719/37322.
Currently BankNifty index is just trading below 200 day EMA @ 35885 suggests long term trend is Bearish .
Falcon Analytics predicts range for the week is seen from 34164 on downside and 36719 on upside.
Below Mentioned Spot Levels can be used to trade Long Or Short during the week ahead.
( All Spot Levels)
RESISTANCE 4: 37322
RESISTANCE 3: 36719
RESISTANCE 2: 36116
RESISTANCE 1: 35743
WEEKLY PIVOT LEVELS: 35140
SUPPORT 1: 34537
SUPPORT 2: 34164
SUPPORT 3: 33561
SUPPORT 4: 32958
All above views for education purpose only .
Regards,
MD .

IRB INFRASTRUCUTRE: POSITIVE TRENDNSE:IRB shows strong buy indicated by PSAR, MACD & Fisher crossover followed by EMA & MA Crossover
Target 2: 260.95
Target 1: 245.30
Stop Loss: 221.10
𝑫𝒊𝒔𝒄𝒍𝒂𝒊𝒎𝒆𝒓:
The analysis is only for illustration purposes only. Please consult your financial advisor, agent, broker before acting on any information. We may or may not have positions in the stock and our actions may be contrary to the one mentioned here. This analysis may or may not be updated. We would not be responsible for the profit/loss resulting from this analysis.

GAIL INDIA LTD: POSTIVE TREND NSE:GAIL shows strong buy indicated by PSAR, MACD & Fisher crossover followed by EMA & MA Crossover
Target 2: 170.35
Target 1: 162.45
Stop Loss: 151.10
𝑫𝒊𝒔𝒄𝒍𝒂𝒊𝒎𝒆𝒓:
The analysis is only for illustration purposes only. Please consult your financial advisor, agent, broker before acting on any information. We may or may not have positions in the stock and our actions may be contrary to the one mentioned here. This analysis may or may not be updated. We would not be responsible for the profit/loss resulting from this analysis.

JK LAXMI CEMENTS : POSITIVE TRENDNSE:JKLAKSHMI shows strong buy indicated by PSAR, MACD & Fisher crossover followed by EMA & MA Crossover
Target 2: 546.85
Target 1: 526.15.80
Stop Loss: 453.30
𝑫𝒊𝒔𝒄𝒍𝒂𝒊𝒎𝒆𝒓:
The analysis is only for illustration purposes only. Please consult your financial advisor, agent, broker before acting on any information. We may or may not have positions in the stock and our actions may be contrary to the one mentioned here. This analysis may or may not be updated. We would not be responsible for the profit/loss resulting from this analysis.

NIFTY FUT- Blue Print for 22-Mar-2022 *******************************************************************
NIFTY FUT- Blue Print for 22-Mar-2022
*******************************************************************
HTF - Market Structure
l Chart Pattern - Higher Low structure
l DTF Pivot Trend - Bullish Structure
l DTF Price Action - Bearish Marbuzzo
Pivots Analysis.
l Monthly Pivot - LV Relationship -Trending Range month.
l Weekly Pivot - HV relationship - Trading Range week.
l Daily Pivot - LV Relationship - Trading Range day.
l Pivot Width Analysis - Trending day - 0.40
l DR - 261.45>137.60 (DR=<50% of ADR to confirm trending day)
l GPZ - H3GPZ (Resistance GPZ)
Key levels.
l PDH/PDL - Done.
l PD Turning Points - Done
l PD Supply and Demand Zone (1HR TF) - Done
l Swing High/Low - Done
l Gaps - Done
l Virgin CPR - None
Summary
► DTF is in area with "BEARISH MARBUZZO", which infers sellers dominant bias.
► Pivot analysis infers TRADING RANGE bias.
► CPR is in "LOWER VALUE WIDE RANGE" relationship.
► Support levels 16850/16799
► Resistance levels 17500/17480.
**FII have sold total of 44207 crores in total for this month. Hence, always look any up move with skepticism.**
**********************************************************************************
Trading Plan
1. Any bullish PA above 17422 is stop of 17374 and target of 17500.
2. Any bullish PA above 17048 is stop of 17000 and target of 17142.(Scalp)
3. Any bearish PA below 17338 is stop of 17388 and target of 17263.(Scalp)
4. Any bearish PA below 16997 is stop of 17052 and target of 16930.
Two rules that I follow religiously while trading
► Don’t trade until 9:30, unless it’s a trending day.
► Once you Reach 1:1 RR ratio move u SL to cost and book 50% if you are conservative trader.
This information is for education purpose only. So, please consult your financial advisor for any investment/trading advise.
Bonne chance!!
@Sacredmonkey.

Dwarkesh Sugar: Will it break out to return a +30% gain?Dwarkesh Sugar is currently trading in a tight range and most likely forming a pivot range of <= 7%
What is the trade idea?
Stock has risen 222% within 21 weeks and formed a good 2T VCP pattern. Now it's been consolidating for a good 17 weeks and with the low risk range that’s currently in progress, it is on my high alert now.
My expectation is that 78.50 should be crossed in the coming two weeks. (hopefully ;-) the markets have a tendency to surprise, always, and I'm wrong about 60% of the times)
I am expecting a possible consolidation within the marked tight range box for the next two weeks.
Here's my Trade Plan
Entry : On Breakout above at 80.40
Initial Stop Loss (ISL): Below @ 66.80 (SL based on structure)
Note: Breakout needs to be supported with high volumes.
Potential Targets: 97.50, 105.90
Need to watch carefully what the price action will do around the resistance of 84 levels. If that is convincingly crossed, then both upper targets have a good probability of being achieved.
Since price has been consolidating for long, my expectation is that 84 ought to be crossed decisively. Keeping fingers crossed though.
Chart marked with the trade plan. Please feel free to clarify your doubts, and trade safe.


Nifty Trading Plan - 29th JulySummary
► DTF is in area with "BEARISH HAMMER", which infers "sellers dominant" bias".
► Pivot analysis infers TRADING RANGE bias.
► CPR is in "LOWER VALUE WIDE RANGE" relationship.
► Support levels 15605/15578
► Resistance levels 15778/15735.
FII have sold total of 18300 crores in total for this month. SO, my suggestion it would be better if we take short trades.
► TRADING PLAN ACCURACY DATA SHEET - docs.google.com
**********************************************************************************
Trading Plan
1. Any bullish PA above 15714 is stop of 15692 and target of 15753. (Scalp)
2. Any bullish PA above 15586 is stop of 15559 and target of 115626745.
3. Any bearish PA below 15740 is stop of 15762 and target of 15705. (Scalp)
4. Any bearish PA below 15635 is stop of 15657 and target of 15599.
Two rules that I follow religiously while trading
► Don’t trade until 9:30, unless it’s a trending day.
► Once you Reach 1:1 RR ratio move u SL to cost and book 50% if you are conservative trader.
This information is for education purpose only. So, please consult your financial advisor for any investment/trading advise.
Bonne chance!!
@Sacredmonkey.

Nifty Trading plan - 28th july
Summary
► DTF is in area with "MARUBUZZO", which infers "sellers dominant" bias".
► Pivot analysis infers TRADING RANGE bias.
► CPR is in "LOWER VALUE WIDE RANGE" relationship.
► Support levels 15696/15656
► Resistance levels 15793/15778.
Don't rush into taking trades. since, its trading range day. wait for extra confirmation.
Most of traders make money on TRENDING DAY and lose on TRADING RANGE DAY. Don't be that guy!
TRADING PLAN ACCURACY DATA SHEET - docs.google.com
**********************************************************************************
Trading Plan
1. Any bullish PA above 15796 is stop of 15774 and target of 15818. (Scalp)
2. Any bullish PA above 15716 is stop of 15695 and target of 15745.
3. Any bearish PA below 15815 is stop of 15829 and target of 15792. (Scalp)
4. Any bearish PA below 15688 is stop of 15662 and target of 15707.
Two rules that I follow religiously while trading
► Don’t trade until 9:30, unless it’s a trending day.
► Once you Reach 1:1 RR ratio move u SL to cost and book 50% if you are conservative trader.
This information is for education purpose only. So, please consult your financial advisor for any investment/trading advise.
Bonne chance!!
@Sacredmonkey.

Nifty Trading plan - 27th July Summary
► DTF is in area with "Bearish Doji", which infers "sellers being dominant" bias".
► Pivot analysis infers sideways/breakout bias. But, ADR is pretty high hence, big whipsaws are possible, but one sided moves are of low probability.
► CPR is in "UNCHANGED VALUE" relationship, which suggests breakout or sideways tomorrow.
► Support levels 15735/15700
► Resistance levels 15895/15941.
► FII sold 2376 crores, second highest in this month. So, below point is kind of getting true.
► I am repeating what I said on 14th July. " Market in DTF market is moving sideways which infers STAGE 3 as per Stan Weinstein methodology, which means all big folks are selling their shares to retail folks hence, expect correction".
► I may think of creating a strategy to go short on positional in INDEX with proper hedge. This is just a plan and not in motion yet.
**********************************************************************************
Trading Plan
1. Any bullish PA above 15908 is stop of 15887 and target of 15941. (Scalp)
2. Any bullish PA above 15946 is stop of 15923 and target of 15991.
3. Any bearish PA below 15825 is stop of 15847 and target of 15799. (Scalp)
4. Aggressive short below 15807 is short with stop of 15822 and target of 15756.
Two rules that I follow religiously while trading
► Don’t trade until 9:30, unless it’s a trending day.
► Once you Reach 1:1 RR ratio move u SL to cost and book 50% if you are conservative trader.
This information is for education purpose only. So, please consult your financial advisor for any investment/trading advise.
Bonne chance!!
@Sacredmonkey.

HINDUNILVER - Trading plan 27th JulySummary
► DTF is in area with "Bearish Hammer", which infers "sellers being dominant" bias".
► Pivot analysis infers TRENDING DAY bias and ADR is below 0.50 which suggests high probability of TREND DAY.
► CPR has "narrow range LV" relationship, which suggests breakout tomorrow.
► Support levels 2332/2319
► Resistance levels 2371/2356.
**********************************************************************************
Trading Plan
1. Any bullish PA above 2350.75 is stop of 2345.50 and target of 2359. (Scalp)
2. Any bullish PA above 2356.65 is stop of 2350.75 and target of 2370.
3. Any bearish PA below 2351 is stop of 2361 and target of 2340. (Scalp)
4. Aggressive short below 2345 is short with stop of 2353 and target of 2331.
Two rules that I follow religiously while trading
► Don’t trade until 9:30, unless it’s a trending day.
► Once you Reach 1:1 RR ratio move u SL to cost and book 50% if you are conservative trader.
This information is for education purpose only. So, please consult your financial advisor for any investment/trading advise.
Bonne chance!!
@Sacredmonkey.

Nifty trading Plan - 16th JulySummary
► HTF is in uncharted area with a Bullish candle, which infers "Positive" bias". If sellers can push market below 15760 then we may see sellers upper hand, else Bulls will take control.
► Pivot analysis infers TRENDING DAY bias.
► Support levels 15895/15858
► Resistance levels 15941.
► If market can hold off tomorrow and close above 15850, we may see bullish momentum for few week/medium term.
► I don’t know how many of you noticed, but OPEN INTEREST went way too high today for the month July. So, can we expect a momentum play in this month? Do, let me know in comments.
► PS: I am not into OI readings, but since it’s a significant change bought this to attention, would love to know from some experts here.
**********************************************************************************
Step 1 - Strategies to be deployed -
l Open drive .
l PPT.
l CPRRVL
Step 2 - Trading Plan
1. Any bullish PA above 15900 is stop of 15881 and target of 15936.
2. Any bullish PA above 15925 is stop of 15905 and target of 15952 . (Scalp)
3. Aggressive long above 15968 is stop of 15951 and target of 16000.
4. Any bearish PA below 15883 is stop of 15901 and target of 15861. (Scalp)
5. Aggressive short below 15852 is short with stop of 15869 and target of 15815.
This information is for education purpose only. So, please consult your financial advisor for any investment/trading advise.
Bonne chance!!
@Sacredmonkey

Nifty Trading Plan - 19th July Summary
► HTF is in uncharted area with "Inverse Hammer candle", which infers "highly negative" bias".
► I believe sellers are dominant, but expect support at 15830-15850. As I said last week, am bullish until 15730 is broken convincingly.
► Pivot analysis infers TRENDING DAY bias. This is the first time in months that I am seeing CPR is such a tight range i.e. CPR width is literally "ZERO". But, ADR is at 0.75, would have higher conviction if ADR was less than 0.50 of daily range.
► But, watch out for some crazy trending day or closely fought battle of buyers and sellers.
► Support levels 15895/15858
► Resistance levels 15962.
► If market can hold off tomorrow and close above 15850, we may see bullish momentum for few weeks/medium term.
Market has chances of gapping up or down. So, hold your horses before jumping into trade. :)
**********************************************************************************
Step 1 - Strategies to be deployed -
l Open drive .
l PPT.
l CPRRVL
Step 2 - Trading Plan
1. Any bullish PA above 15885 is stop of 15866 and target of 15923.
2. Any bullish PA above 15834 is stop of 15815 and target of 15854. (Scalp)
3. Any bullish PA above 15947 is stop of 15923 and target of 15987.
4. Any bearish PA below 15923 is stop of 15936 and target of 15882. (Scalp)
5. Aggressive short below 15877 is short with stop of 15897 and target of 15837.
This information is for education purpose only. So, please consult your financial advisor for any investment/trading advise.
Bonne chance!!
@Sacredmonkey

Nifty Trading Plan - 14th JulySummary
► HTF is again is crucial demand zone. DTF has a "Hammer" candle, which infers "Positive" bias".
► Pivot analysis infers Trading Range DAY bias.
► ADR levels are below 0.50 hence, it infers trending day but, CPR width is not encouraging. So, be ready for double distribution day or mild trending day.
► Support levels 15793/15735
► Resistance levels 15895/15850
► Support levels has Multiple pivot point zones, which infers good support. Above 15760 we may see some buying. So, keep a watch, unless market gaps up or down.
► I want to highlight one thing, in DTF market is moving sideways which infers STAGE 3 as per Stan Weinstein methodology. Hence, expect some correction in medium term.
**********************************************************************************
Step 1 - Strategies to be deployed -
l Open drive .
l PPT.
l CPRRVL
Step 2 - Trading Plan
1. Any bullish PA above 15800 is stop of 15781 and target of 15830.
2. Any bullish PA above 15768 is quick scalp with stop of 15749 target of 15790.
3. Any bullish PA above 15749 is stop of 15729 and target of 15789.
4. Any bearish PA below 15840 is short with stop of 15860 and target of 15800.
5. Any bearish PA below 15790 is short with stop of 15809 and target of 15764.
This information is for education purpose only. So, please consult your financial advisor for any investment/trading advise.
Have a nice day!!
@Sacredmonkey

Nifty Trading Plan - 13th July
Summary
► HTF is again is crucial demand zone. DTF has a "Inverse Hammer" candle, which infers "Negative" bias".
► Pivot analysis infers Trading Range DAY bias.
► Any upward movement is an opportunity to sell, provided it's in right levels.
► Support levels 15633/15605
► Resistance levels 15780/15745
► Demand zone will have lot of buyers, so don’t sell at first chance, wait for an uprise and check for strength of candles before committing.
► Crucial zone is "confluence zone". Watch closely to trigger for momentum and taking trades.
**********************************************************************************
Step 1 - Strategies to be deployed -
l Open drive rejection.
l PPT.
l Evening star.
l RCR
l CPRRVL
Step 2 - Trading Plan
1. Any bullish PA above 15795 is stop of 15773 and target of 15836.
2. Any bullish PA above 15720 is quick scalp with stop of 15699 target of 15743.
3. Any bullish PA above 15647 is stop of 15626 and target of 15691.
4. Any bearish PA below 15691 is short with stop of 15717 and target of 15652.
5. Any bearish PA below 15625 is short with stop of 15645 and target of 15585.
This information is for education purpose only. So, please consult your financial advisor for any investment/trading advise.
Have a nice day!!
@Sacredmonkey
