Tata Motors-2-Chart AnalysisTata motors CMP:786.45; RSI: 36.35;
TATAMOTORS has completed 5 wave impulsive -Primary Bull cycle phase on weekly chart basis and now in corrective of ABC wave in formation . Corrective Wave-A has bottomed out and wave-B may give a swing trade opportunity for aggressive trader . This wave-B may take the Tata Motors shares at levels of 969-980 levels.
In Long term view is still avoid and fresh entry is suggested only for swing trade.
On daily chart basis, also 5 wave structure has formed as identified in chart structure, It suggest script will now reverse as it has entered wave-a formation.
Chart structure suggest a swing trade is open. The key crucial levels are listed below
Swing Trade Target 1: 969-980; Target 2: 1000-1020.
Stop Loss : 710
✅ For more trading ideas like this, please like, share, and follow my Idea Stream ✅
Primarytrend

Dow theory - 3 kinds of trend1. Primary trend (9months to 2 years)
2. Secondary trend (6 weeks to 9 months)
3. Minor trend (few days to few weeks)
> Black line is the primary trend
> Green lines are an example of a secondary trend.
> Blue lines are minor trend.
Always trade with harmony of a primary trend.
Note : only for learning.

INDIAMART on Primary Support ZoneThe price of Indiamart is on Primary Trendline Support zone!! INDIAMART is about to sky rocket!

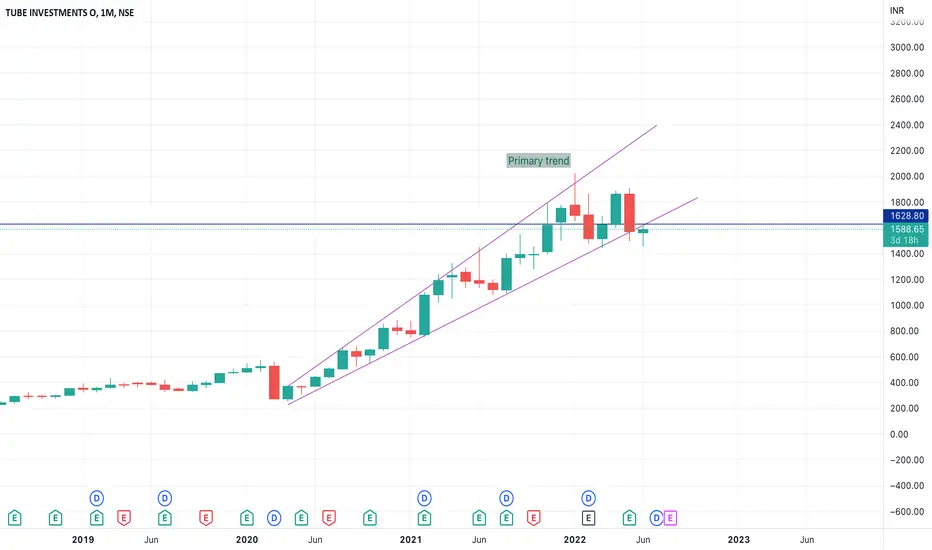
TUBE INVESTMENT - Long term Trend AnalysisTUBE INVESTMENT - Long-term Trend Analysis
1. It breaks the primary trend in daily and weekly candles. Negative sign.
2. The last chance is this week, if it closes above 1630 then it may get an upward reversal.
3. If it falls under the primary trend it has a bright further.
4. first upward target is 1860 and if the market reveals means 2400 will be the ideal target for it.
5. It's a long-term analysis, if it is not able to break 1630 this month or next month if it is open below 1650 it may continue the downtrend.
6. Based on up or downside reversal investors can take the call.
Note:
1. I’m not a SEBI Registered advisor, my research is personal and for educational purposes only.
2. Always check with your financial advisor and take the trade as per your risk/reward ratio.
3. Follow me for more patterns and like, and share so that we feel it is helpful to many and share more patterns...
KYC - Know Your Chart - NIFTYPhases of a Market:
1. Accumulation
2. Advance
3. Distribution
4. Decline
This is the NIFTY during 2001-2010 decade.
Always look for the primary trend in the broader market .
Plan your trade accordingly.

PEL - Long Falling Wedge Breakout Since 2019 - Towards TargetsPresently in Flag-Pole Breakout
Long Journey AHEAD
Target Levels : 2090, 2300,2604
Note: This is for Educational Purpose
