Bank Nifty Analysis post expiry!If you look at 30 min chart of Bank nifty for today session it was clear from start of the day that buyers are going take the session look at first 30 min candle a pure "bullish wick reversal pattern" it confirmed that options buyers will take over the day!!
Already discussed on 31st Jan analysis keep eye on opening for confirmation of trade. "Check" 45400 ce was trading at 200 at 10 am at 10.15 am it closed at 556 a net 323 points candle it makes your day!
lets look for tomorrow might be same action as today as bank nifty was trading in range in later sessions. But also failed to break resistance twice May take jump from last support at 45600. Still bullish side are bit stronger.
Gap down opening can change the view from bullish to bearish.
Resis - 46200,46550
Supp - 45670,45400
Purepriceactionanalysis

After 12 Years Breakout for NMDC ● STOCK : NMDC ●
KEY POINT 🔑
●●●●●●●●●●●●●●●●
➡️ Time Frem : Daily , Weekly
➡️ After 13 Years Consolidated Zone Breakout
➡️ Strong Volume
➡️ RSI Positive 60++
BUY : 162
STOP LOSS : 148
TARGATE : 200,220
☆ Long time be Good stock ☆
¤ NOTE ¤
This is our personal trade for learning and not a recommendation to buy

CDSLTradeline Breakout Strategy
Tradeline with CUP Pattern
Long Time
BUY : CDSL
CMP : ₹1228
Breakout Price : 1247
Targate 1 : 1438
Targate 2 : 1600
Targate3 : 1686

IS GOLD WILL MAKE ALL-TIME HIGHS OR NOT ?| MY NEXT TRADE All the key points, aspects, and probabilities are clearly mentioned on the Chart. Kindly do your own research before entering.
THANK YOU

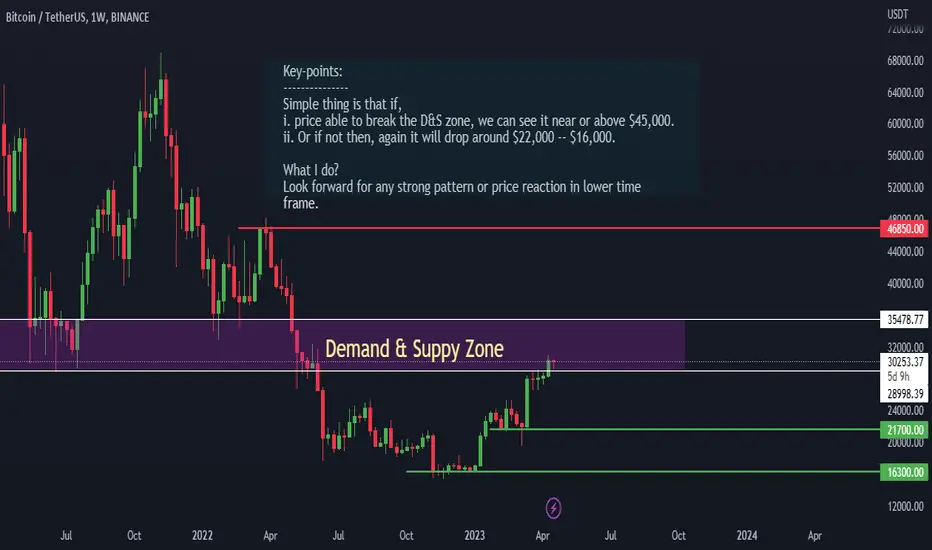
Is BITCOIN going to FALL again? All the key points, aspects, and probabilities are clearly mentioned on the Chart. Kindly do your own research before entering.
THANK YOU

A Comprehensive Analysis of Bitcoin Future Price MovementAll the key points, aspects, and probabilities are clearly mentioned on the Chart. Kindly do your own research before entering.
THANK YOU
banknifty BREAK or NOT?All the key points, aspects, and confirmations are clearly mentioned on the Chart. Kindly do your own research once before entering.
THANK YOU

Where BANKNIFTY going NEXT . . .?All the key points, aspects, and confirmations are clearly mentioned on the Chart. Kindly do your own research once before entering.
THANK YOU

BITCOIN NEXT MOVE All the key points, aspects, and confirmations are clearly mentioned on the Chart. Kindly do your own research once before entering.
THANK YOU

BITCOIN again ready for $33,000All the key points, aspects, confirmations are clearly mentioned on the Chart. Kindly do your own research once before entering.
THANK YOU

Natural Gas (MCX) : 7.50 % Future returnsNatural Gas (MCX) : 7.50 % returns at 11.30am 24.02.2022 HOW ???
1.Trend line Breakout
2.Above SMA 200 support
3.RSI 50 Support.
4.100% PURE Price action .
5.simple setup
You know 1 lot = 1250 /-
25 rupees changed(7.50% future returns)
=25*1250= 31250/-
1 lot future returns.

BTC POSSIBLE DOWNTREND BTC is already in a strong downtrend and now is in a sideways zone. So, I analyze the next possible move using simple S/R. If there is anything else feel free to comment.
NOTE: DO YOUR OWN ANALYSIS BEFORE ANY INVESTMENT
Thank You

ULTRACEMCO ANALYSIS RESULT ultratech cement forming daily candle in my previous analysis and now bearish movement start now create bearish traingle here

BTCUSDT 4th sep analysis result 1st tgt achiveMy previous BTCUSDT analysis set fib level tgt and after 1 day 1st tgt achive wait for next tgt

GBPUSD FUTURE OPPORTUNITIESHello Traders,
In the above analysis: I'm showing the both scenario may happen on GBPUSD pair with the help of simple SUPPORT/RESISTANCE.
Where,
GBPUSD is on a sideways from last 15 day at range of 1.42340 to 1.40990. So the analysis says: if it'll break this resistance(1.42340) then we will see a new high on GBPUSD after 3 years of downtrend or if it fail to break resistance & came below support (1.40990) then next target will be 1.40290.
You can use this analysis on intraday & swing both. Use proper risk management if enter.
Best of Luck
Happy trading

BNBUSDT NEXT MOVEMENTBNB recently respected its old support at 227 & get a nice bounce from there so if it goes in this same direction then the next targets will be:
1st>>>400
2nd>>>608
3rd>>>680 OR
If can't hold it upward move & fall below 227 support then we will see it's in a new DIP.
So, take advantage of both scenarios as per your strategy & capital.
HAPPY TRADING

BTC Possible Movements in Future Currently, BTC stays on its strong support at $45,000, if break from here:
BELOW: possible target will be $29,500
ABOVE: possible target will be $64,200n
So, now wait for the market move>>>>> USE 2 R/R ratio & 2% risk per trade
HAPPY TRADING


GBPUSD LONG SWING OPPORTUNITY GBPUSD recently broke its multiple rejection RESISTANCE at 1.4000 & drastically go up. Another side's already in an UPTREND for the last few months so, Price action analysis says it's a good time to buy/long GBPUSD as a SWING TRADE.
Remember: Close 50% trade at take-profit:1 & move Stoploss at Breakeven. There is resistance at Take-profit:2 so if we use this trailing strategy then our trade will be safe
TAKE 2%---5% RISK ON THIS SWING TRADE
BEST OF LUCK!


Indian Oil- Downtrend AheadA sell from near~136 till 113-115 is upcoming.
Trending Buy with strength shall be from 113-115 level till target shown in chart.
Happy Investing!

