Glenmark showing signs of institutional presence. Taking support after breakout on 18th November is a good sign confirming the institutional presence in the stock. The stock is now setting up tone for a strong move up with supporting volumes and momentum. The RSI is positive into the bullish zone and MACD well above the neutral zone with positive bias. Longer term targets are close to 485 levels!
Relative Strength Index (RSI)
Mid Caps showing signs of recovery. Shopping List!The MID Cap index took support and bounced back. The level from which the index bounced was very strong inflection point. Two back to back bullish candle with good volumes indicates real interest in the stock. Moreover there is a long term positive signal in RSI and MACD is positive with bullish bias. All these indicate that mid caps may pick up pace in coming weeks.
Bank Nifty close to 31000. It's a important support level.In my last Friday’s update I mentioned that we may see banknifty trading at 31000 levels. The index registered a close at 31160 today. Now it’s trading close to a support level the KS line. A major support is at 30600. Most of the time KS acts as a very good support for prices, so a bounce from it is not ruled out. 31600 will be the decider level for coming sessions, a strong close above it will only result in trend resumption. The RSI is pointing down while MACD lags upside momentum.
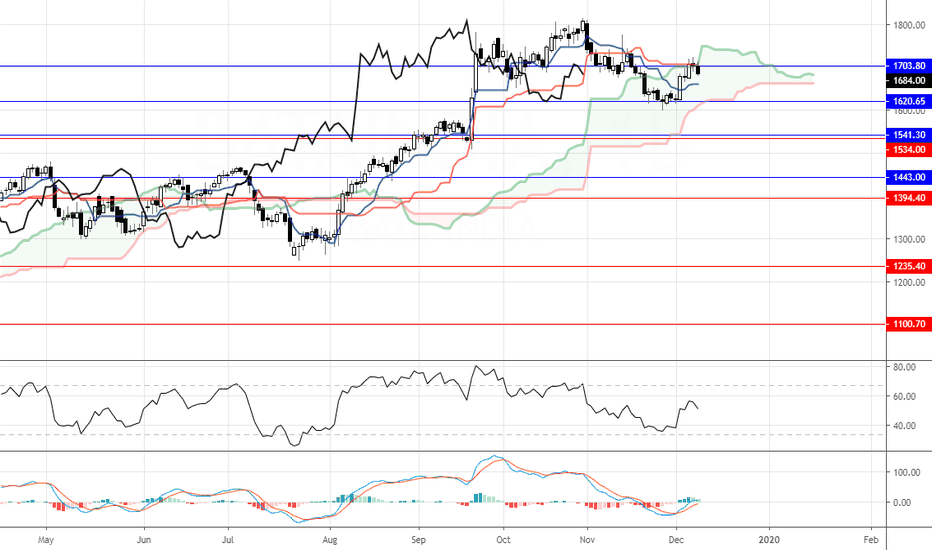
Bata India: Has the trend bent?The stock was into dominant trend up, last few months the stock hasn’t displayed any zeal to move up. Now at a high intensity resistance level, the price consolidated and formed a negative candle pattern. The RSI is into neutral zones creating bearish signs. Macd is into bearish zone. The stock is expected to correct to 1620-1540 levels where it may find support. Above 1735 the bearish analysis is negated.
Trading close to a very important level. NIFTY: Nifty took beating from the bears in the last two sessions. Now at a very key juncture, a break and close below the 12000 levels have shattered the physiological support levels, still the bullish nature is not wiped out fully, if the fall continues the index may tumble to 11420 levels, again the levels I am mentioning may be vague & outrageous but still they are valid as long as selling in prominent. A minor support may be seen at 11790 below which the above targets on the downside is open.
Infy is facing a mammoth resistance pressure.Infosys took resistance at a very strong pivot point and fell back. The stock is still into down trend and the move up may be classified as a mere pullback. The last bar is a bear bar. A small support is at 694 levels, breaking this will result in sell off and infy may travel down towards 656 zones.
A very crucial price action bar formed on BPCL todayBPCL: An important candle formation has been printed on the BPCL daily chart. It’s a bear engulfing candle along with a “double key reversal” action. This is a very prominent signal in shift of control from bulls to bears. Also RSI has taken resistance at 60 levels with a bear divergence, a strong loss of momentum! Any further decline especially below 500 can will not be a good news for BPCL bulls.
Bhel : Holding Bullish Range ShiftBHEL: In my previous updated i mentioned the range shift fact in the stock. The stock is reattempting breakout from the clouds. In today’s session it created a bullish candle. The macd is turning up while rsi is comfortably above 50 levels. The chikou is free As long as 51 levels are protected the stock is expected to move up in the near term.
UPL: Gearing for some upside ..After witnessing a sharp decline since May this year UPL has managed to stage a slow but steady revival . The daily charts reveal a steady trended action that is seen generating a demand at every pullback. The ascending trendline support suggests that the uptrend is intact and we could see more upside as value area resistance around 600 has been overcome. With the RSI also rebounding from the neutral zone one could expect that the bullish bias could persist and one should look to participate at current levels for an upside towards 645. One could also look at dips towards 590 as an additional / alternate levels to buy into. The stop for the trade would be below 580 at the time of initiation.
Idea sourced from NeoTrader
trade.chartadvise.com
GBPUSD testing 1.2900 levelThe British pound has fallen to a new monthly trading low against the US dollar as the bearish head and shoulders pattern break is increasing technical selling on the pair. The 1.2880 level is critical support below the 1.2900 level, with the 1.2840 level acting as extended intraday support. GBPUSD bulls need to move price above the 1.2960 level to negate immediate bear pressure.
The GBPUSD pair is heavily bearish while trading below the 1.2960 level, key support is found at the 1.2880 and 1.2840 levels.
If the GBPUSD pair trades above 1.2960 level, key intraday resistance is found at the 1.2975 and 1.3000 levels.
EURUSD targeting 1.1100The euro currency has fallen to a fresh 2019 trading low against the US dollar, hitting 1.1135, as the greenback continues to surge higher across the board. The technical picture for the EURUSD pair is increasingly bearish, with price now trading below the neckline of the head shoulders pattern. The next major downside target for EURUSD sellers is likely to be the 1.1100 support level.
The EURUSD pair is heavily bearish while trading below the 1.1175 level, key technical support is found at the 1.1135 and 1.1100 levels.
If the EURUSD pair trades above 1.1175 level, key intraday resistance is found at the 1.1216 and 1.1230 levels.


