BUY TODAY SELL TOMORROW for 5% - BTST STOCK OPTIONDON’T HAVE TIME TO MANAGE YOUR TRADES?
- Take BTST Stock Option trades at 3:25 pm every day
- Try to exit by taking 4-7% profit of each trade
-Resistance Breakout in DIVISLAB
BUY TODAY, SELL TOMORROW for 5%
Resistence

Senores pharma breakout possibleUS fda approved facility which prevents them from any risk of tariff, very good guidance and growth projections. breakout possible very soon

BUY TODAY SELL TOMORROW for 5% - BTST STOCK OPTIONDON’T HAVE TIME TO MANAGE YOUR TRADES?
- Take BTST Stock Option trades at 3:25 pm every day
- Try to exit by taking 4-7% profit of each trade
- Head & Shoulder Breakout in IIFL
BUY TODAY, SELL TOMORROW for 5%

SOL DUMP TO THE $40YES, YOU SEEN RIGHT
CRYPTO:SOLUSD
SOL ready with multiple negative patterns.
1. all time resistance
2. triple top
3. cup and handle failure
First pattern is already activated and triple top near to active.
Reverse scenario
take support from major strong support. cup and handle breakout
🧠 Always DYOR (Do Your Own Research)
⚖️ This is not financial advice or suggestion
👉 “Risk Is Real 💸 Stay Practical🚀”
💬 Please feel free to ask any questions (It's Free)

Gold direction today November 17📊 Support – Resistance – Fibonacci Analysis
1. Trend Overview
Price has broken below the ascending channel, signaling a shift into a corrective downtrend phase.
2. Key Resistance Zone
4,215 – 4,230
Confluence of Fibonacci retracement 0.5 – 0.618
Overlaps with a supply zone + EMA89
→ Strong resistance, high probability of selling pressure.
This is also the expected pullback/retest area before the next bearish leg.
3. Key Support Levels
Support 1 – 4,000
Fibonacci extension 0.5
Horizontal support
→ Likely to generate a short-term reaction.
Support 2 – 3,890
Major downside target if the structure fully breaks
→ Primary bearish target for a deeper continuation.
4. Price Scenario
Price may pull back toward 4,215 – 4,230.
BUY GOLD : 4000 - 3997
Stoploss : 3987
Take Profit : 100-300-500pips
SELL GOLD : 4212 - 4215
Stoploss : 4225
Take Profit : 100-300-500pips

Part 2 How to Draw Accurate Support and Resistance LevelsParticipants in Option Trading
There are four primary participants in the options market:
Buyer of Call Option (Long Call) – Expects the price to rise.
Seller of Call Option (Short Call) – Expects the price to fall or remain flat.
Buyer of Put Option (Long Put) – Expects the price to fall.
Seller of Put Option (Short Put) – Expects the price to rise or remain flat.
Each participant has a specific risk-reward profile. Option buyers have limited risk (the premium paid) and unlimited profit potential. Option sellers, on the other hand, have limited profit (premium received) but potentially unlimited risk.

Part 2 Support and Resistance Why Traders Use Options
Options are versatile instruments. Traders use them for:
Speculation – Betting on price movement to earn profits.
Hedging – Protecting existing investments from adverse price moves.
Income Generation – Selling options (writing) to earn the premium.
For example:
A trader may buy a call option expecting prices to rise.
A portfolio manager may buy put options to protect their stocks from falling prices.
An experienced investor may sell covered calls to earn regular income.

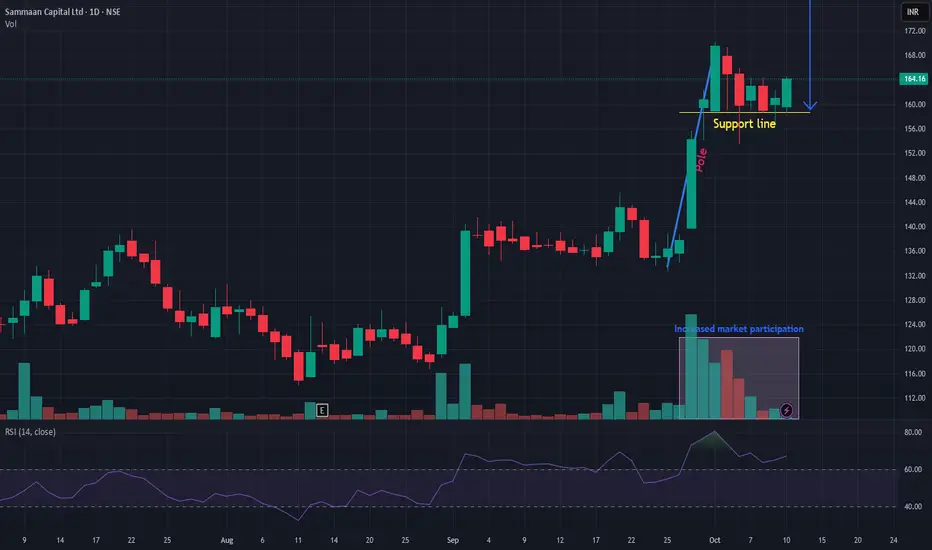
SAMMAANCAP SAMMAANCAP is showing very good strength and currently available at low risk. Forming VCP pattern. Seems like currently facing from sideways and may come out of the range and will take a new ride above resistance line. Risk-reward quite in favor. Keep it in a watchlist.
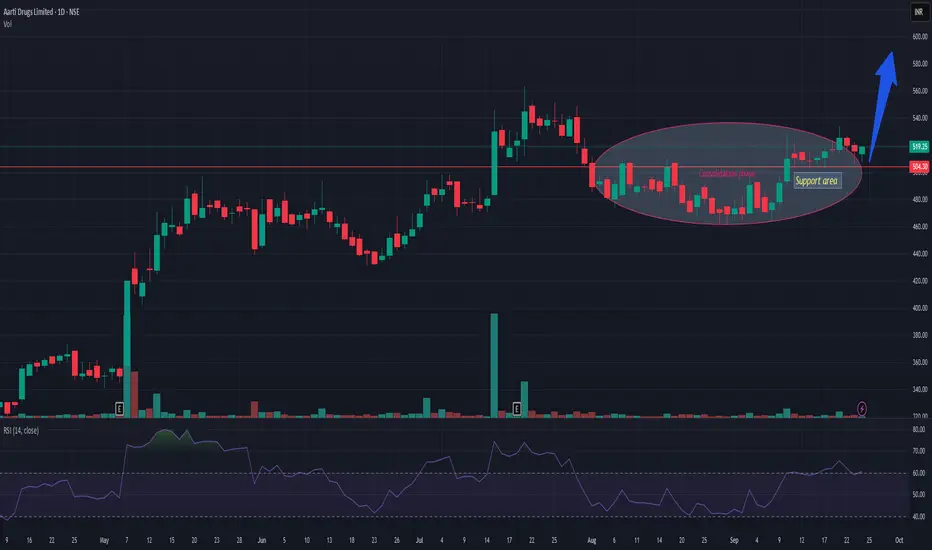
AARTIDRUGSAARTIDRUGS is trading in long consolidation zone with dried volume. Support zone is near 495-500. Currently trading near 515-17. Once it gets market participation then the probability of resuming continuation of uptrend is very high. Risk reward is quite in favor. Keep it in your watch list.
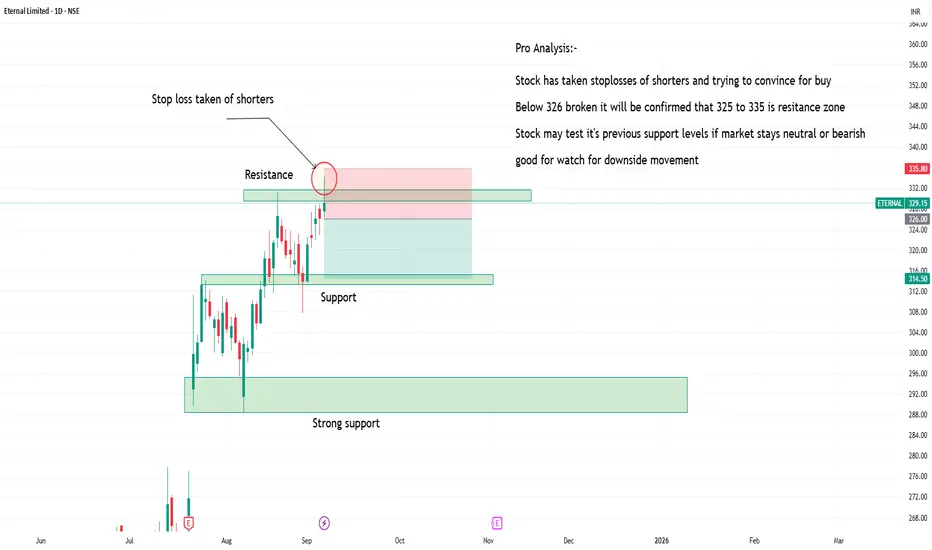
Zomato creating it's resistance zoneZomato is testing it's resistance zone.
one can watch for downside movement with stop losses above recent swing with targets of 215 levels.
it's pure price action.
stock may go in consolidate in zone for long time.
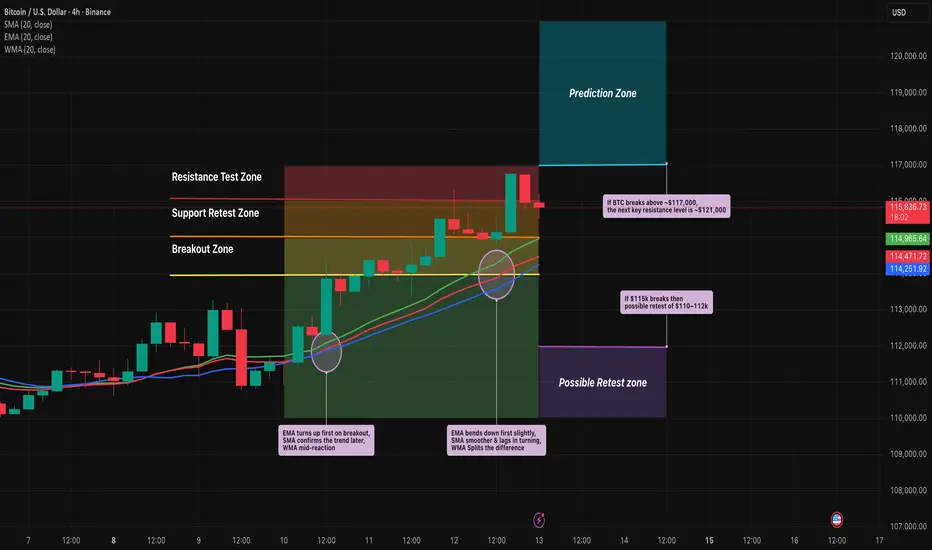
EMA vs SMA vs WMA: Which Moving Average Should You Use?🔎 Intro / Overview
Moving Averages remain one of the most trusted tools in technical analysis. They smooth price action, highlight the trend, and often act as dynamic support or resistance.
In this post, we compare the 20-period SMA, EMA, and WMA on BTCUSD 4H to show how each reacts differently to market moves.
___________________________________________________________
📔 Concept
SMA (Simple Moving Average): Every candle in the lookback is weighted equally → smooth but slower to react.
EMA (Exponential Moving Average): Recent candles carry more weight → reacts faster, hugs price closely.
WMA (Weighted Moving Average): Linear weighting → a balance between SMA’s stability and EMA’s sensitivity.
The difference lies in responsiveness. Faster averages react early but risk false signals, slower averages confirm trends but lag.
___________________________________________________________
📌 How to Use
1️⃣ Plot the 20-period SMA, EMA, and WMA together.
2️⃣ Watch how each responds during pullbacks, rallies, and consolidations.
3️⃣ Use EMA for quicker signals, SMA for smoother long-term view, and WMA if you prefer a middle ground.
4️⃣ Combine with price action or RSI to avoid relying on moving averages alone.
___________________________________________________________
🎯 Trading Plan
Intraday traders: EMA crossovers (e.g., 9 vs 21 EMA) for faster entries and exits.
Swing traders: SMA for identifying trend direction and major support/resistance.
Balanced traders: WMA for medium-term setups where stability and responsiveness matter equally.
Always align the moving average with your trading style and risk appetite.
___________________________________________________________
📊 Chart Explanation
On BTCUSD 4H:
EMA (red) bent upward first during the $114k breakout, SMA (blue) confirmed later, and WMA (green) sat between them.
At the $115k retest, EMA dipped first, while SMA lagged.
At $116.5–117k resistance, EMA whipsawed but SMA stayed smoother.
Notice how these differences become clear during sharp pullbacks, quick rallies, and sideways ranges.
___________________________________________________________
👀 Observation
EMA is quick but noisy ⚡, SMA is calm but late 🕰️, WMA strikes a middle ground ⚖️.
___________________________________________________________
❗ Why It Matters?
Choosing the right moving average impacts how quickly you spot entries, confirm trends, and manage stop-losses. Understanding the differences helps traders adapt strategies to both trending and sideways markets.
___________________________________________________________
🎯 Conclusion
No single moving average is “best.” Each serves a purpose depending on the timeframe and style of trading. The key is consistency — choose one that aligns with your plan, test it, and apply it with discipline.
👉 Which one do you prefer in your trading — EMA, SMA, or WMA?
___________________________________________________________
⚠️ Disclaimer
📘 For educational purposes only ·
🙅 Not SEBI registered ·
❌ Not a buy/sell recommendation ·
🧠 Purely a learning resource ·
📊 Not Financial Advice
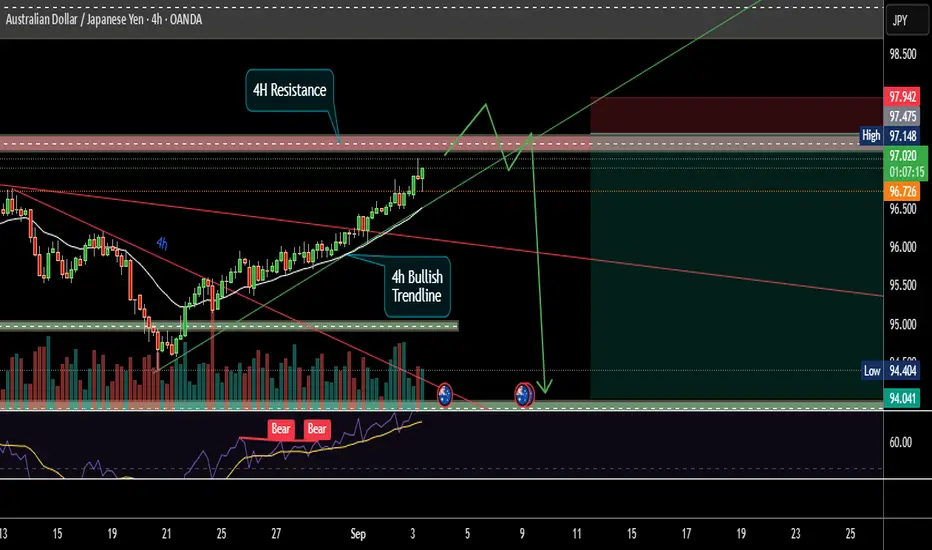
A beautiful AUDCHF high RnR scenarioAUDCHF is approaching 4H resistance zone which has already show rejection previously. There is also a steep bullish trend line creating a confluence. RSI has already shown Bearish Divergence. All these signaling a coming very good sell side opportunity. Below are points detailing the same.
1. Price is approaching 4H resistance zone. Which may act as a strong supply zone.
2. Very steep Bullish Trend line developing a confluence at resistance. Steep trend line are always prone for breakout/breakdown.
3. Most probably price will take liquidity of resistance zone and break trend line.
4. After breaking trend line it should pullback till resistance/trend line or any newly created OB/FVG.
5. RSI also already shown Bearish Divergence and running in oversold zone.
All these combinations are signaling a high probability and high Risk and Reward (1:8) trade scenario.
Note – if you liked this analysis, please boost the idea so that other can also get benefit of it. Also follow me for notification for incoming ideas.
Also Feel free to comment if you have any input to share.
Disclaimer – This analysis is just for education purpose not any trading suggestion. Please take the trade at your own risk and with the discussion with your financial advisor.
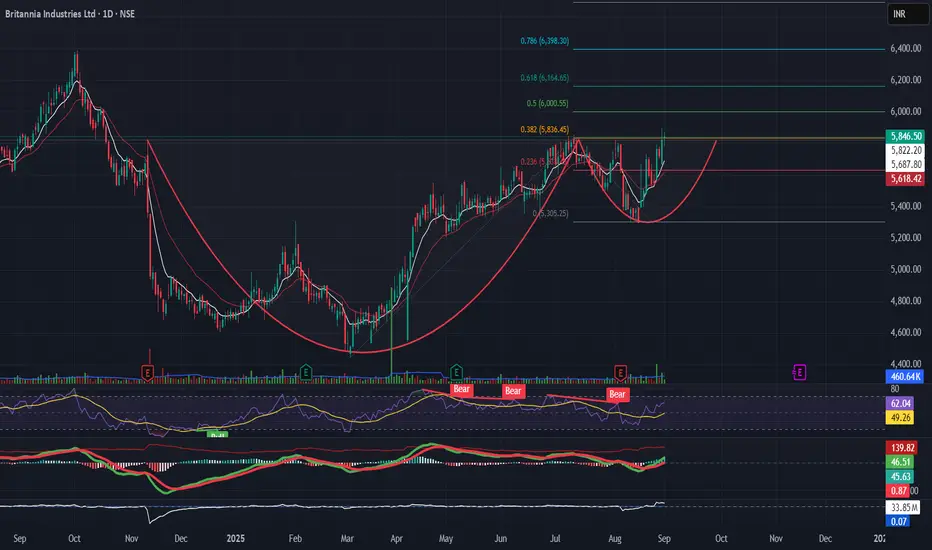
Cup and Handle pattern in Britannia Britannia is ready to breakout from cup and handle pattern
" Right now Britannia is at critical ₹5,836 resistance.
A breakout above this level can extend the rally toward ₹6,000–₹6,165.
Support at ₹5,680.
📊 Sector: FMCG (aligned with consumption strength)"
Britannia is retesting the ₹5,836 Fib resistance (0.382) after forming a cup-like base. Momentum indicators (RSI > 60, MACD improving) support potential breakout.
Quarterly Results Trading (Earnings Season)1. Introduction to Quarterly Results Trading
Every listed company in the stock market is required to disclose its financial performance periodically. In most markets, this happens every quarter—that’s four times a year. These reports are known as quarterly results or earnings reports.
For traders and investors, the release of earnings is one of the most volatile and opportunity-rich periods in the market. Stock prices can jump or crash within minutes of the announcement, depending on whether the company met, beat, or missed expectations.
This period, when a large number of companies announce results within a few weeks, is called Earnings Season. Traders specializing in this period use strategies designed to capture sharp price moves, volatility spikes, and changes in market sentiment.
Quarterly results trading is a mix of:
Fundamental analysis (studying the company’s earnings, revenue, guidance, and business health),
Technical analysis (charts, levels, and patterns),
Sentiment analysis (expectations, media coverage, and market psychology).
2. Understanding Earnings Season
Earnings Season happens four times a year, usually after the quarter ends. For example:
Q1: April – June (Results in July–August)
Q2: July – September (Results in October–November)
Q3: October – December (Results in January–February)
Q4: January – March (Results in April–May)
In India, companies follow an April–March financial year, so Q4 results are particularly important because they also include full-year earnings.
During earnings season, news channels, analysts, and brokerage houses are flooded with earnings previews, result updates, and management commentary. This makes it a period of heightened market activity.
3. Why Quarterly Results Matter for Traders & Investors
Quarterly results are a scorecard of a company’s performance. They reveal whether the business is growing, struggling, or facing new opportunities/challenges.
For investors, quarterly earnings help judge if a company is on track with long-term goals.
For traders, these results create short-term trading opportunities due to volatility.
Key reasons quarterly results matter:
Price Sensitivity – A single earnings report can change a company’s valuation.
Expectations vs Reality – Markets react not to absolute numbers, but to whether expectations were beaten or missed.
Sector Impact – One company’s results (like Infosys or HDFC Bank) often set the tone for its entire sector.
Market Sentiment – Strong or weak earnings can influence the broader indices (Nifty, Sensex, Nasdaq, S&P 500).
4. Key Components of an Earnings Report
When a company announces results, traders look at multiple data points:
Revenue (Top Line) – Total income earned. Growth shows market demand.
Net Profit (Bottom Line) – Profit after expenses, taxes, and interest.
EPS (Earnings Per Share) – Net profit divided by number of shares. A key valuation measure.
EBITDA / Operating Margin – Operational efficiency.
Guidance (Future Outlook) – Management’s forecast for coming quarters.
Special Announcements – Dividends, share buybacks, bonus issues, restructuring.
5. Market Expectations vs Actual Results
Stock price reactions to earnings depend less on actual numbers, and more on how those numbers compare to market expectations.
If a company beats expectations → stock usually rises.
If it misses expectations → stock usually falls.
If results are in-line → limited reaction, unless guidance surprises.
Example: If analysts expected Infosys to report ₹7,000 crore profit, but the company posts ₹7,500 crore, the stock may rally. But if expectations were ₹8,000 crore, the same ₹7,500 crore may disappoint.
This is why earnings trading is not just about numbers—it’s about expectations and surprises.
6. Earnings Surprises and Stock Price Reactions
Earnings surprises are powerful. A positive earnings surprise (beat) can trigger rallies, while a negative surprise (miss) can cause crashes.
Typical reactions:
Positive Surprise → Gap up opening, strong momentum, short covering.
Negative Surprise → Gap down opening, selling pressure, stop-loss triggers.
But sometimes, even strong results cause a stock to fall. This happens if:
The stock was already overbought (priced-in).
Future guidance is weak.
Market expected even better performance.
7. Pre-Earnings Trading Strategies
Traders often take positions before results are announced, based on expectations.
Common strategies:
Momentum Play – If sector peers have posted strong results, traders expect similar performance.
Options Straddle/Strangle – Betting on volatility rather than direction.
Analyst Preview Play – Following brokerage estimates.
Chart-Based Levels – Using support/resistance zones for pre-result positioning.
Risk: If results differ from expectations, positions can go against traders instantly.
8. Post-Earnings Trading Strategies
Many traders prefer to wait until results are out, and then ride the move.
Strategies:
Gap Trading – Playing the gap up or gap down opening.
Trend Continuation – Entering if strong momentum follows positive/negative results.
Fade the Move – If reaction is exaggerated, traders bet on reversal.
Sector Sympathy Play – Trading other stocks in the same sector (if Infosys beats, TCS/Wipro may rise too).
9. Options Trading During Earnings Season
Earnings season is heaven for options traders, because volatility spikes.
Implied Volatility (IV) rises before results, making options expensive.
After results, IV crush happens, reducing option premiums.
Strategies used:
Straddles/Strangles – To capture big moves in either direction.
Iron Condors – If expecting limited movement.
Directional Calls/Puts – If confident about result outcome.
Smart traders manage risk by sizing positions carefully and understanding IV dynamics.
10. Sector & Macro-Level Effects of Earnings Season
Quarterly results don’t just affect individual stocks—they influence entire sectors and indices.
Banking & Finance – HDFC Bank, ICICI Bank results affect Nifty Bank.
IT Sector – Infosys, TCS, Wipro results set the tone for tech stocks.
FMCG – HUL, Nestle results impact consumption sector.
Global Impact – US earnings (Apple, Microsoft, Tesla) influence Nasdaq & Indian IT stocks.
Thus, earnings season often drives short-term market direction.
11. Risks in Quarterly Results Trading
While opportunities are high, so are risks:
Gap Risk – Overnight positions can open with large gaps.
High Volatility – Rapid price swings can trigger stop losses.
Option Premium Decay – IV crush can cause losses even if direction is correct.
Overreaction – Stocks sometimes move irrationally post results.
Risk management is crucial—small position sizing, defined stop-loss, and not overtrading.
Conclusion
Quarterly results trading, or earnings season trading, is one of the most exciting and challenging periods in the market. It offers massive opportunities due to sharp price moves, but also carries high risks.
A successful earnings season trader:
Balances expectations vs reality,
Uses a mix of fundamental + technical + sentiment analysis,
Trades with discipline and proper risk management,
Learns from past case studies and market psychology.
In short, quarterly results trading is a battlefield of expectations, numbers, and emotions. Those who prepare, analyze, and execute carefully can capture some of the best moves of the year.

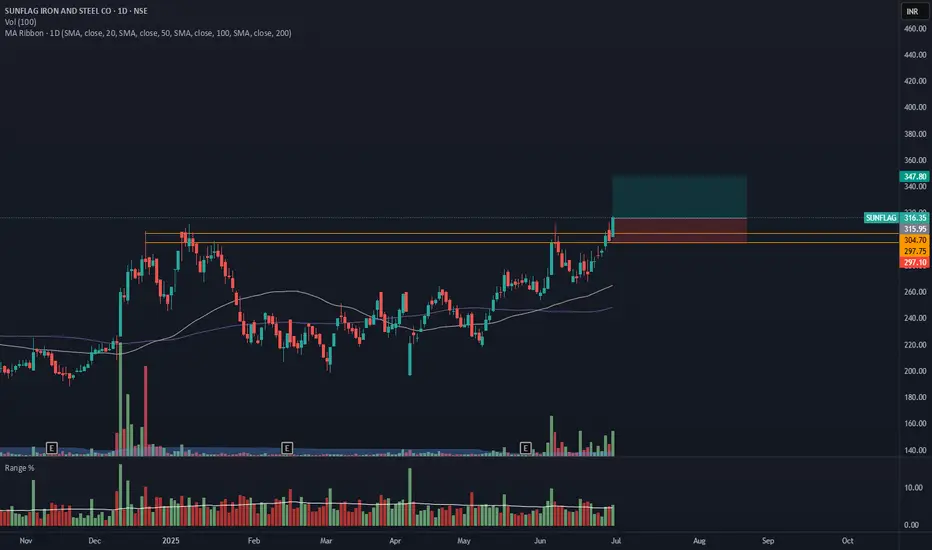
SUNFLAG- Breakout from DTFSUNFLAG has resistance weakening on the Daily charts and has given a breakout with good volume.
The target of this pattern signals an upside potential of 10% from the current price level in the medium term.
The stock is trading above its 50- and 100-day simple moving averages (SMAs). The range is more than 1.2X, and the Volume is also >6X the average.
CMP- Rs. 316
Target Price- Rs347 ( 10% upside)
SL - 297
Disclaimer: This is not a buy/sell recommendation. For educational purpose only. Kindly consult your financial advisor before entering a trade.
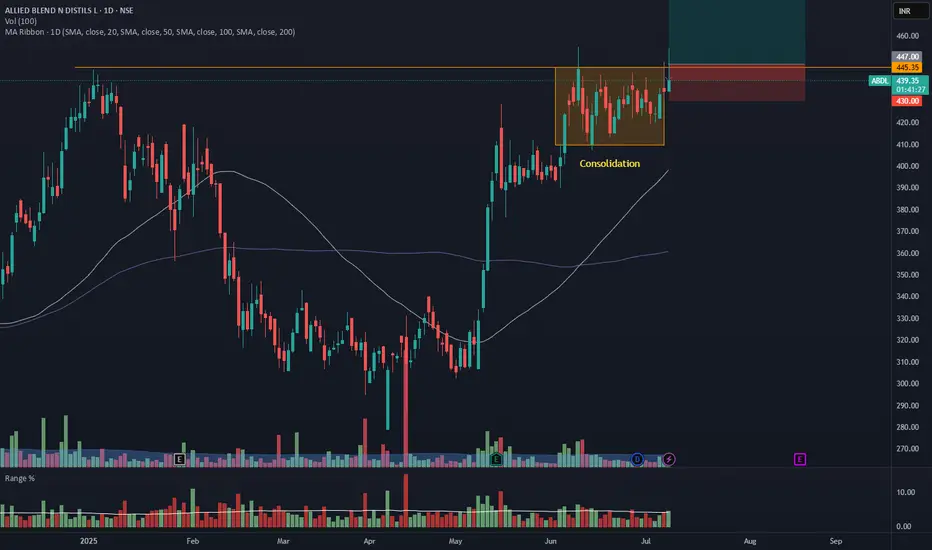
ABDL - Daily Timeframe Breakout Idea (Resistance Zone Break)Allied Blenders and Distillers Ltd. has shown a breakout above a key horizontal resistance level on the daily chart, accompanied by a nearly 2 times volume surge near the breakout zone, as seen earlier, supported by strong momentum.
🔍 Breakout Context:
- Price might break above the ~₹446 horizontal resistance, which had held for over 6 months.
The breakout zone has been supported by 2X volume and a range 1.5X of average near the resistance zone.
- The price is also trading above both the 50- and 100-day SMAs, indicating strong trend continuation.
- This aligns with a bullish continuation setup.
📉 Trade Plan:
- CMP: ₹439.15
- Entry: Near ₹446
- Target: ₹481 (~7.5% upside from CMP)
- Stop-Loss: ₹430
- Risk-Reward Ratio: ~ 1 : 2
📌 Note:
- Look for a confirmation candle to enter the trade.
- Avoid chasing the extended move unless confident in intraday momentum.
⚠️ Disclaimer: This post is for educational purposes only and not financial advice. Always do your research or consult a financial advisor before trading.
NYKAA - Breakout from DTFNYKAA has resistance weakening on the Daily charts and has given a breakout with good volume.
The target of this pattern signals an upside potential of 10% from the current price level in the medium term.
The stock is trading above its 50- and 100-day simple moving averages (SMAs). The range is more than >1.2X, and the Volume is also >2X the average.
CMP- Rs. 108
Target Price- Rs228 ( 10% upside)
SL -202
Disclaimer: This is not a buy/sell recommendation. For educational purpose only. Kindly consult your financial advisor before entering a trade.

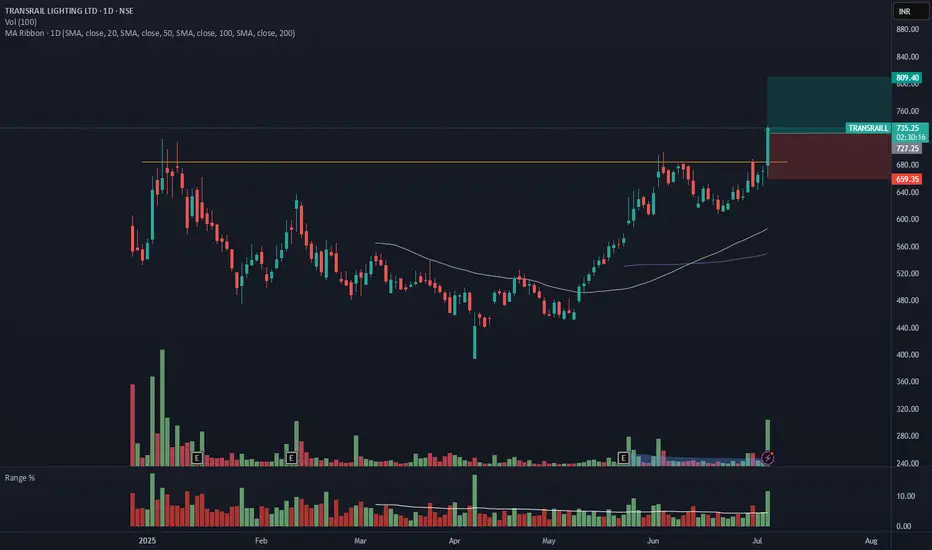
TRANSRAILL - Breakout from Daily TFTRANSRAILL has resistance weakening on the Daily charts and has given a breakout with good volume.
The target of this pattern signals an upside potential of ~10% from the current price level in the medium term.
The stock is trading above its 50- and 100-day simple moving averages (SMAs). The range is more than >2X, and the Volume is also >6X the average.
CMP- Rs. 727
Target Price- Rs.805( ~10% upside)
SL -859
Note- The breakout candle has gone up, extended, so be mindful of your position.
Disclaimer: This is not a buy/sell recommendation. For educational purpose only. Kindly consult your financial advisor before entering a trade.
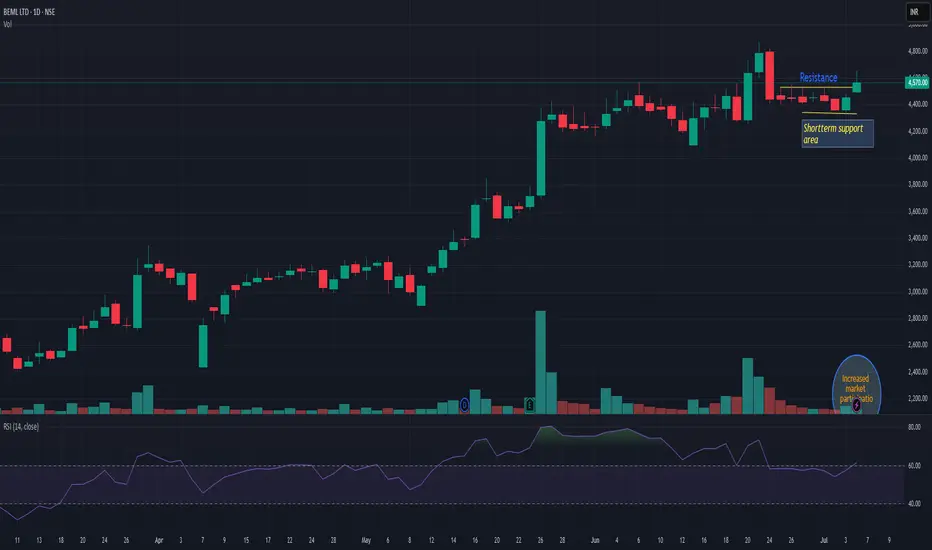
BEMLBEML is trading above resistance line with very decent volume. As long as it is trading above support line, momentum may continue. Recently fresh momentum has been observed on majority defense stock. If today it is closing above 4600 then we may see momentum for next 12-15%. Keep it on radar.
CHOLAFIN- Breakout from DTFCHOLAFIN has resistance weakening on the Daily charts and has given a breakout with good volume.
The target of this pattern signals an upside potential of ~10% from the current price level in the medium term.
The stock is trading above its 50- and 100-day simple moving averages (SMAs). The range is more than >1X, and the Volume is also >1X the average.
CMP- Rs. 1628
Est. Entry price ~ 1670
Target Price- Rs1813 ( ~10% upside)
SL -1610
Note- The candle closed isn't very promising, so we have to wait for a stronger move. The promising move should be able to close above 1670.
Disclaimer: This is not a buy/sell recommendation. For educational purpose only. Kindly consult your financial advisor before entering a trade.

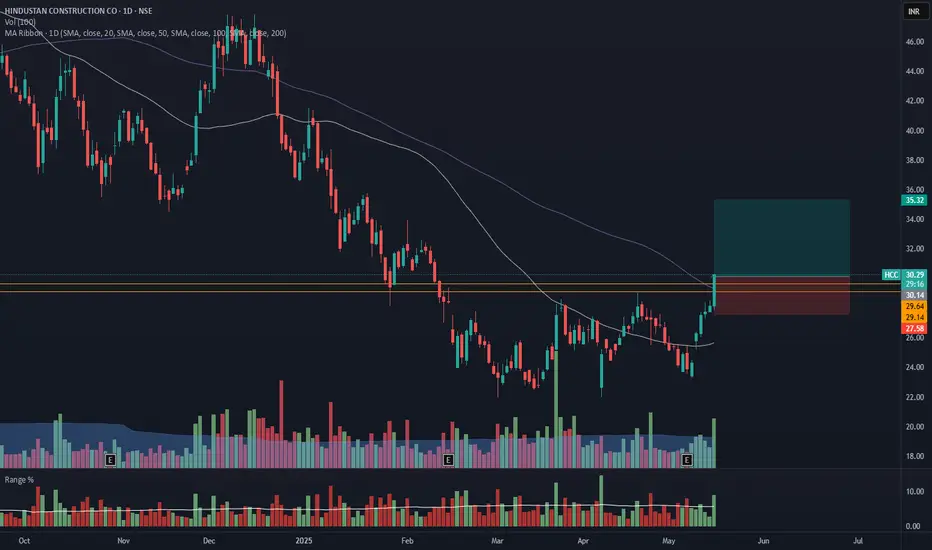
HCC - Breakout from DTFHCC has resistance weakening on the Daily charts and has given a breakout with good volume.
The target of this pattern signals an upside potential of 17% from the current price level in the medium term.
The stock is trading above its 50- and 100-day exponential moving averages (EMAs). The range is more than 1.5X, and the Volume is also 1.5X the average.
CMP- Rs. 30
Target Price- Rs35 ( 17% upside)
SL - 27.5
Disclaimer: This is not a buy/sell recommendation. For educational purpose only. Kindly consult your financial advisor before entering a trade.
ADANIGREENADANIGREEN has given resistance breakout with decent volume. Resistance on upper side is around 1250 and support is nr 980-90. Today traction in ADANI group has been observed and this may push fresh momentum in upcoming days. Keep it on radar

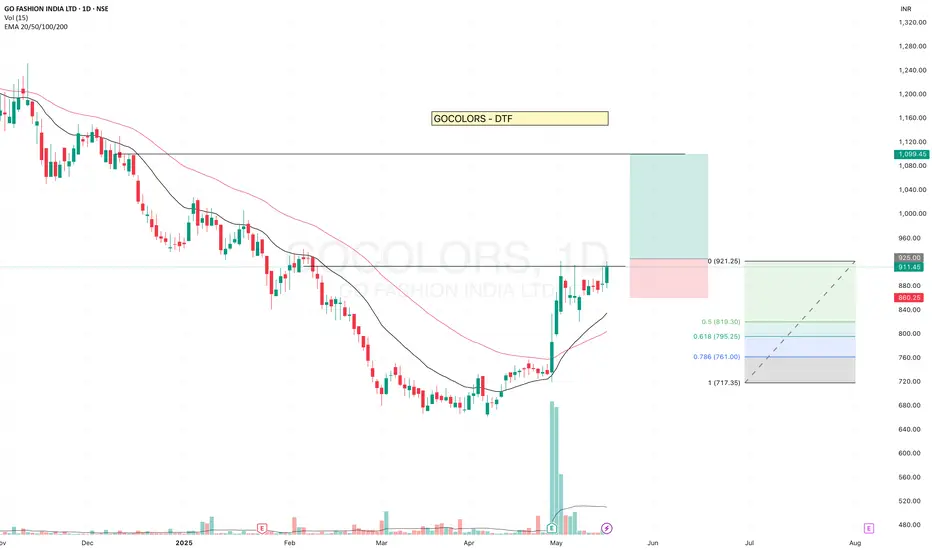
GOCOLORS - Getting ReadyGOCOLORS is getting ready and has been testing the resistance level.
- It is consistently trading above the 20 EMA. Recent high-volume candles suggest clear institutional participation. Although volume is currently drying up, the price is sustaining — a positive sign.
- The stock reversed after touching the 0.5 Fibonacci retracement level, indicating strength.
✅ If you like my analysis, please follow me as a token of appreciation :)
in.tradingview.com/u/SatpalS/
📌 For learning and educational purposes only, not a recommendation. Please consult your financial advisor before investing.