USOIL rising wedge pattern formation at 4 hour TF Market story - USOIL formed rising wedge pattern at 4 hour TF and expecting to reach S3 zone in following days
Rising Wedge

NIFTY 1HThe range in which NIFTY is trading is shrinking. It has started forming a pattern which is The Rising Wedge Pattern. It is mostly observed that this pattern generally has a breakdown instead of a breakout but that depends on the market is never 100% guaranteed. But as it is said in stock market "History repeats itself" so we can believe to notice a break down in NIFTY. The RSI is also nearing 70 in 1HR timeframe. You can backtest the reaction of NIFTY when it reaches RSI of 70+. So we can expect a correction in NIFTY in the coming few trading sessions. No one can say how much NIFTY will correct, but it will definitely show a reversal pattern once it's done being bearish. So hold your cash and wait for NIFTY to correct. You can catch stocks at better prices & incur good profits. Happy Trading & Investing!


NZDUSD Short Idea AnalysisHey y'all as we can see a Bearish Rising Wedge has formed and now we can expect for a long bearish move.
Let's see...
Follow me for any update on this idea and other ideas to.

Nifty50 Nifty follow RWP since 2018 now it was on it RT higher chances to retest the below 12000 levels before go up.

XAUUSD - sell down 4h chartXAUUSD : xauusd is currently going to sell down for beyond the technical analysis XAUUSD sell down
REASONS :
1. Trend reversed into the down trend
2. Continuation Pattern : rising wedge formed..
3. xauusd is corrective wave also completed to going down.........


Havells India Ltd Technical Analysis .Hello friends , Today i have the technical chart Of Havells India Ltd . Friends as you can see here that it was in a up trend but now it can go down because it is making a " Rising wedge " and Also Making Bullish Harami Candle Stick Pattern Which shows that i could be right at here . But remember that it can break upper trend line from where i have shown down because it will be a False Breakout and if you buy at there the trade can be in profit for 5 - 6 day After than it can be in loss because it can go down from there and also remember it will go first and then up from the Resistance it can go down as shown in the picture ,Thus it is also near the breakout point .Its Support price you can see that it is on its support and its target you can take for is at Rs 680 and if it goes down how i have shown so the stoploss you can take is at Rs 442.90 and remember to read out the notes and other things written on the chart and i have showed the nearby support you should also see the marked Supports and Resistances on the chart and Please give your Precious time and like all my ideas so that i can know that you like my ideas which i publish and my channel
To like my all ideas just click on my channel name you can see it with picture and then like my ideas .
Thank You . If you like this Idea and this Analysis just please like this idea and leave a comment i will surely try to improve it or if you have any doubt related to this you can write in the comment box also . Bye Bye .

HAVELLS- Rising wedgeStock seems to be taking support at 50ema in daily timeframe.
Close below 50ema (daily timeframe) can be used as SL.

AUDCHF in Rising Wedge.AUDCHF has been spotted in rising wedge which is a bearish pattern with bias to break to the downside.
Entry is around 0.65650 and take profit at 0.65350, roughly around 30 pips profit.
Good luck!
Tibor

Bank Nifty Broken Rising Wedge | Still Bearish On A Daily TIme frame , BankNifty has broken Rising Wedge pattern
When Price Action is considered, Dynamic Resistance still needs to be broken at 21023 if we consider bull to come back but not before 21356.
Multiple touch of upper trendline that makes dynamic resistance .
Upper trend line was respected for almost 5 months.
Looking further you will observe that lower trend line was broken with high volume as wedge becomes more and more contracted.
what more to come ?
No Bull Above 21356
If we consider current scenario 18644 is still expected , untill we see gap
What happens below 18644 for BANKNIFTY ?
Well more panic but that is still far away
What do you think ?
Also chart is also seeing some major elliot waves , keep an eye on those also

The Rising Wedge BreakdownA rising wedge is a technical indicator, suggesting a reversal pattern frequently seen in bear markets.

BANKNIFTY TRADE PLAN: 07 OCT 20Followup trade
Levels mentioned on the chart
Ex: Rising Wedge
Awaiting breakdown of lower channel
Be Proactive Trader
Better Insight, Better Trade Execution
Views are for ‘’EDUCATIONAL PURPOSE ONLY’’ trade at your own risk.
"Always Respect Risk"
Happy Trading
Jai Hind
Dhiraj Singh Bais
Warrior at Battle field

rising wedge on daily time frameformation of rising wedge pattern: Bearish
Also marked ABC Wave. : prob. completion of wave
There might be some sideway move for some weeks.
Only below 11000, we will see targets for 10000,
11000 might give some support.
Fundamental Data to support this rising wedge.
GDP Data: Bearish
Border Tension: Bearish
Pandemic: Bearish

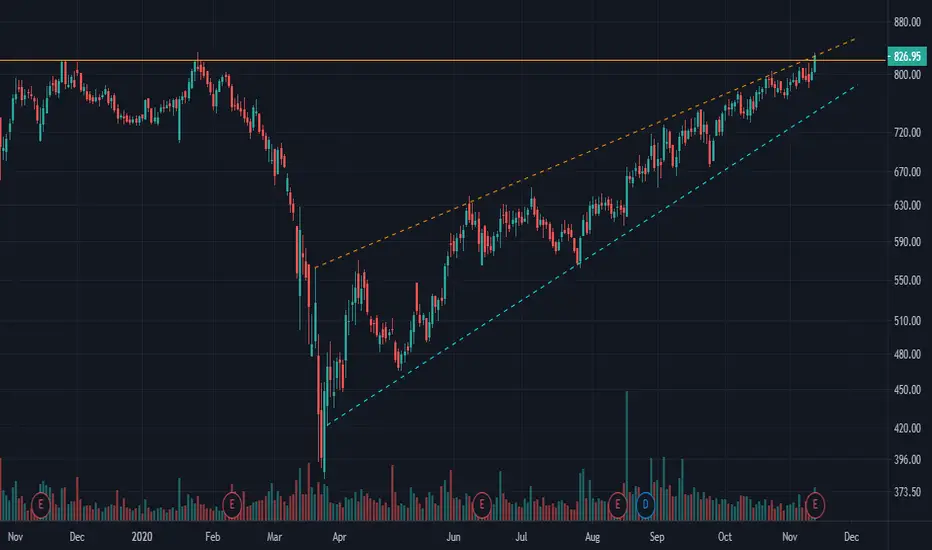
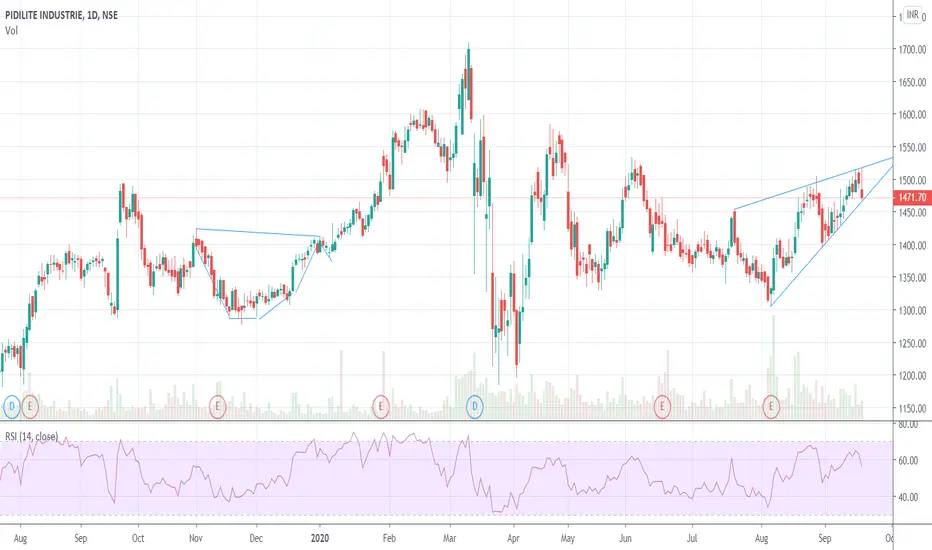
PIDILITE - RISING WEDGE PATTERN Greetings ! Price movement has gradually formed a rising wedge pattern. This is a bearish pattern on breakout.
Amber Enterprises ----- Huge Volume 5.708 M +stock can move either way
be cautious
follow the technical rules before entry

CADJPY weekly analysis , Sep 8-11CADJPY pairs formed a Rising wedge pattern, before hits down it may go up at the resistance area of 81.800 , and all the way down ..


axis bank rising wedhe pattren brekout possibleaxis bank breakout possibility. level are given in the chart follow for more trade step

SBIN RISING WEDGEA rising wedge is forming in SBIN from the last two months. Clear rejection can be seen at the upper and lower trendlines
Chaikin money flow also supports the idea
Once the stock breaks below the lower trendline, short the stock
Target - 171
Stop loss - 215

