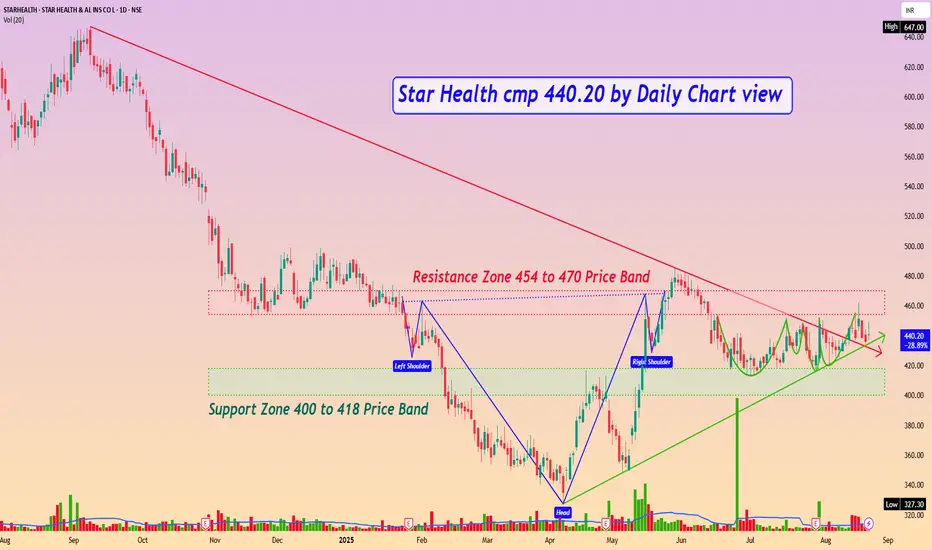
Star Health cmp 440.20 by Daily Chart viewStar Health cmp 440.20 by Daily Chart view
- Support Zone 400 to 418 Price Band
- Resistance Zone 454 to 470 Price Band
- *Price repeatedly rejected down from the Resistance Zone*
- Falling Resistance Trendline Breakout seems to be sustained
- *Volumes falling by selling pressure from the Resistance Zone*
- Rising Support Trendline yet well respected by up-trending price
- *Stock Price traversing within the Darvas Box between Support and Resistance*
- Bullishness indicated by Technical patterns Head & Shoulders and Rounding Bottoms
- *Price Breakout post crossing and sustaining for few days over Resistance Zone neckline hurdle*
Roundingbottom
ABCAPITAL(cup& handle)My analysis is large capital company with good returns.
Key piont is Make cup and handle pattern look into chart how was possible to Target reach . Road map create for our target is 230, 300 but .. respect to SL .. LIKE ME .
Company has delivered good profit growth of 47.2% CAGR over last 5 years
Shareholding pattern (%)
As On Dec-23
Promoter 69.0 %
DII 8.4%
FII 10.6 %
Others 12.0 %
for MORE check in my TradingView ID
If You LIKE👌👌 MY Idea ......Boost.🔥🔥🔥.. its.
"Disclosure : I am not Sebi-registered." This channel is for only educational purpose. Any profit/loss, I am not responsible.
Before taking any trade on our charts / calls, please consult your financial advisors. Thanks🙏

Zydus Lifesciences cmp 989.45 by Daily Chart viewZydus Lifesciences cmp 989.45 by Daily Chart view
- Support Zone 946 to 966 Price Band
- Resistance Zone 996 to 1016 Price Band
- Falling Resistance Trendline and Zone Breakout attempted
- Volumes seem in decent sync with the average traded quantity
- Multiple Bullish Rounding Bottoms with Cup & Handle by Resistance Zone neckline
- Resistance Zone acting as a strong hurdle to crossover and breakout basis past reversals

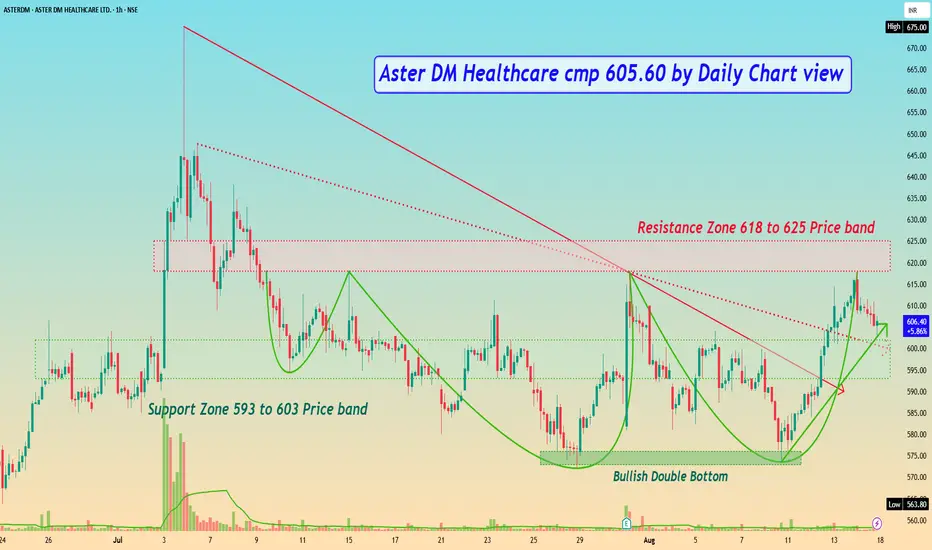
Aster DM Healthcare cmp 605.60 by Daily Chart viewAster DM Healthcare cmp 605.60 by Daily Chart view
- Support Zone 593 to 603 Price band
- Resistance Zone 618 to 625 Price band
- Stock price to test retest Support Zone for fresh upside
- Falling Resistance Trendlines Breakout is done and sustained
- Bullish Double Bottom formed around the 573 to 576 price level
- Bullish Rounding Bottoms formed but failed Breakout at Resistance Zone neckline
- Heavy Volumes needed above avg traded quantity for successful breakout over Resistance Zone
N R Agarwal Inds cmp 388.35 by Daily Chart viewN R Agarwal Inds cmp 388.35 by Daily Chart view
- Support Zone 345 to 365 Price Band
- Resistance Zone 390 to 410 Price Band
- Price momentum sustaining the Rising Support Trendline
- Both Falling Resistance Trendlines Breakout seems well maintained
- Heavy surge seen in Volumes today by demand based buying for results
- Resistance Zone acting as good hurdle to cross since Sept 2024 breakdown
- Bullish Rounding Bottom, Cup & Handle formed with in completion stage Head & Shoulders

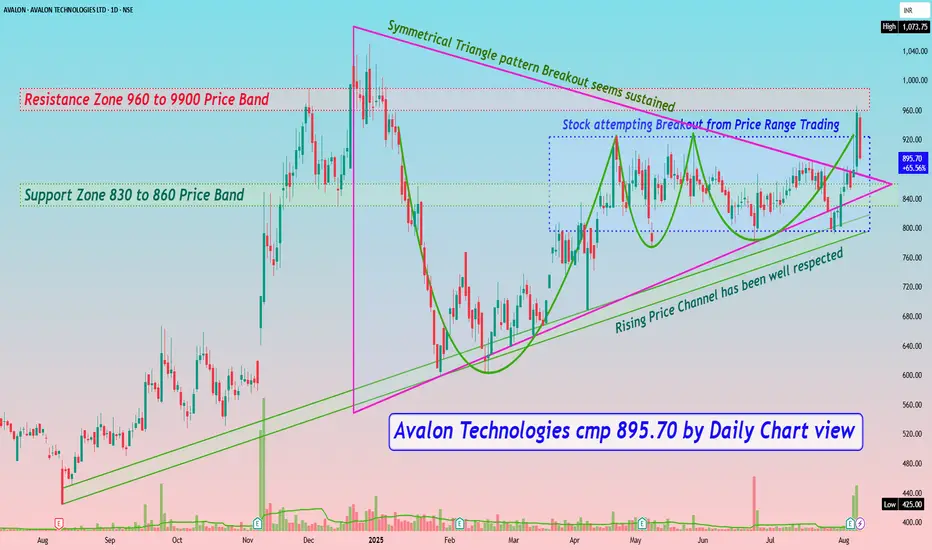
Avalon Technologies cmp 895.70 by Daily Chart viewAvalon Technologies cmp 895.70 by Daily Chart view
- Support Zone 830 to 860 Price Band
- Resistance Zone 960 to 9900 Price Band
- Rising Price Channel has been well respected
- Stock attempting Breakout from Price Range Trading
- Symmetrical Triangle pattern Breakout seems sustained
- Repeated Bullish Rounding Bottoms under Resistance Zone neckline
- Volumes spiked heavily at end of week and above average traded quantity
- Positively trending Technical Indicators BB, EMA, MACD, RSI,SAR, SuperTrend
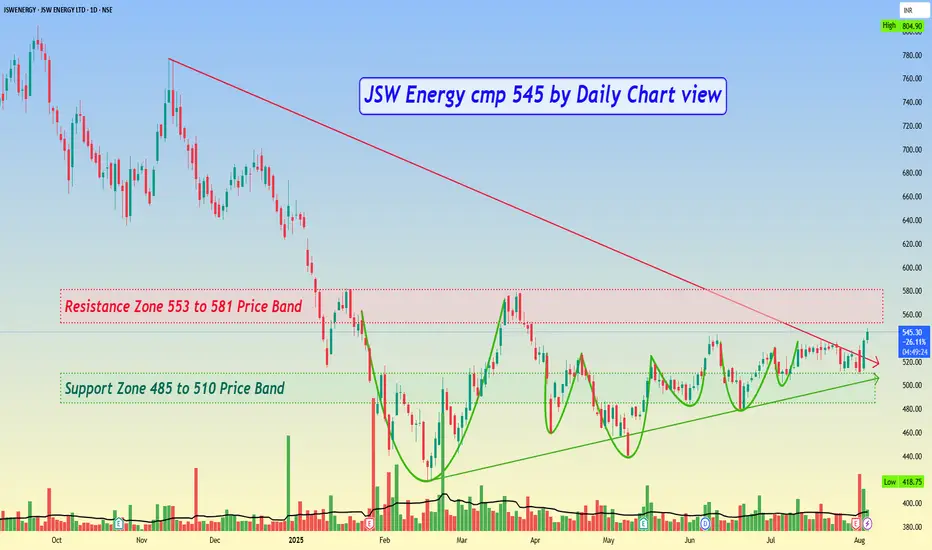
JSW Energy cmp 545 by Daily Chart viewJSW Energy cmp 545 by Daily Chart view
- Support Zone 485 to 510 Price Band
- Resistance Zone 553 to 581 Price Band
- Falling Resistance Trendline Breakout has well sustained
- Rising Support Trendline well respected by upwards Price Momentum
- Multiple Bullish Rounding Bottoms plus considerate VCP pattern too, as viewed individually
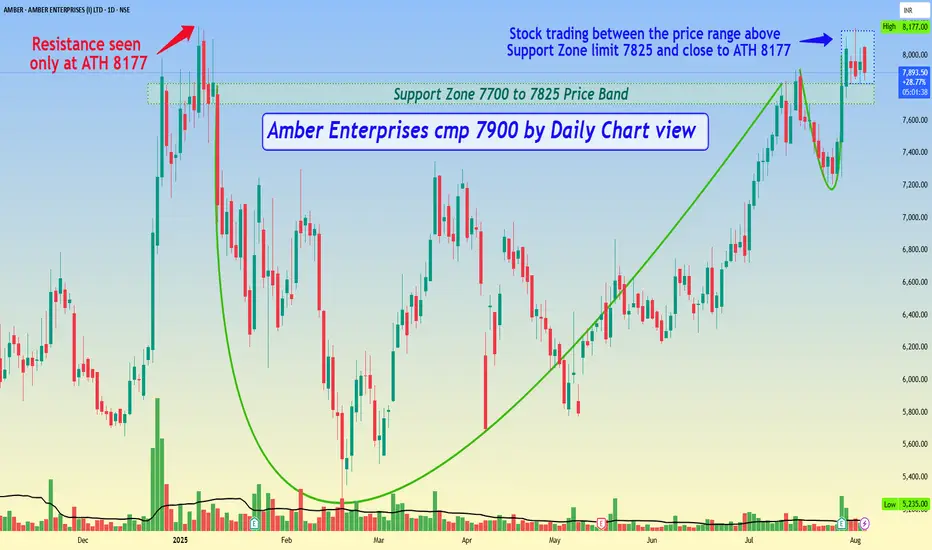
Amber Enterprises cmp 7900 by Daily Chart viewAmber Enterprises cmp 7900 by Daily Chart view
- Support Zone 7700 to 7825 Price Band
- Resistance seen only at the ATH 8177 level
- Volumes syncing closely and at times well above average traded quantity over past few days
- Stock is trading between the price range from above Support Zone limit 7825 and close to ATH 8177
- Bullish Rounding is made over close to 7 mths timeframe, indicative of huge upside breakout probability
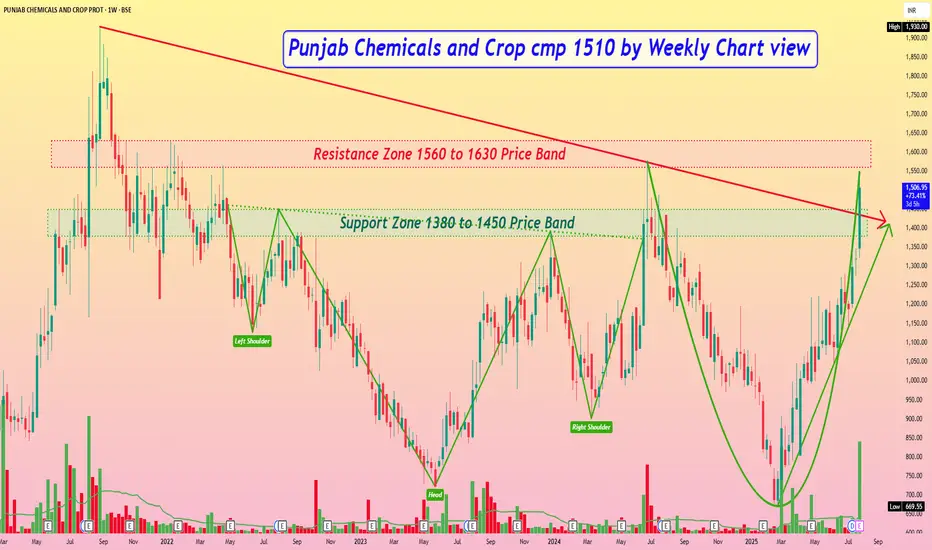
Punjab Chemicals and Crop cmp 1510 by Weekly Chart viewPunjab Chemicals and Crop cmp 1510 by Weekly Chart view
- Support Zone 1380 to 1450 Price Band
- Resistance Zone 1560 to 1630 Price Band
- Volumes spiked heavily today by demand based buying
- Bullish Head & Shoulders followed by Bullish Rounding Bottom patterns
- Resistance Zone neckline hurdle crossing needed for fresh upside breakout momentum
- Falling Resistance Trendline Broken and Rising Support Trendline sustained indicates good bullishness
CARTRADE TECH LTD - The Second Race.As linked below, the previous analysis of this stock achieved all the targets in 4 months. It also with stood the sell off in the markets and reclaimed its trajectory at the first sign of market reversal. These are traits of strong stocks. Technically in Stage 2, this stock could see even higher targets but lets set targets step by step. Timely profit booking is also an art. Today it kissed the previous ATH of 2021. Above that a fresh new trend begins.
Talking about fundamentals:
- Company has a low Debt to Equity ratio
- Healthy long term growth as Net Sales has grown by an annual rate of 25.90% and Operating profit at 46.24%
- With a growth in Net Profit of 48.16%, the company declared Very Positive results in Dec 24
- Infact the company has declared positive results for the last 11 consecutive quarters
- OPERATING PROFIT TO INTEREST(Q) Highest at 17.21 times
- PAT(Q) Highest at Rs 42.69 cr.
- Over the past year, while the stock has generated a return of 109.11%, its profits have risen by 39.4%.
- High Institutional Holdings at 74.79%. These investors have better capability and resources to analyze fundamentals of companies than most retail investors. Their stake has increased by 1.15% over the previous quarter.

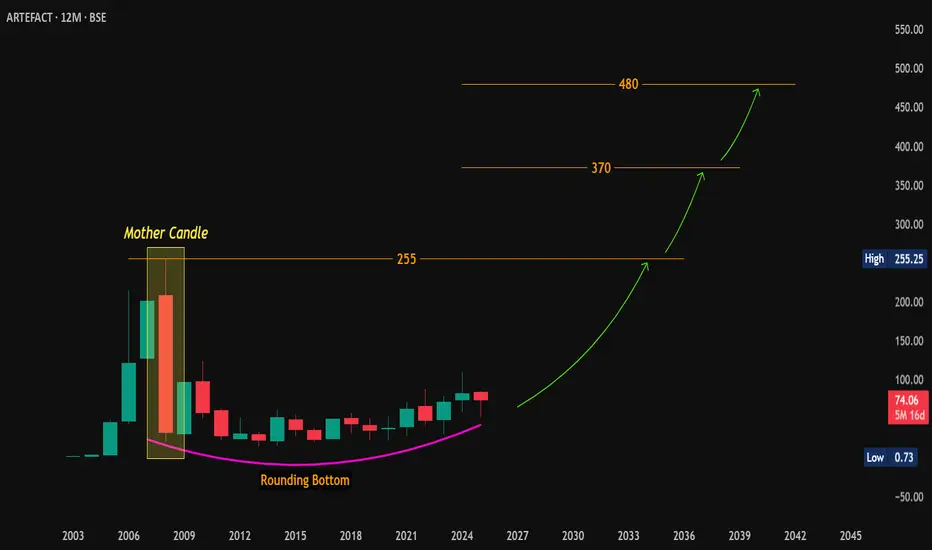
#Artefact – 17Y Pattern in Play | Big Base Forming?🔎 #OnRadar
📌 #Artefact (Artefact Projects Ltd.)
CMP: 74.06
📈 Technical Outlook (Yearly Chart):
Stock has been consolidating within a large #MotherBar formed in 2008, with a range of 255.25 – 21.05.
Currently displaying a classic #RoundingBottom formation on the yearly timeframe — a long-term bullish pattern indicating accumulation.
🎯 Potential Upside Levels (Post Breakout):
Rounding Bottom Target: 255 (approx.)
MotherBar Breakout Targets (on closing basis above ₹255.25): 370 / 480+
📌 Note:
This is a technical observation and not a recommendation. Please consult your financial advisor before making any investment decisions.
#LongTerm | #TechnicalPatterns | #MotherBar | #RoundingBottom | #ChartAnalysis
Paracables- Cables setup for climbing higher.1. Price is currently high above the multiyear strong support and ascending parallel channel
2. Fib 0.618 retracement done in monthly which is exactly matching with the support line of 44.95
3. After the RB breakout, it formed a flag pattern in monthly and yet to breakout.
4. Once breakout done, first target will be 90.51 and second target will be 220
5. Note: This setup is for long term only. So patience needed to achieve the desired results.
Note: This is for educational purpose only and not a stock recommendation.

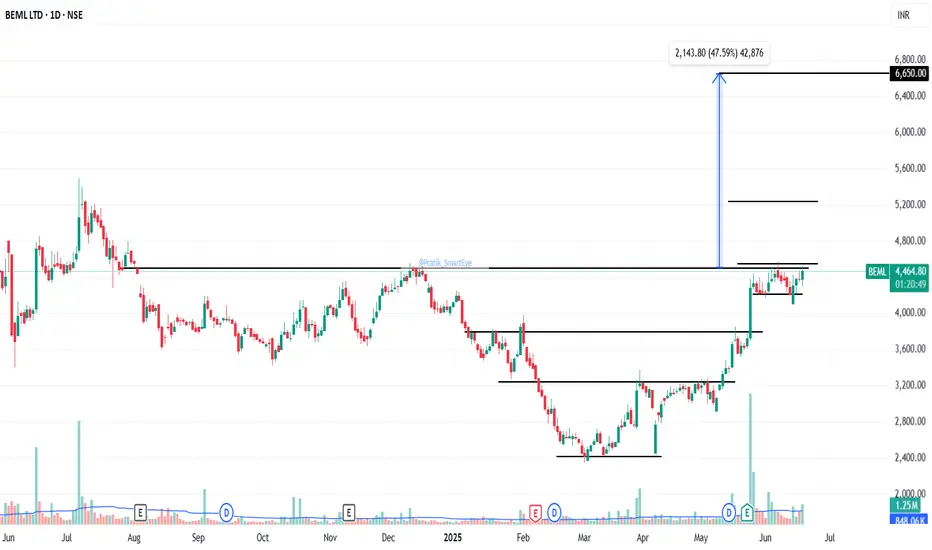
BEML: at Rounding Bottom Breakout.BEML: at Rounding Bottom Breakout. CMP 4473.
Sustained close above 4550 needed.
Resistance 5232/6650.
Godrej Properties Ltd : Dual Rounding Bottoms Pattern1. Overview
Godrej Properties Ltd. has exhibited a significant dual rounding bottom price pattern, indicating strong bullish reversals over extended periods. The first rounding bottom, spanning December 2021 to December 2023, was successfully completed, and its target was achieved according to the classical measurement rule.
Currently, the stock is forming a second rounding bottom between December 2024 and June 2025, signaling a potential new upward trend once confirmed. The RSI (Relative Strength Index) indicator also reflects this pattern by forming corresponding rounding bottoms, confirming positive momentum building at the indicator level.
2. Rounding Bottom Pattern: The rounding bottom is a long-term reversal pattern characterized by a smooth “U”-shaped price action that typically unfolds in three distinct phases:
Phase 1: Falling Prices with Rising Volume : Strong downtrend accompanied by rising volume reflects intensified selling pressure.
Phase 2: Falling Prices with Declining Volume: Price continues to drop but with diminishing volume, indicating that sellers are losing conviction.
Phase 3: Signs of Bullishness with Rising Volume: The emergence of bullish candles with rising volume signals growing demand and buyer interest.
3. Accumulation and Its Importance
Accumulation occurs during the rounding bottom's base formation, characterized by:
Three or more bottoms forming at nearly the same price level.
Volume contracting during price declines and expanding on minor upswings.
This pattern of price and volume confirms strong accumulation by informed investors, setting a foundation for the impending breakout.
The accumulation phase is crucial, as it represents the shift from seller dominance to buyer control, often preceding a significant price rally.
4. First Rounding Bottom (Dec 2021 – Dec 2023): Recap
The first rounding bottom completed a textbook formation over two years.
Following breakout above the neckline, the target price was met as per the classical measurement rule (distance from bottom to neckline projected upward).
Breakout was confirmed by a strong candle close above the neckline with rising volume, validating the reversal.
5. Current Second Rounding Bottom (Dec 2024 – June 2025)
Price action currently mirrors the classical three-phase rounding bottom structure:
Initial price drop with rising volume (Phase 1).
Subsequent price decline with decreasing volume (Phase 2).
Emerging bullish candles with increasing volume (Phase 3).
The key resistance level to watch is the neckline at ₹2500.
A sustained breakout above ₹2500 with a positive candle close and rising volume will confirm the pattern’s completion and trigger a strong bullish move.
6. RSI Confirmation
The RSI indicator is also forming a rounding bottom pattern synchronized with the price action. This alignment strengthens the validity of the pattern by confirming that momentum is gradually shifting from bearish to bullish territory. The RSI rounding bottom indicates that selling pressure is fading. Increasing RSI levels with rising volume provide a strong signal of increasing demand and improving momentum.
7. Conclusion & Trading Outlook
Godrej Properties shows a strong dual rounding bottom formation, with the first pattern successfully completed and the second underway:
The current phase suggests growing accumulation and increasing demand.
Confirmation awaits a breakout above ₹2500, validated by strong volume and bullish candle close.
The RSI rounding bottom adds conviction to this bullish setup.
Traders and investors should monitor volume and price action around the ₹2500 neckline for a confirmed breakout, which is likely to provide an attractive buying opportunity.
8. Risk Considerations
False breakouts or weak volume could invalidate the bullish outlook.
Broader market and sector-specific risks remain relevant.
Employ prudent risk management strategies with appropriate stop-loss placement.
Disclaimer: This report is intended for educational purposes and should not be considered financial advice. Please perform your own analysis or consult a professional before making investment decisions.

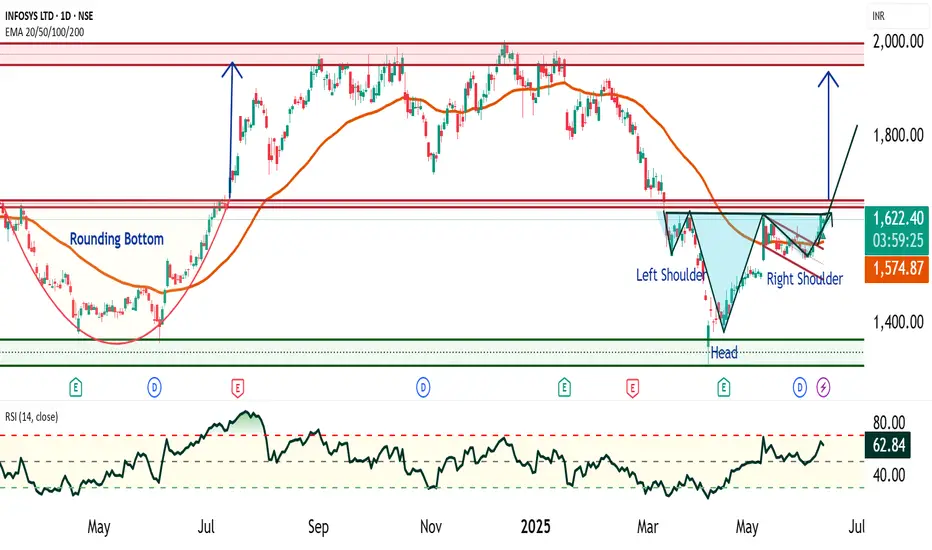
Infosys - Bullish Flag and Head & Shoulder Patterns🔍 1. Infosys Current Price Range and Key Levels
Since January 2021, Infosys has been trading in a broad range between ₹1300 and ₹2000, consolidating for over 4 years. Within this range, there are three key support and resistance levels to watch closely:
Support: ₹1300 (major floor)
Intermediate Resistance/Support Zone: ₹1600 – ₹1650
Strong Resistance: ₹2000 (upper bound)
📈 2. Bullish Flag Pattern: A Bullish Flag is a continuation pattern that forms after a strong upward price move "flagpole", followed by a period of consolidation in a narrow downward or sideways channel "flag". It typically signals a pause before the uptrend resumes.
Infosys recently broke out of a bullish flag pattern and crossed above ₹1580 with a strong closing on higher volume, indicating renewed buying interest.
Price is currently trading above the 50-day Exponential Moving Average (EMA), confirming the continuation of the mid-term uptrend.
However, the zone around ₹1650 remains a strong and key resistance level to monitor closely.
🧩 3. Potential Bullish Head and Shoulders Pattern Above ₹1650
Should Infosys break decisively above ₹1650, it is likely to form another significant bullish pattern known as the Bullish Head and Shoulders.
This pattern signals a trend reversal from bearish to bullish and is considered highly reliable.
Trend: Appears after a downtrend or consolidation, signaling reversal
Touchpoints: Three lows – left shoulder, head (lowest point), and right shoulder, roughly at similar levels
Neckline: The resistance line connecting the highs between shoulders and head
Timeframe: Medium-term, often forming over weeks up to 6 months
Volume: Typically higher volume on left shoulder and head formation, volume dips on right shoulder, and surges on breakout
⚠️ 4. Key Concerns in Infosys Chart Pattern
Price-Volume Divergence: During the head formation, volume increased sharply as price fell — indicating strong selling pressure. However, volume was low when price approached the neckline — suggesting weak buying interest to confirm breakout. This divergence signals potential caution.
Resistance Zone: Price remains below the key resistance at ₹1650, which has acted as a ceiling multiple times. A decisive breakout is required to sustain further upside momentum.
⚠️ Disclaimer
This report is intended solely for educational and training purposes and does not constitute investment advice. Traders and investors should conduct their own research and consult financial advisors before making trading decisions.
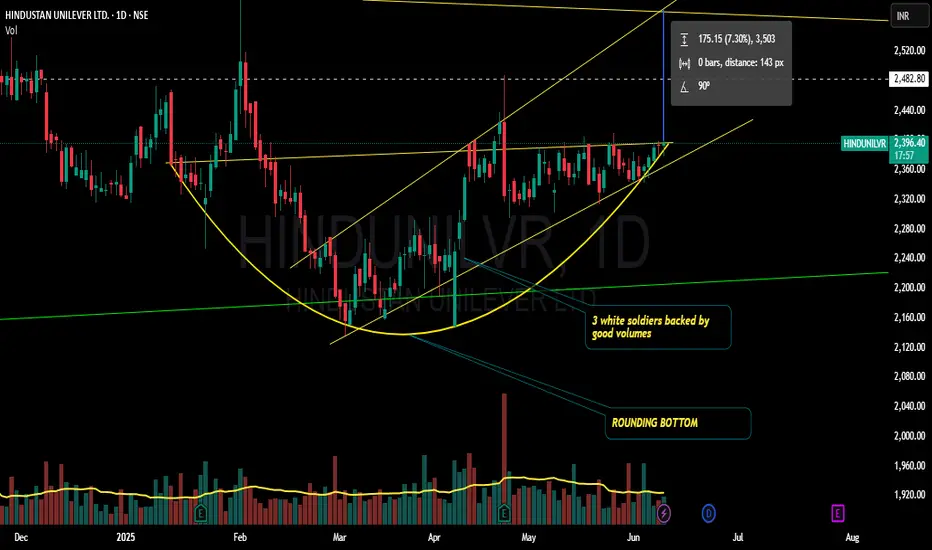
Hindunilvr longing for a breakout??!!Chart patterns inflict me the above titled opinion
Breakout can be expected as it has not breached the low made on 25th april 2025 and has been consistently making higher highs and higher lows(seen clearly on hourly charts)
Entry after the breakout.. ...
Godrejcp also seen for a up move!!!!
will update once it breaks out!!!!
Thank you.
This is just my opinion...not a advice!!!!
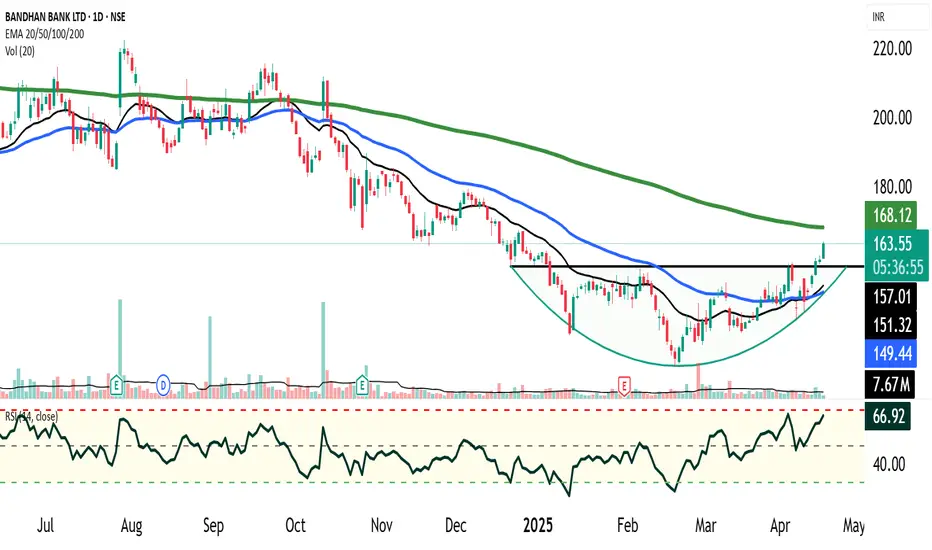
Bandhan Bank - Rounding Bottom Chart PatternBandhan Bank has recently formed a classic rounding bottom pattern after an extended long-term downtrend, indicating a potential shift in momentum from bearish to bullish. This basing structure suggests accumulation at lower levels and a possible trend reversal setup.
Pattern Activation: The rounding bottom pattern has triggered a breakout above the neckline resistance of ₹157, accompanied by a volume spike, confirming initial buyer interest and pattern validity.
Lack of Follow-Through Volume: Post-breakout, follow-through buying volume is missing, which raises caution. This could imply either a pause before further upside or an imminent retest of the breakout level around ₹157.
EMA Crossovers:
Bullish Crossover observed as the 20 EMA has crossed above the 50 EMA, suggesting improving short-to-medium term momentum.
However, price remains below the 200 EMA, signaling that the primary trend remains bearish. Sustained trading above the 200 EMA would be needed for confirmation of a longer-term trend reversal.
Risk Management & Strategy:
Cautious Optimism: While the breakout is promising, the stock remains under the long-term moving average and may face selling pressure at higher levels.
Retest Strategy: A pullback to ₹157 (neckline) could offer a low-risk entry point, especially if supported by bullish candlestick confirmation and renewed volume.
Staggered Investment Approach:
Do not park all your money in one go. : It is advised to invest in tranches, monitoring price action closely, especially near the 157–160 zone and at the 200 EMA level.
Conclusion:
Bandhan Bank is showing early signs of a technical base formation and potential trend reversal, but confirmation is pending due to lack of sustained volume and price being below the 200 EMA. The stock warrants close monitoring for a successful retest and possible breakout continuation. Investors should remain cautious, disciplined, and adopt a phased allocation strategy.
PEL : Swing Pick#PEL #trendingstock #breakoutstock #Momentumstock
PEL : Swing Trade
>> Trending setup
>> Breakout candidate
>> Stock in Momentum
>> Rounding bottom in formation
>> Low Risk High Reward Trade
Swing Traders can lock profit at 10% and keep trailing
Disc : Charts shared are for Learning purpose and not a Trade recommendation
Consult a SEBI Registered Advisor before taking position in it.
The Above Stock analysis is done purely on the technical basis only & Technical analysis is also 100% full proof. so i reserve the right to be wrong, if thats d case it will be learning experience.
PLong

Technical Analysis Report: SMS Pharmaceuticals Ltd1. Bullish Flag with Pole (June–July 2024)
Bullish Flag with Pole: A continuation pattern formed after a strong upward price move (the pole), followed by a short-term consolidation (the flag), signaling the potential for another breakout upward.
Price Action: Strong impulsive rally formed the flagpole, followed by a tight consolidation forming the flag 🚩.
Breakout: Confirmed with a high-volume breakout to the upside.
Target: Achieved a massive 40% gain in under a month.
Analysis: A textbook bullish continuation pattern; traders capitalized on early entry post-breakout.
2. Distribution Phase (August–October 2024)
Distribution Phase: A sideways trading range after an uptrend where smart money or institutions start offloading their holdings. Typically a precursor to a market reversal or downtrend.
Market Structure: After the sharp uptrend, price entered into a horizontal range.
Phase Characteristics: Low volatility, repeated rejections at resistance, high volume on down days—signs of distribution.
Interpretation: Institutions likely booking profits, signaling a potential trend reversal.
Trader Sentiment: Shifted from bullish to neutral/bearish.
3. Triple Top Formation (Within Distribution Phase)
Triple Top Pattern: A bearish reversal pattern marked by three failed attempts to break above a resistance level, indicating weakening momentum and a potential downtrend.
Resistance Level: Same peak tested three times without breaking.
Breakdown: Confirmed after the third top with a decisive drop.
Target: Achieved a "30% downside" move via "short selling", all within a month.
Insight: Classic reversal pattern, effectively timed with distribution.
4. Bearish Flag with Pole (During Triple Top Breakdown)
Bearish Flag with Pole: A continuation pattern during a downtrend. It starts with a sharp decline (pole), followed by a minor upward consolidation (flag), suggesting further downside.
Formation: Sharp decline (pole) followed by a brief upward consolidation (flag).
Breakdown: Continuation to the downside, achieving projected target.
Target: Fully achieved within the same downtrend cycle.
Conclusion: Reinforced the bearish sentiment and amplified the down move.
---
5. Accumulation Phase + Triple Bottom (December 2024–April 2025)
Accumulation Phase: A market phase where a stock trades in a range after a downtrend, as buyers (often smart money) gradually build positions, typically leading to a bullish reversal.
A Triple Bottom is a bullish reversal chart pattern that forms after a downtrend, marked by three equal lows indicating strong support and a potential trend reversal to the upside.
Phase: 5-month Accumulation Phase
Pattern: Triple Bottom during this period indicated strong support and buyer presence.
Breakout: Occurred with a bullish breakout post third bottom.
Target: 20% upside achieved within a month post-breakout.
Observation: Long-term investors and smart money potentially entering positions.
6. Rounding Bottom in Progress (May 2025)
Pattern: Rounding Bottom (Still Forming)
Current Price Action: Gradual curve formation with decreasing volume on the left and increasing volume near the neckline— a bullish sign.
Expectation: Anticipated upside breakout in the coming days.
Outlook: If confirmed, this could mark the start of a new bullish cycle.
📌 Summary:
SMS Pharmaceuticals Ltd. has shown a textbook series of technical patterns—from trend continuations to reversals, distribution to accumulation, and now a potential new uptrend. Each phase was actionable, with clear breakout/breakdown points and well-achieved targets.

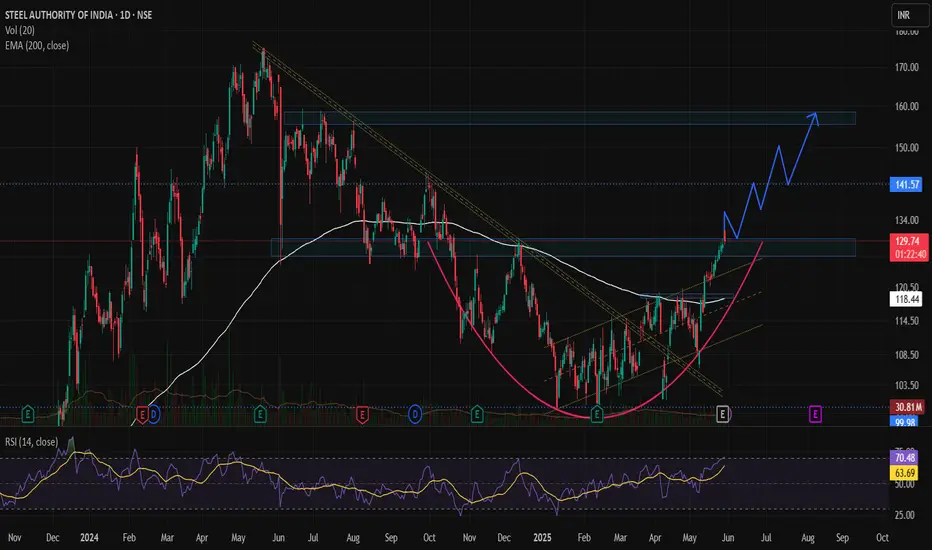
SAIL – Trend Reversal & Trade SetupA trend reversal appears to be taking shape in SAIL, indicating a potential shift from a downtrend to an uptrend. The stock has recently came out of a falling trendline and has closed above its 200-day EMA, placed at ₹117, signaling renewed strength and buyer interest.
🔄 Technical Outlook
- Breakout Zone: SAIL gave a technical breakout at ₹117, which aligns with its 200 EMA (Day), a widely tracked long-term moving average.
- Current Price Action: The stock is now trading at around ₹130, emerging from a rounding bottom pattern, which is a bullish continuation pattern indicating accumulation and base formation.
- Volume Analysis: Recent trading sessions have shown notable volume spikes, supporting the bullish breakout and trend reversal narrative.
- Fundamental Trigger: Q4 Results have been decent, providing a fundamental cushion to the technical setup. While not overly bullish, the results are good enough to support the ongoing trend reversal, especially if broader market sentiment remains stable.
📊 Support & Resistance Levels
- Crucial Support Zone: ₹127–₹130 — holding this zone is key for sustaining the bullish move.
- Key Breakout Zone: ₹127–₹130 — staying above this range will confirm the breakout and strengthen the upward move.
- Stop Loss: A protective stop-loss at ₹115, which lies just below the 200-day EMA, is advisable to manage downside risk.
🎯 Target Levels
First Target: ₹140
Second Target: ₹150
Final Target: ₹158
Time Frame: Expected to take 2–2.5 months to achieve the projected targets if momentum continues.
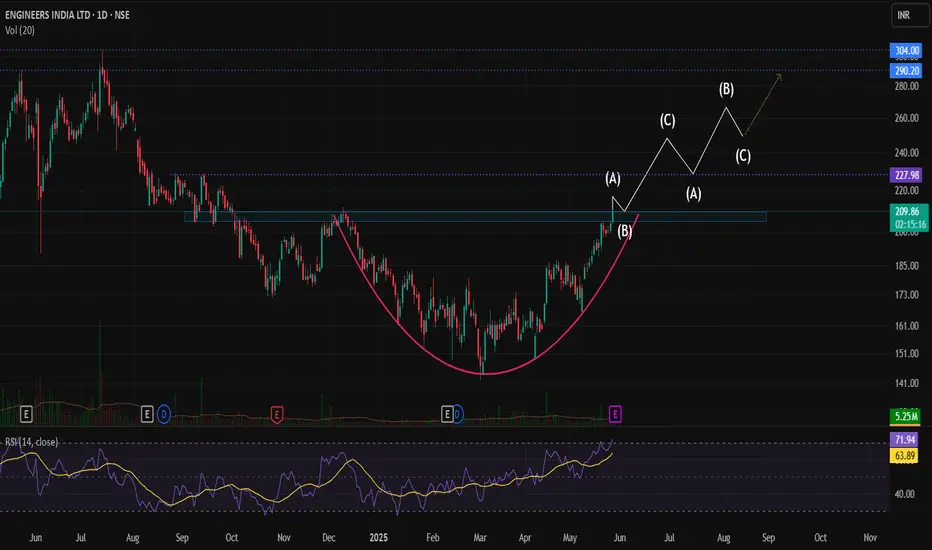
Engineers India – Technical Analysis & Trade SetupEngineers India Ltd has recently formed a rounding bottom pattern on the chart, a classic bullish reversal pattern that suggests a shift in momentum from bearish to bullish. The key resistance level lies at ₹210-212 price zone, and a breakout above this level with strong volume will confirm the pattern.
📈 Breakout Confirmation & Retest Zone :
A decisive close above ₹212 will mark a technical breakout, putting the stock at its 8-month high. Post-breakout, a retest of the ₹205–₹210 zone is likely. If the stock takes support and consolidates in this zone, it will indicate strength and readiness for the next upward leg.
📅 Fundamental Trigger – Q4 Results :
Investors and traders should closely monitor the Q4 results scheduled for 29 May. A strong earnings report could serve as a catalyst to support the technical breakout and sustain the uptrend. Conversely, a weak result may delay or invalidate the breakout momentum.
🎯 Targets & Price Action Outlook:
- Short-term buying range: Between ₹210 and ₹215.
- Immediate target: ₹250
- Next targets: ₹290 and eventually ₹300, which may take 3–4 months to achieve if the trend sustains.
- Stop loss can be placed at ₹185.
⚠️ Key Points to Watch:
- Volume confirmation on breakout above ₹212.
- Retest and support around ₹205–₹210.
- Q4 earnings impact on price action.
- Keep a disciplined stop-loss strategy based on risk appetite.
BHEL- Rounding Bottom BreakoutBHEL has given Rounding bottom Breakout on the daily charts. This pattern is very powerful and now this stock can provide a return of 28% in medium to long term.
On the Daily Chart, the stock is trading above its 11 and 22 day EMA, RSI is at 74 and MACD is above zero line suggesting positive momentum.
Volume- The volume has increased towards the breakout which suggests the possible upmove.
CMP- Rs.262
Short Term Target-292 ( Marked with Red dashed line)
Medium Term Price Target - Rs342 (28% upside)
SL- 245( Below the neckline)
Disclaimer: This is not a buy/sell recommendation. For educational purpose only. Kindly consult your financial advisor before entering a trade.

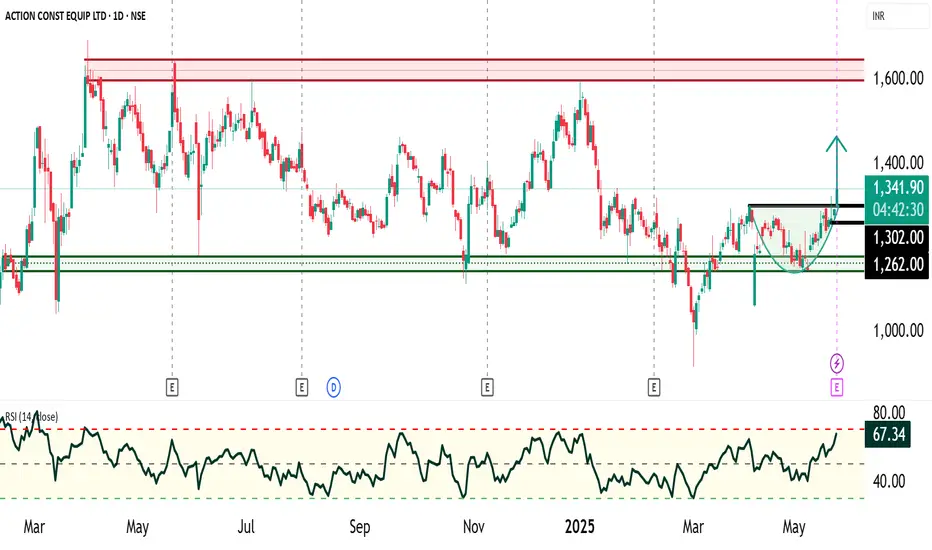
ACE Construction Ltd : Rounding Bottom Chart PatternACE Construction Ltd has been consolidating in a broad sideways range between ₹1,150 to ₹1,600 since February 2024. The price action has clearly defined support and resistance levels, with ₹1,150–₹1,200 acting as a strong accumulation zone and ₹1,550–₹1,600 serving as a firm resistance, where selling pressure consistently emerges.
Technical Pattern Observed (Hourly Timeframe): A Rounding Bottom pattern has been identified on the hourly chart, which is a bullish reversal pattern, indicating a shift from bearish to bullish sentiment.
Neckline Breakout Level: ₹1,300 (confirmed)
Breakout Confirmation: Price closed above neckline with volume support
Target Estimation (Measurement Rule):
Target 1: ₹1,450
Target 2 (Final): ₹1,550
Stop Loss: ₹1,260 (last swing high before breakout, risk-managed level)
Momentum & Trend Indicators:
Multi-EMA Bullish Crossover: Multiple exponential moving averages have aligned in a bullish formation, signaling trend continuation.
Relative Strength Index (RSI): Currently above 60, reflecting strengthening momentum and buyer dominance.
Fundamental Context: ACE Construction Ltd remains **fundamentally strong** with robust financials and growth visibility. The current price level provides an **attractive valuation**, further supporting the bullish technical setup.
Conclusion: The current technical setup presents a high-probability bullish opportunity in ACE Construction Ltd. The completion and breakout of the rounding bottom pattern, supported by bullish momentum indicators and favorable valuation, make a strong case for upward price movement towards ₹1,450–₹1,550 in the near term.