RSI Indicators SecretsUnlocking the True Power of Relative Strength Index in Trading
1. Understanding the Core of RSI
RSI is a momentum oscillator developed by J. Welles Wilder in 1978. It measures the speed and change of price movements on a scale from 0 to 100. Traditionally, an RSI above 70 is considered overbought (potential sell signal), while below 30 is considered oversold (potential buy signal).
However, treating these thresholds as rigid rules is a common beginner mistake. RSI is most effective when analyzed in conjunction with market context, trend direction, and price structure.
Calculation:
RSI = 100 −
Where RS = Average of n-period up closes ÷ Average of n-period down closes
Default period:
The standard RSI period is 14, but traders often adjust between 7 to 21 periods depending on market volatility and trading style.
Secret #1: Shorter periods make RSI more sensitive, generating early signals but increasing noise. Longer periods smooth the indicator, providing more reliable, but delayed, signals.
2. RSI and Trend Strength
Many traders misinterpret RSI purely as an overbought/oversold tool. In reality, RSI also reflects trend strength.
RSI above 50: Suggests bullish momentum.
RSI below 50: Suggests bearish momentum.
Secret #2: During strong trends, RSI can remain overbought or oversold for extended periods. A stock can stay above 70 in an uptrend without reversing, and below 30 in a downtrend. This is known as RSI trend hugging, which can prevent premature exit from profitable trades.
Advanced Tip: Combine RSI with trend indicators (moving averages or trendlines) to confirm momentum before acting on overbought/oversold signals.
3. RSI Divergence: The Hidden Market Signal
Divergence is one of the most powerful aspects of RSI. It occurs when price moves in one direction, but RSI moves in another. Divergences often signal trend exhaustion and potential reversals.
Bullish Divergence: Price makes a lower low, RSI makes a higher low → indicates potential upward reversal.
Bearish Divergence: Price makes a higher high, RSI makes a lower high → indicates potential downward reversal.
Secret #3: Not all divergences are created equal. Pay attention to trend context:
In strong trends, minor divergences may produce small corrections only.
Strong divergences in consolidation zones often lead to significant trend reversals.
Pro Tip: Multi-timeframe divergence analysis is more reliable. For example, daily RSI divergence confirmed by weekly RSI divergence can indicate a stronger trend shift.
4. RSI Failure Swings: Confirming Trend Reversals
Beyond divergence, Wilder introduced RSI failure swings, which provide clearer reversal signals:
Bullish Failure Swing: RSI drops below 30 (oversold), rises above 30, pulls back but stays above 30, then rises → confirms bullish reversal.
Bearish Failure Swing: RSI rises above 70 (overbought), drops below 70, retraces but stays below 70, then falls → confirms bearish reversal.
Secret #4: Failure swings are often more reliable than standard overbought/oversold signals because they focus on RSI structure, not just absolute levels.
5. RSI Levels Beyond 70 and 30
Many traders stick rigidly to the 70/30 overbought/oversold levels, but markets vary:
Strong trending markets: Use 80/20 levels to avoid false signals.
Range-bound markets: Stick to 70/30 for standard setups.
Secret #5: Customize RSI levels for each asset and timeframe. Historical backtesting often reveals that some stocks consistently top out at 65 or bottom at 35 before reversing.
6. Combining RSI With Other Indicators
RSI works best when combined with complementary indicators:
Moving Averages: Confirm trend direction before acting on RSI signals.
MACD: Momentum alignment can reduce false signals.
Support/Resistance Zones: Validate RSI divergences against key price levels.
Secret #6: RSI acts as a filter rather than a standalone trigger. Using it with other indicators significantly increases trade accuracy.
7. RSI in Multiple Timeframes
Analyzing RSI across timeframes provides a more complete market perspective:
Higher timeframe RSI: Indicates the primary trend (daily or weekly).
Lower timeframe RSI: Reveals short-term momentum for entries and exits.
Secret #7: Enter trades aligned with higher timeframe RSI. For instance, if weekly RSI shows bullish momentum, intraday dips below 30 on daily RSI can offer safer buying opportunities.
8. RSI in Range-Bound vs. Trending Markets
RSI strategies differ depending on market conditions:
Range-bound markets: Look for overbought/oversold signals for reversals at horizontal support/resistance.
Trending markets: Focus on pullbacks to 40–50 in uptrends or 50–60 in downtrends rather than relying solely on 70/30 signals.
Secret #8: RSI overbought/oversold signals are most effective in sideways markets; trend-followers should rely on RSI for momentum confirmation instead.
9. RSI Scalping and Intraday Trading Secrets
RSI is also effective for short-term trading:
Use shorter RSI periods (5–9) to capture quick momentum shifts.
Combine RSI with tick or minute charts for scalping opportunities.
Focus on intraday divergences and failure swings near session highs/lows.
Secret #9: Avoid RSI over-optimization. Extremely short periods can generate false signals, so always test on historical intraday data before applying real trades.
10. Psychological Edge With RSI
RSI not only measures momentum but also captures market psychology:
Overbought conditions indicate market euphoria.
Oversold conditions indicate fear or panic.
Secret #10: Understanding market sentiment through RSI can help anticipate sudden reversals caused by herd behavior rather than just technical levels.
11. Common Mistakes Traders Make With RSI
Blindly buying at oversold or selling at overbought levels.
Ignoring trend context and using RSI in isolation.
Overcomplicating with extreme customization without backtesting.
Secret #11: RSI is a powerful tool when used thoughtfully. Discipline, confirmation with other indicators, and context-aware trading separate successful RSI traders from those who fail.
12. Final Thoughts: Mastering RSI Secrets
The Relative Strength Index is deceptively simple on the surface, but its depth allows traders to uncover hidden momentum signals, trend strength, divergences, and reversal patterns. True mastery comes from combining:
Multi-timeframe analysis
Divergence and failure swing patterns
Customized overbought/oversold levels
Trend confirmation using complementary indicators
Understanding market psychology
By decoding these RSI secrets, traders can move beyond basic textbook applications to make strategic, confident, and highly effective trading decisions.
Rsioversold

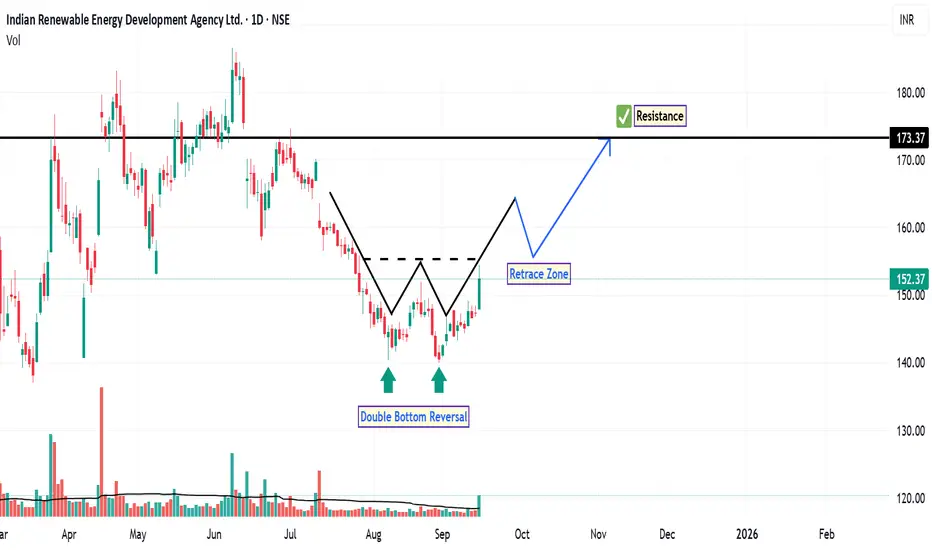
IREDA: Double Bottom in PlayOn the daily time frame, the chart of IREDA has recently displayed a double bottom reversal pattern , a classic technical formation often associated with a potential shift from bearish to bullish sentiment. This pattern, marked clearly on the chart, suggests that buyers may be stepping in at a previously defended price level.
In the preceding downtrend, the stock failed to establish a new low and instead broke above a prior swing high, indicating a CHoCH in market structure. This shift is typically interpreted by technical analysts as a transition from bearish to bullish momentum.
The RSI is currently above 60 , approaching the overbought zone. While this suggests strong buying interest, it also warrants caution as price may be nearing short-term exhaustion. However, in trending markets, RSI can remain elevated for extended periods. Additionally, the stock has managed to close above both the 20-day and 50-day EMAs, accompanied by increased volume, which adds credibility to the bullish setup. These moving averages often act as dynamic support levels and trend confirmation tools.
Based on this technical structure, the next potential resistance levels are identified near ₹160, followed by ₹173 . A technical stop-loss level could be considered at a daily close below ₹140 , which aligns with the double bottom support zone.
Disclaimer: This analysis is intended solely for educational and informational purposes. It does not constitute investment advice or a recommendation to buy, sell, or hold any financial instrument. Market conditions are subject to change, and trading decisions should be made based on individual research, risk tolerance, and consultation with a licensed financial advisor.
USDT Dominance Forming Triple Bottom – Bearish SignalUSDT Dominance is showing a triple bottom formation on the daily timeframe – a pattern that historically signals a potential reversal or bounce. Each time USDT.D has tested this region in the past, we've seen a strong bounce in dominance, often followed by pullbacks in BTC and altcoins due to their inverse relationship.
Key indicators aligning:
RSI is rebounding from oversold levels
Stochastic RSI showing upward momentum
MACD also signaling a possible bullish crossover
With August traditionally being a bearish month, we may be heading into a corrective phase or even a sharp dump across the crypto market.
📉 Take profits where needed and prepare for the next opportunity. Stay cautious and trade with discipline.

Linear Regression with RSI: A New approach to Trend AnalysisHello Friends,
Welcome to RK_Chaarts,
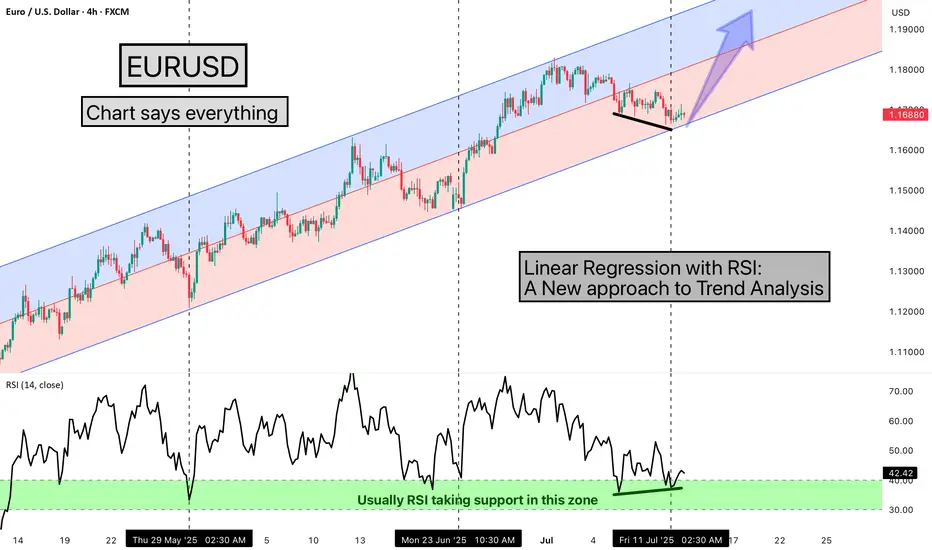
Today we are going to learn one Method of analysing the chart, here we are using EURUSD chart, and the method we're using is very simple & interesting, We are using the Linear Regression Trend Channel & Relative Strength Index (RSI), What happens in this method, is that we identify a particular zone where the price is making a one-sided move, like if the price is trending upwards, making higher highs and higher lows. We then apply a regression channel to it, and within that channel, we set internal deviation for the upper and lower sides, like 2 or 2.5 or 3 etc., whatever setting it takes.
In this chart, we can clearly see that the 2.5 setting is forming a complete channel, which we've applied for the last two months, from 12th May 2025, when the uptrend started. We've used the 4-hour time frame chart and the RSI. Every time the price hits the bottom of the channel, we can see that the RSI also enters the same zone, between 30-40, and from there, it bounces back.
Currently, the price has again hit the bottom of the regression channel, and the RSI has also gone below 40, between 30-40. And the good thing is that we're seeing a positive divergence in the RSI. So, there's a high possibility that the price might bounce back from here.
It's worth watching what happens next in the market. Nothing is guaranteed here; everything is a game of probabilities. This is one method that we often use, and its results have given us a very good experience. So, let's see what happens next in this chart. This observation is also a good learning experience, which we often encounter, 7-8 times out of 10, in favor of the market, but sometimes it doesn't work, maybe 2-3 times, when the trend changes. So, let's see what happens next.
This post is shared purely for educational purpose & it’s Not a trading advice.
I am not Sebi registered analyst.
My studies are for educational purpose only.
Please Consult your financial advisor before trading or investing.
I am not responsible for any kinds of your profits and your losses.
Most investors treat trading as a hobby because they have a full-time job doing something else.
However, If you treat trading like a business, it will pay you like a business.
If you treat like a hobby, hobbies don't pay, they cost you...!
Hope this post is helpful to community
Thanks
RK💕
Disclaimer and Risk Warning.
The analysis and discussion provided on in.tradingview.com is intended for educational purposes only and should not be relied upon for trading decisions. RK_Chaarts is not an investment adviser and the information provided here should not be taken as professional investment advice. Before buying or selling any investments, securities, or precious metals, it is recommended that you conduct your own due diligence. RK_Chaarts does not share in your profits and will not take responsibility for any losses you may incur. So Please Consult your financial advisor before trading or investing.
$BTC Forms Triple Bottom Pattern - Key Levels to Watch!#Bitcoin has formed a triple bottom pattern. To validate this pattern, BTC needs to hold the $91,500 level. A potential scenario is a bounce from the oversold RSI area, which could lead to a retest of $101,750 or even a breakout toward the $115,000 region. However, if BTC loses the $91,500 level, the next major support is at $90,000. A breakdown below that could see BTC dipping to $85,000, $80,000, or even $75,000. Let's see how the price action unfolds!
long - 93000$
short - 90000$

Exploring a Potential Bullish Outlook on VISAKAVisaka Industries Ltd has demonstrated a significant bullish trend as it has successfully closed above both the 20-day and 200-day EMAs. The trading volume during this period reached 2.31M shares, markedly higher than the 20-day average volume of approximately 336K shares, indicating strong investor interest.
Upon examining the stock's chart, it is evident that Visaka Industries has repeatedly found support at the trendline, bouncing back multiple times from a identified demand zone. This pattern is a positive indicator, suggesting a robust buying interest in this price area.
Both the RSI and the MACD indicators are currently situated within the oversold territory on both daily and weekly timeframes. This positioning typically suggests that the stock may be poised for a potential upward move as momentum begins to shift.
The next anticipated supply zone is identified around the price level of 124 . Investors may consider accumulating shares at the current market price CMP , which presents an estimated potential upside of approximately 15%. It is advisable to place a stop-loss order slightly below the demand zone at around 99 to manage risk effectively.
Disclaimer: The information contained in this analysis is intended solely for educational and informational purposes and should not be considered financial advice. Investors are encouraged to perform their own due diligence and/or consult with a qualified financial advisor prior to making any investment decisions.

Daily Bullish Flag Breakout in UNO MINDAHi,
NSE:UNOMINDA has given a Bullish Flag Breakout on Daily charts with very good volume.
MACD is also on the bullish side on daily, weekly and monthly time frames. RSI is also on the bullish side on daily and weekly time frames.
In the current market scenario I am expecting that the bullish momentum will continue.
Complete price projection like entry, stoploss and targets mentioned on the charts for educational purpose.
Please share your feedback or any queries on the study.
Disclaimer: Please consult your financial advisor before making any investment decision.

USDT.D FORMED BULLISH SHARK PATTERN USDT.D formed bullish shark and waiting for double bottom which conforms support then it pumps which leads BTC and Alts bleed for sometime

Get Ready for a surprise timing from #Timken #superchartzKey Levels:
Support: 2950
Resistance: 3130 3250 3300
Description:
Fundamentals:
The recent actions taken by Timken to significantly reduce its debt load and achieve almost debt-free status have profound implications for the company's fundamental strength:
Financial Stability:
The reduction in debt enhances financial stability, lowering interest expenses and overall financial risk.
A financially stable company is better equipped to withstand economic challenges and uncertainties.
Cash Flow Improvement:
Lower debt levels contribute to improved cash flow, enabling the company to allocate resources for growth initiatives or return value to shareholders.
Enhanced free cash flow is a positive signal for potential future investments or strategic decisions.
Credit Profile Enhancement:
Reduced debt typically leads to an improved credit profile, potentially resulting in higher credit ratings and lower borrowing costs.
A strengthened credit profile can instill confidence in investors and lenders alike.
Financial Flexibility:
Being almost debt-free provides the company with significant financial flexibility, allowing for strategic decisions without the constraints of heavy debt obligations.
Financial flexibility positions the company to capitalize on opportunities and navigate market dynamics effectively.
Investor Confidence:
Investors often favor companies with low or no debt, viewing them as more stable and secure investment options.
Almost debt-free status can attract a broader investor base seeking companies with strong financial health.
Technicals:
The technical analysis of Timken's stock reveals a notable breakout, signaling a potential shift in its price dynamics:
Trend Reversal:
The break of the trend line indicates a potential reversal in the stock's previous direction.
Investors may interpret this as a bullish signal, suggesting a change in market sentiment.
Preparing for New Highs:
The breakout suggests that Timken is gearing up for new highs, reflecting positive momentum.
Investors and traders often take note of such signals as they consider potential profit opportunities.
Technical Confirmation:
Breakouts are significant technical signals that confirm a change in the stock's trend.
Technical analysts may interpret this as a buy signal, potentially attracting more traders and investors to the stock.
Synergy with Fundamentals:
The technical breakout, when combined with improved fundamentals, creates a synergistic effect.
Strong fundamentals provide a foundation for potential growth, while technical signals attract a diverse range of investors, contributing to overall market confidence.
Market Perception:
Positive technical developments can shape a favorable market perception, drawing attention from both value and momentum investors.
The combination of strong fundamentals and a technical breakout positions Timken as a potentially attractive investment opportunity in the eyes of the market.
Investors should consider both technical and fundamental factors, conducting thorough research, before making informed investment decisions.

USDT.D+USDC.D IMP TREND LINE BOUNCEUSDT.D+USDC.D taking support at imp trend line if it breaks next support is 6.13 level.
bullish : RSI oversold area

Research report on RSI for beginnersLet's break down each point and explain them ::::::::::::::::: Happy learning
**Basic Concepts:**
1. **What is RSI?**
- RSI is like a traffic light for stocks in the Indian market. It tells you if a stock is moving too fast or too slow. If RSI is high, the stock might be overexcited, and if it's low, it might be tired.
2. **Calculation of RSI:**
- RSI is calculated by looking at how much a stock's price went up and how much it went down in the last 14 days. This gives you a number between 0 and 100.
3. **Interpreting RSI:**
- When RSI is above 70 in the Indian market, it's like a stock being at a crowded party – it might be time to leave soon. When RSI is below 30, it's like a stock being alone in a quiet room – it might be time to join the party.
4. **Divergence:**
- If a stock's price is doing one thing, and RSI is doing the opposite, it's like a disagreement. In India, this can signal a possible change in the stock's direction.
5. **Using RSI for Trend Confirmation:**
- RSI can help you confirm if a trend is strong in the Indian market. If RSI is above 70 in a rising market, the trend might continue. If RSI is below 30 in a falling market, the trend might keep going down.
**Intermediate Concepts:**
6. **RSI Period and Sensitivity:**
- You can change the "14-day" period to make RSI more or less sensitive to stock movements in India. Shorter periods are like a faster reaction, and longer periods are like a slower reaction.
7. **Centerline Crossovers:**
- RSI crossing the 50 mark in the Indian market is like a stock changing its mood. Above 50, it's becoming bullish (optimistic); below 50, it's becoming bearish (pessimistic).
8. **Overbought and Oversold Confirmation:**
- Overbought (above 70) in India can be like a stock being too hot to handle. Oversold (below 30) is like a stock being on a big discount. But remember, check other signals too.
**Advanced Concepts:**
9. **Hidden Divergence:**
- Hidden divergence in the Indian market is like spotting a hidden treasure. When a stock's price is doing something special, but RSI disagrees, it can be a hidden signal of a trend change.
10. **RSI and Support/Resistance:**
- RSI levels can act as bouncy floors (support) or glass ceilings (resistance) for stocks in India. If RSI bounces off a level, it can be a good entry or exit point.
11. **Multiple Timeframes:**
- Think of this like looking at a movie frame by frame. Combining RSI analysis on different timeframes in India gives you a full picture of the stock's behavior.
12. **RSI with Other Indicators:**
- RSI is like one player in a cricket team. When you have a whole team of indicators working together in the Indian market, you can make more accurate decisions.
13. **RSI Strategy Development:**
- This is like creating your own recipe for a perfect dish. Traders often create their unique RSI-based strategies in India with specific rules for when to buy and sell.
14. **Risk Management:**
- Just like a goalkeeper in football, you need to protect your goal (money). In India, set limits on how much you're willing to lose (stop-loss) and how much profit you're happy with (take-profit).
15. **Backtesting and Optimization:**
- Backtesting is like practicing before the big game. In India, you can test your RSI strategies on past data and tweak them to find the best ones for the future.
:::::::::::::::::::::::::::::::::::::::: Formula :::::::::::::::::::::::::::::::::::::::::::::::::::::::
Relative Strength Index (RSI) Formula:
RSI = 100 -
RSI (Relative Strength Index) is calculated using the following steps:
Calculate Daily Price Changes: Find the price changes (typically closing prices) from one day to the next. If today's closing price is higher than yesterday's, it's considered a "gain," and if it's lower, it's a "loss."
Calculate Average Gain and Average Loss: Calculate the average gain and average loss over a specified period, usually 14 days. The average gain is the sum of gains over the period divided by 14, and the average loss is the sum of losses divided by 14.
Calculate the Relative Strength (RS): Divide the average gain by the average loss to get the relative strength (RS). RS = Average Gain / Average Loss.
Calculate the RSI: Use the RS to calculate the RSI using the formula RSI = 100 - .
Further Explanation:
RSI is used to determine whether a stock or market is overbought (too high) or oversold (too low). Here's a more detailed explanation:
RSI values range from 0 to 100. When RSI is above 70, it's typically considered overbought, suggesting that the stock might be due for a price correction or a pullback in the Indian market.
When RSI is below 30, it's usually considered oversold, indicating that the stock might be undervalued or due for a potential price increase in the Indian market.
Traders often use RSI to identify potential entry and exit points. For example, if RSI crosses above 70, it may be a signal to sell or take profits. Conversely, if RSI crosses below 30, it may be a signal to buy or enter a position.
Hidden divergence occurs when the price of a stock in the Indian market makes a higher high (in an uptrend) or a lower low (in a downtrend), but the RSI fails to do the same. This can be a more subtle sign of a trend reversal.
RSI can be used in conjunction with other technical indicators to enhance trading strategies in the Indian market.
BSE:BANK NSE:BANKNIFTY NSE:ICICIBANK NSE:AXISBANK NSE:SBIN NSE:KOTAKBANK NSE:UNIONBANK NSEIX:NIFTY1!

USDT.D forming bullish shark pattern USDT.D forming bullish shark and RSI in oversold which have lot chance to move upside it causes Btc and Alts will bleed 🩸 for sometime and crypto will bought at black Friday sale.

USDT.D LOOKS BULLISH SHARK USDT.D making bullish move
REASONS : 1. bullish shark pattern
2. over sold RSI and hidden exaggerated divergence.
EFFECTS : It will make btc and atls bleed.

Time to wake up and put a 10x long on BTC. Leverage is always ⚠️Put your money is instant 20% long right now !.
Charts don't usually lie. People will repost seeing my chart , but i am the who creates it .

WILL SOBHA BOUNCE FROM LINE OF CONTROL??Trade Wisely. We Can Just Predict.
Disclaimer: I am not a SEBI registered advisor , so before entering on my view please ask your SEBI Registered Advisor . Profit is your and loss is your.
If you love my analysis Like And Share wherever you want..

WILL #INSECTICIDESINDIA BOUNCE FROM LINE OF CONTROL??Trade Wisely. We Can Just Predict.
Disclaimer: I am not a SEBI registered advisor , so before entering on my view please ask your SEBI Registered Advisor . Profit is your and loss is your.

WILL #CIPLA BOUNCE FROM CRUCIAL ZONE??Trade Wisely. We Can Just Predict.
Disclaimer: I am not a SEBI registered advisor , so before entering on my view please ask your SEBI Registered Advisor . Profit is your and loss is your.
If you love my analysis Like And Share wherever you want..

WILL LAURUSLABS BREAK ITS JINK OF DOWNTREND??Trade Wisely. We Can Just Predict.
Disclaimer: I am not a SEBI registered advisor , so before entering on my view please ask your SEBI Registered Advisor . Profit is your and loss is your.

WILL #LODHA COME OUT OF OVERSOLD ZONE?? Trade Wisely. We Can Just Predict.
Disclaimer: I am not a SEBI registered advisor , so before entering on my view please ask your SEBI Registered Advisor . Profit is your and loss is your.

ABFRL ready for bounce playBuy ABFRL FUT 234-240 for 248/255/260. Invalid below 228 on hourly close only. RSI below 30 showing oversold levels. ABFRL available near multiple trendline supports levels.

Bank Nifty - Harmonic PatternBank nifty had broken all the previous supports today and is expected to continue its down trend. As bank nifty is overly sold, a pull back rally can be expected before it continues its down trend. Currently, Bank Nifty is sell on rise mode and one can expect a reversal from the marked harmonic level.

SELF EXPLANATORY SERIES : QUICK ANALYSIS ON TATACONSUM.In this self explanatory series I will be posting charts with pure technical analysis only without full length explanations , Traders can ask their doubts in comments section, Happy trading.
Disclaimer : This idea was to just give you an insight about my own view and personal observations. Please do your own research or consult an investment advisor before doing any investment or trading.

BAJAJ_AUTO | Bullish Trendline support + RSI oversold areaBAJAJ_AUTO | Bullish Trendline support + RSI oversold area
CMP : 3680
SL : 3400
Target : Open (Hold atleast 1:2 risk reward)
