Reliable but rare Candlestick pattern : Three Stars in the South"Three Stars in the South" is one of the most reliable bullish reversal pattern but it does not form very often. Identification criteria is as under. The market is in a downtrend;
The first candle is black with a long real body, long lower shadow, and no upper shadow;
The second candle is black with a shorter real body and a higher low than the first candle’s low;
And, the third candle is black with a short real body and no shadows and a close that’s within the high-low range of the second candle.
It is ranked first in top reversal candlestics pattern by Thomas Bulkowski.
Please post here if you find it.
Search in ideas for "CANDLESTICK"

Nifty_Hanging Man_FYI GuysA hanging man is a bearish candlestick pattern that forms at the end of an uptrend. It is created when there is a significant sell-off near the market open, but buyers are able to push this stock back up so that it closes at or near the opening price. Generally, the large sell-off is seen as an early indication that the bulls (buyers) are losing control and demand for the asset is waning.
The hanging man formation does not mean that the bulls have definitively lost control, but it may be an early sign that the momentum is decreasing and the direction of the asset may be getting ready to change. Hanging man formations can be more easily identified in intraday charts than daily charts and are a very popular formation used by day traders. If this pattern is found at the end of a downtrend, it is known as a "hammer".

Bearish Engulfing Pattern on GNFC
The Bearish Engulfing pattern has emerged on the trading chart of NSE:GNFC GNFC, signaling a potential trend reversal in this scrip. Trading View users and investors tracking GNFC will find this pattern of particular interest, as it suggests a shift in market sentiment from bullish to bearish.
The Bearish Engulfing pattern is a widely recognized technical analysis tool used to identify potential reversals in an uptrend. It consists of two candlesticks: a smaller bullish candlestick followed by a larger bearish candlestick that completely engulfs the previous candle. The pattern indicates a change in control from buyers to sellers, as the bears overwhelm the bulls, potentially leading to a downward price movement.
In the case of GNFC, the Bearish Engulfing pattern has materialized, with the second bearish candlestick entirely covering the preceding bullish candlestick. This development implies that selling pressure has intensified, and investors should exercise caution.
Traders and investors who use Trading View can leverage this information to make informed decisions regarding their positions in GNFC. By recognizing the Bearish Engulfing pattern, they may consider potential actions such as reducing or exiting long positions, implementing short positions, or employing risk management strategies to protect their portfolios.
Additionally, users can take advantage of Trading View's comprehensive charting tools and technical indicators to validate the Bearish Engulfing pattern, further enhancing their understanding and confidence in the potential trend reversal.
Remember, while the Bearish Engulfing pattern is a powerful tool, it should not be viewed in isolation. Combining it with other technical analysis tools and considering fundamental factors relevant to GNFC will provide a more comprehensive view of the scrip's future price action.
Trading View users tracking GNFC should monitor subsequent price movements closely to confirm the validity of the pattern and to stay updated on any emerging trends or signals that may impact their trading decisions.
Please note that this description is based on historical data, and it's essential to conduct thorough research and analysis before making any investment decisions.
Credit for indicator : Pro trading art
Thankyou WOLFS !

VOLTAS: Is GST & Rainy Season Impact Q2 Result ?What Suggests Combination of RSI & W%R ???
where to Short & Cover plotted on Chart.
Candle pattern: BEARISH HARAMI
Some words about "BEARISH HARAMI":
Definition : Given on Chart
Recognition Criteria
1. The market is characterized by a prevailing uptrend.
2. A white body is observed on the first day.
3. The black body that is formed on the second day is completely engulfed by the body of the first day.
Pattern Requirements and Flexibility
The pattern consists of two candlesticks, in which the first day’s white candlestick engulfs the following day’s black candlestick. The first one should be a normal or a long white candlestick. Either the body tops or the body bottoms of the two candlesticks may be at the same level, but whatever the case, the black body should be smaller than the previous white body.
Trader’s Behavior
The Bearish Harami is a sign of disparity in the market’s health. The market is characterized by an uptrend and a bullish mood, and there is heavy buying indicated by a white body, which further supports the bullishness. However, the next day prices open lower or at the close of the preceding day and stay in a small range throughout the day, closing even lower, but still within the previous day’s body. Traders are now concerned about the strength of the market, due to this suddenly deteriorating trend.
Sell/Stop Loss Levels
The confirmation level is defined as the last close or the midpoint of the first white body, whichever is lower. Prices should cross below this level for confirmation.
The stop loss level is defined as the higher of the last two highs. Following the bearish signal, if prices go up instead of going down, and close or make two consecutive daily highs above the stop loss level, while no bullish pattern is detected, then the stop loss is triggered.
Also read: Candle pattern "Bullish HARAMI" in earlier "ICICIPRULI Post"
For intraday levels Snapshot will be posted Later.
Watch for more Updates & Strategy (FnO)
If enriched your knowledge,
Please don't forget to LIKE, SHARE .
Comment appreciated.
Disclaimer: Only For STUDY. For Taking Trade Decision Consult Financial Advisor.

Universal Cables: BEARISH LADDER TOP Along with ENGULFINGPattern sell entry @ 279.10, Confirmation if stays Below 278.70 for 30 mins.
Definition:
This is a five candlestick pattern that starts with three strong white candlesticks. The uptrend continues with the fourth higher close. The next day gaps lower and closes much lower than the previous day or two. This may imply a bearish reversal.
Recognition Criteria:
1. The market is characterized by a prevailing uptrend.
2. Three strong white candlesticks occur much like the Three White Soldiers pattern.
3. The fourth white candlestick closes also higher but has a long lower shadow.
4. The fifth day is a strong black with an open below the previous day’s body.
Pattern Requirements and Flexibility:
The first three days of the Bearish Ladder Top are strong white candlesticks with consecutive higher opens and higher closes. The fourth day is a short white candlestick, but it opens lower and trades lower, leaving a long lower shadow, then closes making a new high. The fifth day is a strong black candlestick that makes a body gap with the fourth day.
Trader’s Behavior:
There is a considerable uptrend for some time and the bulls are happy. Then we see a good upward move. Prices start trading below the opening price and almost reaching to the new low of the previous day, but then they close at another new high. This action is a warning for the bulls telling them that the market will not go up forever. The bulls may then be forced to reevaluate their positions and they may start taking profits. This act is the reason behind the downward gap we see on the last day of the pattern and also the close is considerably lower. A trend reversal has probably occurred. However, a confirmation will still be required on the next day.
Sell/Stop Loss Levels:
The confirmation level is defined as the last close. Prices should cross below this level for confirmation.
The stop loss level is defined as the last high. Following the bearish signal, if prices go up instead of going down, and close or make two consecutive daily highs above the stop loss level, while no bullish pattern is detected, then the stop loss is triggered.

COALINDIA: BULLISH LADDER BOTTOM Pattern.In UP Move @ 282.10 looks Crucial. Closing Above that Trend Reversal Confirmation.
Candlestick Pattern: BULLISH LADDER BOTTOM.
Pattern Details:
Definition:
This is a five candlestick pattern that starts with three strong black candlesticks. The downtrend continues with the fourth lower close. The next day gaps higher and closes much higher than the previous day or two. This may imply a bullish reversal.
Recognition Criteria:
1. The market is characterized by a prevailing downtrend.
2. Three strong black candlesticks occur much like the Three Black Crows pattern.
3. The fourth black candlestick closes also lower but has a long upper shadow.
4. The fifth day is a strong white with an open above the previous day’s body.
Pattern Requirements and Flexibility:
The first three days of the Bullish Ladder Bottom are strong black candlesticks with consecutive lower opens and lower closes. The fourth day is a short black candlestick, but it opens higher and trades higher, leaving a long upper shadow, then closes making a new low. The fifth day is a strong white candlestick that makes a body gap with the fourth day.
Trader’s Behavior:
There is a considerable downtrend for some time and the bears are happy. Then we see a good downward move. Prices start trading above the opening price and almost reaching to the new high of the previous day, but then they close at another new low. This action is a warning for shorts telling them that the market will not go down forever. The shorts may then be forced to reevaluate their positions and they may start closing their positions on the next day if profits are good. This act is the reason behind the upward gap we see on the last day of the pattern and also the close is considerably higher. If the volume is high on the last day, a trend reversal has probably occurred. However, a confirmation will still be required on the next day.
Buy/Stop Loss Levels:
The confirmation level is defined as the last close. Prices should cross above this level for confirmation.
The stop loss level is defined as the last low. Following the BUY, if prices go down instead of going up, and close or make two consecutive daily lows below the stop loss level, while no bearish pattern is detected, then the stop loss is triggered.
Education purpose only.

BOMBAY SUPER SEEDS LTD [BSHSL]- DESCENDING CHANNEL PATTERN1. Pattern Analysis: What We See
- Pattern Name: Descending Channel with Double Bottom Breakout.
- What is Happening?
- The stock has been moving downwards within a descending channel for the last two years. This means the price has been repeatedly bouncing between two downward-sloping lines (the upper red resistance line and the lower blue support line).
- Recently, the price broke above ₹173, which was the resistance level of the descending channel and the breakout point for a double bottom pattern (a strong bullish reversal pattern).
- Why is This Important?
- A breakout from such long-term patterns, especially with strong volume, indicates that the trend is changing from bearish to bullish.
- The stock is showing strength and is now poised to move higher if it holds above ₹173.
2. Volume Analysis: What the Numbers Tell Us
- Recent Volume Behavior:
- Over the past two weeks, we’ve seen a sharp increase in trading volume. This suggests that big players (like institutions) are buying the stock in anticipation of higher prices.
- This spike in volume aligns perfectly with the breakout above ₹173, adding confidence to the bullish signal.
3. Price Action: What the Candles Show
- Recent Candlesticks:
- The last few candles on the chart are big and bullish (wide bodies with strong upward movement).
- The stock is now trading near ₹170–₹173, showing strength after the breakout.
4. Bullish Signal Confirmation
- Breakout Confirmation:
- The stock has crossed and stayed above ₹173, confirming the breakout.
- This is a clear sign of a bullish trend reversal.
- Key Levels to Watch:
- Support (Safety Net): ₹150 is the critical support level. If the stock falls below this, the bullish setup could weaken.
- Resistance (Next Hurdles):
- First Target: ₹200 (psychological and historical resistance).
- Second Target: ₹260 (next major resistance based on the pattern).
5. Entry, Targets, and Stop Loss
- Recommended Entry:
- You can consider entering near ₹173 if the stock holds above this level with good volume.
- Targets:
- First Target: ₹200 (short-term).
- Second Target: ₹260 (medium-term).
- Stop Loss:
- Keep a stop loss at ₹150. This ensures that if the stock moves against the setup, your losses are minimized.
Disclaimer:
This analysis is for educational purposes only and should not be considered as investment advice. We are SEBI-registered research analysts, and while the information shared is based on thorough technical analysis, you are strongly advised to consult your financial advisor or analyst before making any investment decisions. Markets carry risks, and past performance does not guarantee future results.


Zentec Bullish engulfing 1DThe pattern consists of a small red candlestick followed by a larger green candlestick that completely engulfs the previous red candlestick. The red candlestick represents selling pressure, while the green candlestick represents a strong buying pressure that is able to overcome the selling pressure and push the price higher.
The potential targets are 305, 345 and 380.

TVSMOTOR, 1D forms Bearish EngulfingNSE:TVSMOTOR TVS Motor Company is an Indian multinational motorcycle manufacturer headquartered in Chennai. It is the third-largest motorcycle company in India in terms of revenue. The company has annual sales of three million units and an annual production capacity of over four million vehicles.
TVSMotor formed Bearish engulfing candlestick pattern after an uptrend on daily timeframe and gave closing below that candlestick pattern.
Entry : 1454.4
Target : 1386
SL : 1502
RR : 1.44

NZDUSD 4H short idea | FVG setup Confirmations:-
1] market structure shift
2] order block
3] fvg entry
4] trend continuation
5] engulfing bar candlestick confirmation
Target:- 1:3.5 RRR

CUMMINSIND, 1D formed Morning starNSE:CUMMINSIND Formed in 1962, the largest entity of Cummins in India, Cummins India Limited is the country's leading manufacturer of diesel and natural gas engines.
Cummins India formed morning star candlestick pattern and gave closing above it.
Entry : 1755.35
Target : 1821.40
SL : 1670
RR : 0.77

NIFTY 50 ( BEARISH DARK CLOUD COVER)A bearish dark cloud cover candlestick formed on weekly time frame but we can get more confirmation just after follow through bearish candle formation.

NIFTY 50 ( BEARISH DARK CLOUD COVER)A bearish dark cloud cover candlestick formed on weekly time frame but we can get more confirmation just after follow through bearish candle formation.

AXISBANKBULLISH PATTERN HERE.
WE HAVE SEEN BULLISH ENGULFING CANDLESTICK PATTERN .
PATTERN HAS ORMED NEAR SUPPORT AREA.

candlestick pattern✓Formed a perfect bullish engulfing pair
✓After a bearish and bullish big candlesticks
✓weekly pattern shows the clear bullish engulfing

Reliance LongReliance Long
Bullish engulfing candlesticks pattern
Buy at CMP- 2430
SL- 2309
Target- 2560, 2645, 2722
Disclaimer- We are not SEBI registered advisor.
Charts and views are only for educational purpose.

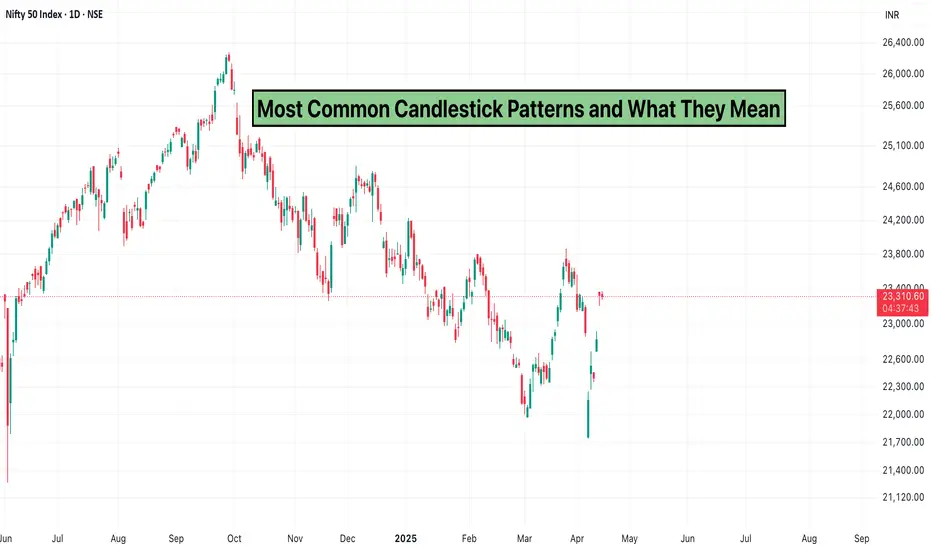
Most Common Candlestick Patterns and What They MeanCandlestick patterns are one of the most widely used tools in technical analysis. They visually represent price movements and offer insights into market sentiment, potential reversals, and continuation patterns. Whether you're a beginner or an experienced trader, understanding the most common candlestick patterns can significantly improve your chart-reading skills.
1. Doji
A Doji forms when the opening and closing prices are nearly the same. It signals indecision in the market and can indicate a potential reversal when it appears after a strong trend.
2. Hammer
The Hammer is a bullish reversal pattern that appears after a downtrend. It has a small body and a long lower wick, showing that buyers stepped in to push the price higher.
3. Hanging Man
The Hanging Man looks like a Hammer but forms after an uptrend. It suggests that selling pressure is increasing and could signal a bearish reversal.
4. Bullish Engulfing
This two-candle pattern appears when a small red candle is followed by a larger green candle that completely engulfs it. It signals strong buying momentum and a potential bullish reversal.
5. Bearish Engulfing
The opposite of the Bullish Engulfing, this pattern forms when a small green candle is followed by a larger red candle. It indicates selling pressure and a possible trend reversal to the downside.
6. Morning Star
The Morning Star is a three-candle bullish reversal pattern. It consists of a long red candle, a small-bodied candle (indicating indecision), and a strong green candle. It typically appears at the bottom of a downtrend.
7. Evening Star
This is the bearish counterpart to the Morning Star. It includes a long green candle, a small-bodied candle, and a strong red candle. It usually forms at the top of an uptrend and signals a potential bearish reversal.
8. Shooting Star
A Shooting Star has a small body and a long upper wick. It appears after an uptrend and suggests that the price may start to fall due to growing selling pressure.
Conclusion
Recognizing these common candlestick patterns can help you better understand market dynamics and improve your timing for entries and exits.
While they’re powerful tools, always combine candlestick analysis with other indicators and market context for more reliable trading decisions.
GRASIM: Evening Star with ResistanceStock has formed a reversal candlestick pattern which is known as Evening Star on weekly time frame. Also there is a horizontal resistance which suggests that the trend developed from the bottom of 1274 is exhausted and stock is ready to turn from the current level.
In the Evening Star Candlestick Pattern, the first candle closes bullish and the second candle closes with a small range and, the third candle closes aggressively lower (more than 50% of the first candle).
Evening Star Explanation:
In the Evening star candlestick pattern, the first candle shows the buyers are dominating as the price closes higher.
On the second candle, there is indecision in the market as both selling and buying pressure are in equilibrium (that's why the range of the candle is small).
On the third candle, the sellers win the battle and, the price closes lower.
Trading Strategy: Keeping SL of 1790 go short on current levels and look for the target of 1590/1550

Dhfl - Double bottom and rising wedge breakdown REVERSAL ?Scrip has shown some sign of reversal with green candlestick engulf at the downtrend although the real body of green candlestick closed at below of preceeding candlestick so will wait for further confirmation before entering at entry range defined in chart towards resistance levels

No more ruling the skies of the aviation sector!! - INDIGOInterglobal Aviation (INDIGO) has shown several bearish patterns recently, indicating potential downward trends in its stock performance.
Weekly : Bearish Engulfing Candlestick Pattern.
Daily : Three Outside Down with very weak volume
Each candlestick pattern confirms a bearish trend, suggesting a short trade. Additionally, global factors are expected to impact the aviation sector.
Entry: 4425
Stop Loss: 4740
Target: Open/Mentioned.
Let me know if you found this interesting.
Happy trading! 😄

POWERGRID - very bearish after breaking out of double top
DOUBLE TOP BREAKOUT -
price of NSE:POWERGRID has recently broken out of a perfect double top pattern indicating strong downward pressure for the stock
MORNING STAR CANDLESTICK -
price has formed a morning star candlestick pattern at the last peak indicating bearish momentum for the stock
CROSSED BELOW 200D SMA -
the price has also recently crossed below 200D sma which is an indicator of strong downside pressure for the stock.
TARGET -
the price will go till 301.9 level

MOTILALOFS: Active inverted hammer candle spotted !An inverted hammer is a BULLISH signal. It is a type of candlestick pattern found after a downtrend and is usually taken to be a trend-reversal signal. The inverted hammer looks like an upside down version of the hammer candlestick pattern, and when it appears in an uptrend is called a shooting 🌟.
