HEROMOTOCO Ready for Bulls Ride ??!!!!Chart patterns convincing me to post the above titled opinion
REASONS
1. HEROMOTOCO has been trading inside a Expanding Triangular Pattern by Taking support & resistance at respective levels
2. Currently, it is going through the up swing move inside the pattern
3. 2022 November Monthly candle seems to be an INDICATION for RACING BULLS ARRIVAL(with high tested)
4. No other Auto stock gave such a Bullish November candle
5. The same November candle broke and closed above the WHITE trendline with Volume SUPPORT!!!
6. Inverted Head & Shoulders pattern formed, Same November candle seems to be the breakout candle again!!!
7. Big move can be expected in the coming days.... (Probability looks more for the upside!!)
8. Target & SL levels mentioned @ chart
9. HEROMOTOCO composes 5.97% WIEGHTAGE in NiftyAuto index and 0.47% in Nifty50 index !!!
Monthly chart close look below
DAILY TIME FRAME BELOW
Let's wait and watch how it moves!!!!
Note - Just sharing my view....not a tip nor advice!!!!
Search in ideas for "Chart Patterns"

SIEMENS Ready for a Sharp CORRECTION MOVE ??!!!Chart patterns poise way for the above titled opinion
Reasons
1. SIEMENS travelling in a Ascending channel (From 2019)(Bright red & green lines shown in chart).
2. Now, it seems ready for the downswing (white trendline descending channel shown in chart) inside the Ascending channel.
3. Rounding top too confirming the chances of down move .
4. GAP b/w 6th & 7th December is acting as Support.
Entry can be made after the yellow trendline gets broken.(Keeping the high of the breakdown candle as SL)
FIB 0.5 can act as support in downside(1st target)- 2645
Safe SL mentioned @ chart.(IF WE ENTER NOW)
Let's wait & watch how it moves!!!!
Note - Just Sharing my view...not a tip nor advice!!!

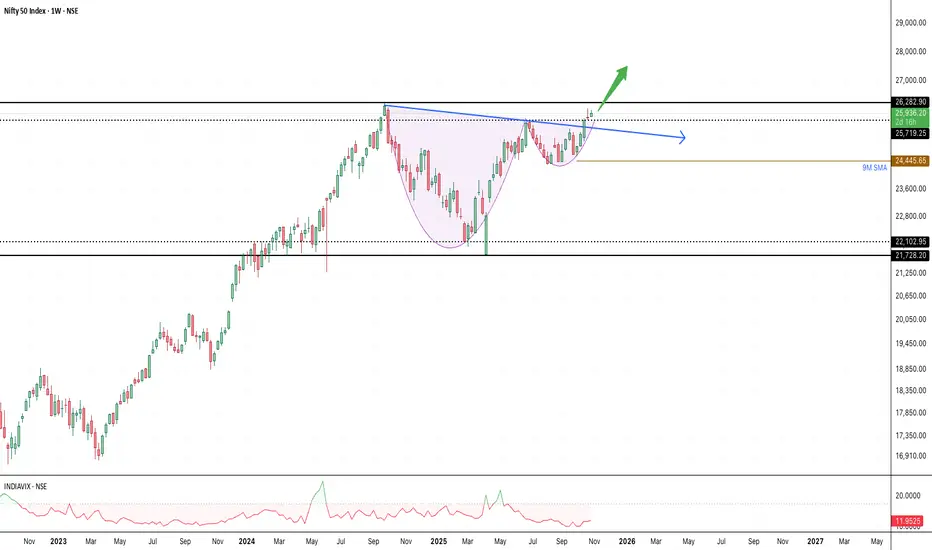
Its Nifty making Cup and Handle. At weekly timeframe. Chart patterns performs well when appears on big timeframe. Here its weekly chart of Nifty making Cup and Handle lets see how it performs in future. For Learnings only.
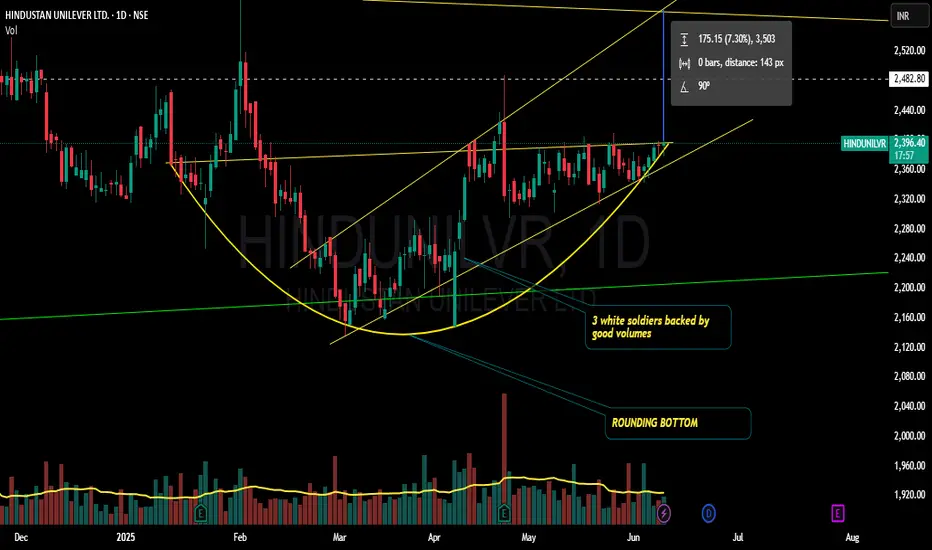
Hindunilvr longing for a breakout??!!Chart patterns inflict me the above titled opinion
Breakout can be expected as it has not breached the low made on 25th april 2025 and has been consistently making higher highs and higher lows(seen clearly on hourly charts)
Entry after the breakout.. ...
Godrejcp also seen for a up move!!!!
will update once it breaks out!!!!
Thank you.
This is just my opinion...not a advice!!!!
MAXHEALTH | Inv HEAD AND SHOULDER | WACHLISTChart patterns shown for MAX Healthcare (NSE: MAXHEALTH):
---
🔍 **Pattern Observed:**
The chart showcases an INV HEAD AND SHOULDER pattern in progress, which is a bullish continuation pattern.
---
🔹 **Key Levels:**
* **resistance (neckline breakout)**: \~₹1,195–₹1,227 zone
* **Current price:** \~₹1,194.60

VOLTAS Chills down to its Major Support ??!!Chart patterns look optimal for a short trade in Voltas
Reasons
1. VOLTAS has been taking support at the its 10 YEAR OLD SUPPORT TRENDLINE (bright green line- from 2013 till now )
2. Right now, it is in its downswing move inside the channel pattern.
3. [b ]Inverted Cup & Handle pattern too formed and given BREAKDOWN today (27/04/23)
4. As per pattern, target amounts to the depth of the cup(nearly 100 points)
5. Target levels shown @ chart(horizontal dashed green lines)
6. Breakdown candle is more than 5 % and SL gets difficult to place....Safer SL can be day closing above 822
7. Lower low too formed increasing the probability of down move.
Even if you don't short, It's better not to go long now....
Let's wait & watch how it moves!!!
Note - Just sharing my view , not a tip nor advice!!!

Ashokley Numerous Bearish signs!!!!Chart Patterns look good for a short trade
REASONS
1. In Weekly timeframe, Ashokleyland broke out of the Ascending channel on sep 2022 & Right now it formed a Bearish Pennant pattern and Gave breakdown for that too!!!(SHOWN BELOW)
2. In daily time frame, it is moving alike Inverted cup& Handle pattern(shown below)
3. In 2hr timeframe, it is trading inside a DESCENDING CHANNEL and also there is Bearish pole pennant pattern seen.
4. There is an UNFILLED GAP ZONE (127- 125 RANGE)(Gaps often gets filled)
5. Target(dashed bright green lines) & Sl(dashed red line ) levels mentioned @ chart
6. Gap zone(green rectangle ) can acts as good support!!
Just be fixed with the SL level.
Let's wait and watch how it moves!!!
NOTE - Just sharing my view....not a tip nor advice!!!!

Bears got Upper hand in CROMPTON ??!!!Chart patterns just impressing me with the title stated above.
Reasons :
(with respect to weekly time frame)
1. Crompton is travelling(and respecting) in expanding triangle pattern.
2. Now, there is bearish flag formation and given breakdown with volume (shown in chart).
3. Breakdown candle is a bullish engulfing candle.
4. Purple line(315 level) can be considered for the target.(as it may turn to be a consolidation zone)
5. If purple line too broken (chances are high) , then we can think about the next level target(will update)
6. Safe less risky SL can be Day candle closing above the flag (yellow line).
Let's wait and watch how it moves.
Note - Just Sharing my view....not a tip nor advice!!!

MUTHOOTFIN Down to see 800 level ??!!!Chart patterns insist me the above titled opinion.
Reasons
1. Muthoot finance has been travelling in a expanding triangle pattern from 2015.
2. Till now, its respecting the pattern by taking support and resistance at perfect levels.
3. Currently it is in downswing inside the pattern.
4. It may take take support at the Major support (GRENN LINE 800 LEVEL ) soon .
In Weekly timeframe, there is BEARISH PENNANT formation , yet to give BREAKDOWN.
5. only if the Bearish Pennant gives BREAKDOWN , we can confirm the down move .
I will update(Target and SL) once it gives Breakdown!!!
We need to wait, as the breakdown can occur this week or 2 month later or never.
Let's wait for the Market's decision!!!
As of now, (on seeing the chart) its not easy for bulls to charge up.
Note : Just sharing my view....not a tip nor advice!!!

Triangle pattern breakout in LT hourly chartChart patterns work amazingly well in markets where momentum is building. Just like current times where a counter-trend rally is ongoing. I spotted a triangle pattern being formed in hourly time frame in LT. See how beautifully it broke out.
I entered when RSI was touching 60. DId test me for a day before breaking out.

PIDILITIND SERIES OF BEARISH FLAGS !!!!Chart patterns look apt for a short trade in Pidilite industries
REASONS
1. PIDILITIND from September 2022 has been in Downtrend forming lower highs and lower lows
2. Currently it is ,at its 3rd BEARISH FLAG pattern (gave breakdown with volume spike)
3. Previous 2 Bearish flags achieved their targets(as per pattern-pole length) without any sluggishness
4. There is DEMAND ZONE down near 2100 levels
5. SL as shown @ chart
6. Target - 2140, 2100(trail the SL)
7. Lower low formed on Friday(24 Feb) increases the probability of our short trade
Let's wait and watch how it moves!!!!
NOTE- Just Sharing my view...not a tip nor advice!!!

#APOLLOHOSP READY FOR A DOWNMOVE ??!!!Chart patterns indicating a short opportunity.
Reasons below for my opinion:
Bearish engulfing pattern in weekly timeframe.(with superb volumes)
Breakdown in daily timeframe with volume(shown in chart)
Triple top pattern
Stoploss level can be red horizontal line(safer)....green line(risky)
Target level as shown in chart.
Let's wait and watch...
Note- not a tip nor advice...just sharing my view!!


GAIL Bullish way ahead?!!!Chart patterns suggest me the above titled opinion
1. Its is travelling in a Ascending channel pattern making Higher highs and higher lows .
2. Now it is at the bottom support loading for the explosive move ahead.
3. Let's wait for the Breakout and enter.
Target levels mentioned in chart...SL update after breakout.
Longer time frames also shows the bullish edge in GAIL
This is just my opinion..... not a tip nor advice!!!!
Thank you!!!

Sbilife Getting ready for the rally ahead?!!!Chart patterns suggest me the above titled opinion
1. Weekly time frame shows a three white soldiers (month of april 2025) with good volume support....now the consolidation happening
2. In daily time frame, it is travelling in a expanding channel pattern , currently at the support line at the bottom
3. We need a confirmation for the rally with a Breakout candle....which we can expect during the result release.
4.If we make our entry now, we can make our stoploss as daily candle close out of the channel
5. Best entry is to wait for the Breakout and enter with SL below the breakout candle
6.Target levels as mentioned in the chart.
With strong fundamentals and decent valuations, Sbilife is one of the best options for long term bet in the insurance sector!!!
This is just my opinion ....not a tip nor advice..
Thank you!!!!

Chart Patterns repeat themselves !CNX MEDIA is forming a triangle pattern on the monthly chart. Similar pattern was observed in the past.

SPECULATIVE Chart patterns suggests a gain for 3 days continue and a fall for a time.....
just a 3 day stock i must say.

DAMODARIND Nice Swing Opportunity ??!!! Better not to Miss!!!!Chart patterns look convincing for a long swing trade
Reasons
1. Cup & Handle is in process.
2. 0.618 fib level broken out with volume(weekly timeframe) .
3. Double bottom with low and higher low .
4. Good volume support at perfect levels.
Safe to get in after Cup & Handle Breakout....
Risky entry can be made if keeping the SL as Day close below 50.
Quick Target can be the Neckline(70 level)!!!
Fundamentally,
Operating activity has been showing good numbers.
Promoter pledge has been in the negative side of this stock...
Will update once it breaks out!!!
If pattern gets breakout....target as per pattern can be 120 level.
Let's see how it moves!!!
Note: Just Sharing my view...not a tip nor advice!!!

range breakout and ready to breakchart patterns
intraday
breakout
trend analysis
waiting for breakout

3 White Soldiers bullish breakout - ATH Chart Patterns,
1. Ascending Triangles - Weekly time frame ( March'22 to till date)
3. Retest Previous ATH Level, highlight with yellow color
4. 3 White Soldiers - Weekly time frame, depicts high bullish sentiment.
Nifty to reach 23k in next 12 months.


NIFTY -- 3 BLACK CROWS vs MORNING STAR Chart patterns looks interesting from both bull and bearish point of view
REASONS
BEARISH VIEW
1. 3 Black crows (perfect closing) with rise in volumes ( www.tradingview.com)
2. February monthly candle looks like BREAKDOWN candle with low tested the next month
3. Weekly H&S pattern in progress
4. Bullish flag Breakout candle (october 2022 candle) low got tested....sign of bears strength
BULLISH VIEW
1. Overall it is in uptrend(making higher highs and higher lows)
2. Morning star pattern (www.tradingview.com)
3. DAILY time frame Inverted H&S pattern given Breakout
4. April 2023 candle looks like a breakout candle (volume only concern)
Let's wait and watch whether it is bulls or bears turn !!!!
NOTE- Just Sharing my view....not a tip nor advice!!!!
- mmjimm

UPL Bearish way ahead ??!!!!Chart patterns convincing me to publish this above titled opinion
REASONS
1. UPL has been trading inside an Expanding Triangle pattern(10 year- from 2013) taking support and resistance at perfect levels till now.
2. Currently it is under the down swing move inside the pattern
3. Pink trendline from 2020 acting as support, Bears trying to get break that trendline ( June 2022 (1st time), Oct 2022(2nd try), now Dec 2022(3rd try)).
4. During the june 2022 and oct 2022, weekly candle broke that line(with wicks), but low didn't get tested and bulls took charge.
5. But, now the Breakdown candle(19 dec weekly candle) is more alike BEARISH MARUBOZU candle with LOW TESTED!!!!
6. This may be a sign of Bearish way ahead!!
7. In the Daily time frame, its been travelling in a channel pattern and respecting it too and currently an inverted cup & handle like pattern too formed in verge of a Breakdown!!(shown below)
8. It is better to not to Go long even if you don't short now!!!
9 . Strong day close above the 775 will pave way for weakness in Bears approach!!
If the stock goes as per levels shown, fib 0.382 , 0.5 can be the Target levels ahead!!
In the short term, we can have SL - day close above 738 and Target as 680
Let's wait and watch, how it is going to move!!!
Note - Just Sharing my view....not a tip nor advice!!!!
