Elliot wave -- S&P 500Technically S&P 500 has formed Elliot wave pattern.According to Elliot wave pattern ..Currently Correction Wave 'C' is in progress...So I expect price would drag down towards 2700 to 2650 levels once it breaks below the 2930 levels on daily closing basis ...
Search in ideas for "ELLIOT"


Nifty - Elliot Wave Update So, thankfully we have been aligning are views with the market and reviewing counts at the right time. Lucky much? :)
On May 2nd - We caught the top, when the breakout didn't look convincing
We got a good correction (Correction was even better in stocks) and booked out at around 24k on May 9th, and changed views, again as the fall wasn't as bad as it was expected after the end of 5th. Hence, it made sense to expect a 5th up.
This change in view helped us ride a good move of +1000 points in Nifty and multiple +10% moves in stocks (crazy moves there).
Now, while the view shared on May 9th still remains valid, there's an even more bullish view possible.
Ideally, I should have waited for more clarity, but thought that someone shouldn't book out of positions, if it's actually that.
So, there are two scenarios:
1. We are in 5th up/ which got done, is about to be done. In this case we head down to 23500 or so and then we review if this bounce was corrective or we are going to ATH.
2. We did 1 and 2 and have started 3 up. Within 3 we started the 3rd up today. If this is true, the run up should continue for next few days.
How to decide, I am keeping 61.8% of today's move as a deciding factor. So, if we come back to 24700, I'll be out of longs - will even book cash trades and wait for clarity to re-enter.
P.S.: You must be wondering, what the two Orange circles denote - Well they are for reminding me that this price action can be a trap, as it has happened in past. :D
Though looking at set-ups in stocks and the way they are moving after clearly defining a base - I am quite confident that the low has been made for this correction.
As usual, important to track closely and be nimble to change the view and humble to accept mistakes :)
All the best!
NIFTY Elliott Wave Analysis - Long Term targetAfter taking a strong run-up from COVID swing low, Nifty corrected 18% from Oct 2021 till June 22. The correction also followed Elliott Wave principles of the 5 main waves.
From June 2022, a larger Elliott Wave is in progress with Wave 3 lasting almost 1.5 years, from March 2023 till Sep 2024.
Wave 5 targets can take Nifty above 30k, before we see another major correction that can bring it down to 20k levels.
This timeline coincides with the famous Samuel Benner's Market Cycle theory, which states 2026 as a "year of good times, high prices and right time to sell stocks".
medium.com

NIFTY analysis based on Elliott Wave theoryNIFTY is looking like in wave (Z).
Now, wave (Z) is always in 3 moves (ABC).
If we take a look in 75 min chart of NIFTY, we may see wave (a) of wave (Z) finished on 12 Feb. The price is in wave B of wave (b) now.
It looks like Zig-zag pattern is forming and it is observed most of the times that, Wave B of Zig-zag takes at least equal time of wave A.
So we may assume that, wave (b) of Zig-zag will finish at least by 19 Feb near 50% to 61.8% And then we may expect a fall to form wave (c) of Zig-zag.
This analysis is based on Elliott Wave theory and Fibonacci.
This analysis is for educational purpose only.

ELLIOT WAVE ON NMDC - LONG13% RETURNS TARGET FOR NMDC ELLIOT WAVE.
Can BUY at CMP-267 and book profit till 290-300
SL at 246-250
Disclosure - I am not a SEBI registered analyst. Information provided here is only for educational purposes. I will not be responsible for any of your profit/loss.


AUD/USD Elliott Wave BreakdownPrice rejected beautifully near the end of Wave 2 — is Wave 3 underway?No indicators. Just pure Elliott Wave + Price Action sniper logic.
How to turns $200 to $10k Join my channel
#AUDUSD #ElliottWave #ForexTrading #WaveAnalysis #SniperEntry #PriceActionTrading #Wave3Loading #FxSniper #RamkiStyle #ChartAnalysis #ForexShorts #TradingMindset #SupplyZone #WaveCount #SniperWave

"Classic Elliott Wave in Action – Nifty Headed to 23,250?"📉 NIFTY 50 Elliott Wave Update – July 29, 2025
🌀 Classic 5-Wave Impulse Completed at 25675
✅ Wave 1 to 5 marked a strong bullish rally from 21700 to 25675.
📌 Now unfolding an ABC corrective pattern.
Wave (a) down ✅
Wave (b) bounce underway or done 🔁
Wave (c) may drag us down to target 23250
📊 Volume shows distribution
⚠️ Short-term bearish pressure likely before next major move.
🧠 Trade with patience. Let the correction complete.
Next impulse wave may offer high reward setups after Wave (C) completes.
#Nifty50 #ElliottWave #TradingView #SniperWave #StockMarketIndia #WaveAnalysis

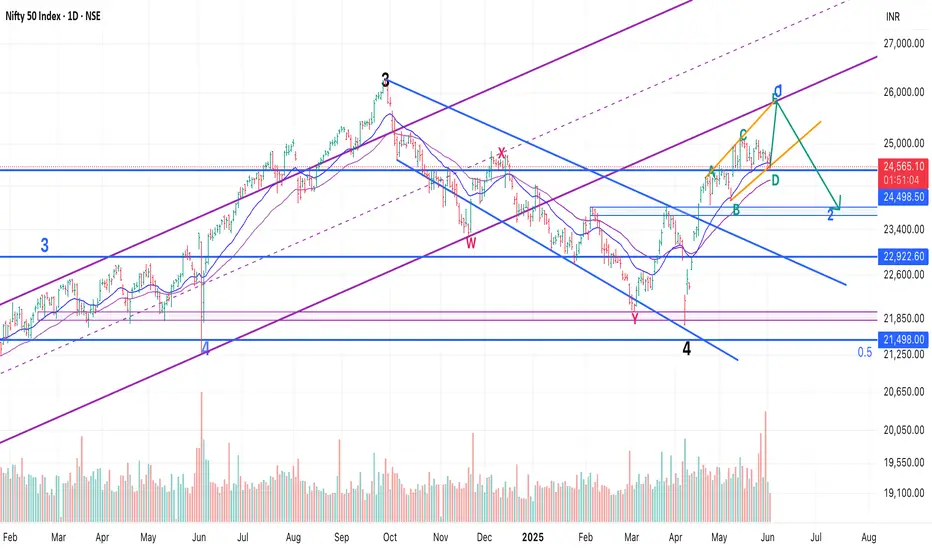
Nifty - Elliot Wave - Update - Stay long till proven otherwise!Our view that at least one more leg up was pending has held out well.
View shared here:
Now, Since it took longer in consolidation, I am open to considering that we did a sideways 2 and are heading up in 3.
Crossing 25700 will invalidate LD and hence increase probability that 3 up has started.
P.S.: If we are actually in 3, then 28k - 30k possible in this year. So, hold on :)

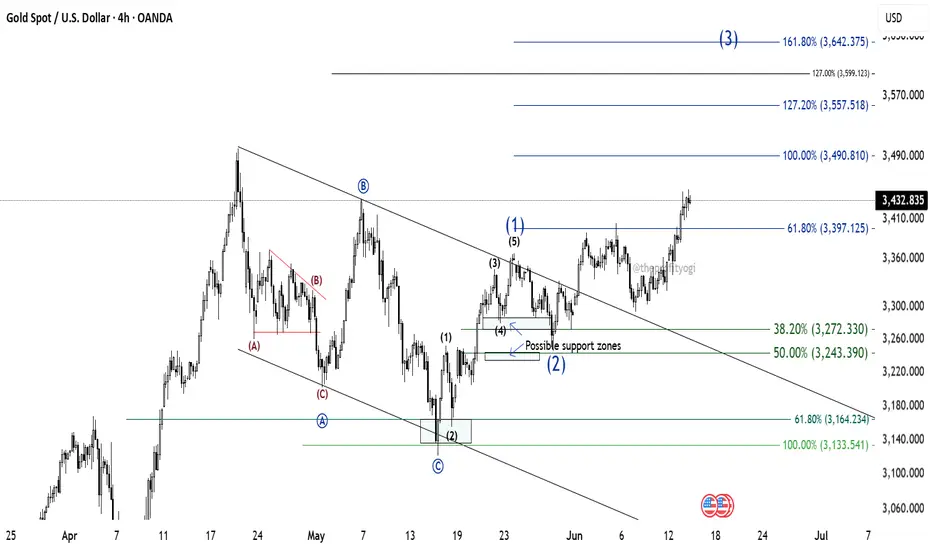
GOLD: Further levels using Elliott Wave TheoryWe successfully forecasted the path of gold in our post on May 12th.
Now, GOLD is looking like it's entering an impulse wave.
Wave (1) of this impulse was completed on 23rd May. The price then falls between the zone 38.2% and 50% to form wave (2). This was also predicted by us.
Currently, GOLD is in wave (3).
Now, to get the targets of wave (3), we have two possibilities.
1. Wave (3) goes to 100% and then reverses. This case is of the Terminal impulse. And the further path of GOLD can be predicted later.
2. Wave (3) goes to 161.8% (minimum). This is the case of Trending or normal impulse. And further path of GOLD can be predicted accordingly.
For now, GOLD is looking like going to touch at least the 100% (3490.81) level.
This analysis is based on Elliott Wave theory and Fibonacci.
This analysis is for educational purposes only.
This is not any buying recommendations.
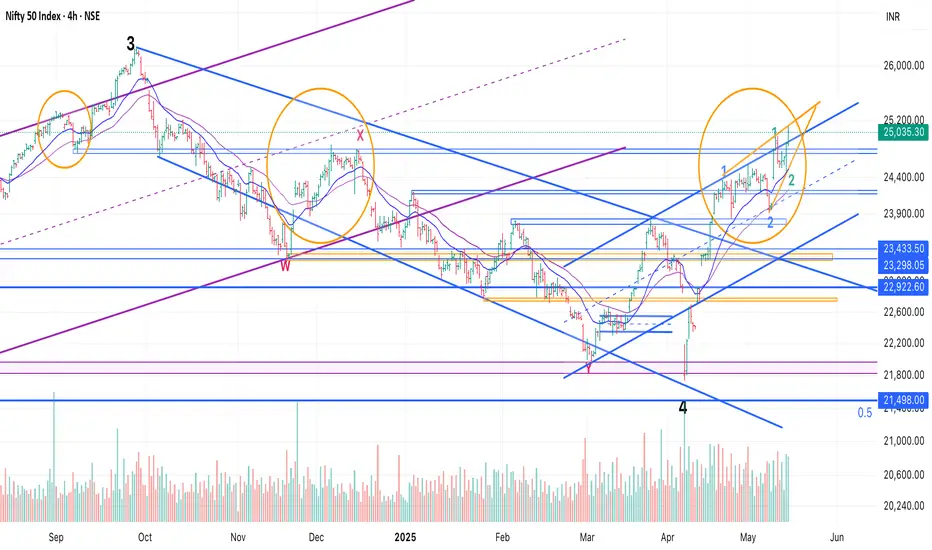
Nifty - Elliot Wave UpdateNifty has been testing patience and not letting anyone take positional trades since mid of May.
24500 has acted as a crucial support - and as we come to re-test it today for the 3rd time, I thought of updating the view after my last post on May 15th, as we have a good RR long trade here.
We had two alternates:
1. We are in 5th up/ which got done, is about to be done. In this case we head down to 23500 or so and then we review if this bounce was corrective or we are going to ATH.
2. We did 1 and 2 and have started 3 up. Within 3 we started the 3rd up today. If this is true, the run up should continue for next few days.
Now, possibility 2 remains as it is, but possibility 1 has changed to look like a leading diagonal.
So, instead of 12345 (where 1 and 4 cannot overlap), we are moving up in ABCDE (where A and D can overlap).
My view is that we have E up pending - and since we have taken so much time in D, more room is getting opened in E up (top of the wedge structure) - which was 25300 earlier, and is now looking at around 25700 - which is a good 1200 points from here.
This move up will also test the bottom of the longer channel we followed from March 2023 and broke in Jan 2025. So, a first test of that channel would mark as a good point for wave 1 to end and a correction to begin till 24000-23800.
24500 breaking and sustaining should act as SL. So, we have a good trade set-up at hand to play till 25500 or 5 wave up, whichever happens first
All the best!
GBP/USD Elliott Wave Update – May 27, 2025📉 GBP/USD Elliott Wave Update – May 27, 2025 📉
After completing a 5-wave impulsive structure from the 1.27 low, GBP/USD is showing signs of exhaustion near 1.36–1.37.
🔻 A corrective decline is anticipated:
38.2% retracement: ~1.33 zone
61.8% retracement: ~1.3050–1.31 zone
Major support rests at the previous Wave (ii) low near 1.27
Volume peaked during Wave (iii), but has shown divergence during Wave (v) — classic signal of a potential top.
📊 If this is Wave (v) of a larger impulsive move, expect a deep Wave (2) or (B) correction before resumption.
⚠️ Watch for rejection and reversal signals around 1.36–1.37. Pullback could offer a high-probability long opportunity from the 1.30–1.31 area, aligning with 61.8% Fibonacci retracement.
#Forex #GBPUSD #ElliottWave #TradingStrategy #TechnicalAnalysis #WaveTheory #FX

SPX/ NDX/ DJI - Elliot Wave - Change in CountsI have expected May 8th as the top of the pullback in this post:
However, it seems that there were more legs pending.
View still remains that this is a counter trend rally, and we will eventually head down again.
We are in 3rd of C and we will get another move up in 5th, which should mark the end of the entire leg up.
If I am invested in US markets - I would use this rally to book profits!
View is similar in Nasdaq and DJI, so not sharing those charts again. :)
All the best!

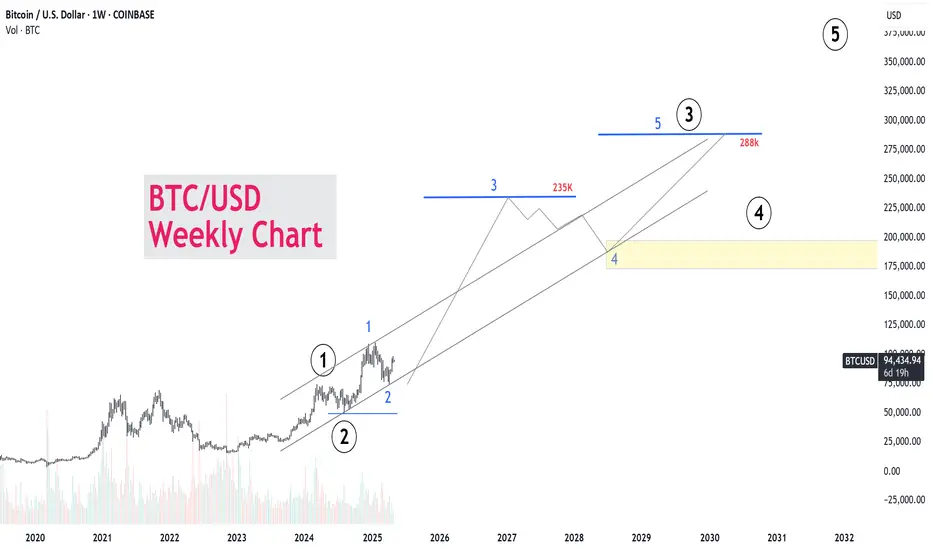
“Bitcoin Weekly Elliott Wave Analysis: Wave 3 Targeting $235K”📈 BTC/USD Weekly Elliott Wave Outlook
🗓️ Chart Published: May 5, 2025
💰 Current Price: $94,359
🚨 Wave 3 Has Begun — Long-Term Bullish Outlook
According to the Elliott Wave count on this weekly chart:
1️⃣ Wave 1 (2023–2024) is complete.
2️⃣ Wave 2 (a deep correction) successfully held support at the channel base.
3️⃣ Wave 3 is now unfolding and could reach between $235K and $288K — potentially a +215% rally from the current price.
4️⃣ Wave 4 correction expected in the $175K–$200K zone around 2029.
5️⃣ Wave 5 could take BTC beyond $300K+ in early 2030s.
📊 This is a macro impulse structure, where Wave 3 is historically the strongest. Price is trending well within the long-term ascending channel, giving confidence in a multi-year bull trend.
📍 Key Levels to Watch:
Wave 3 targets: $235,000–$288,000
Wave 4 correction zone: $175,000–$200,000
Final wave 5: To be projected post-Wave 4
📚 "Patience is profit." We're early in Wave 3 — the biggest opportunity for high R:R setups.
📎 #Bitcoin #ElliottWave #BTCUSD #CryptoForecast #TechnicalAnalysis #Wave3 #MacroTrend #BTCto250K #CryptoBullRun #TradingView #BTC2030
Dominion Energy (D) – Elliott Wave Analysis and Trading PlanHere's a draft for a blog post on your Dominion Energy analysis:
# Dominion Energy (D) – Elliott Wave Analysis and Trading Plan
In this post, I’ll share my Elliott Wave analysis for Dominion Energy, Inc. (ticker: D), outlining a potential buy opportunity based on the structure of the wave patterns. As the energy sector evolves, Dominion Energy presents a technical setup that could provide solid upside potential.
**Chart Overview**
On the daily chart, Dominion Energy is forming what appears to be an Elliott Wave structure, providing clear entry zones and targets for a potential bullish reversal.
#**Wave Structure Breakdown**
1. **Wave (b) - Completion of Downtrend**
Dominion Energy experienced a significant decline, reaching what appears to be the completion of a corrective wave labeled as (b) on the chart. Following this wave, the price has shown signs of a bullish impulse, suggesting a possible trend reversal.
2. **Wave (c) - Establishing a Base**
The downtrend continued into wave (c), where the stock likely found a strong support level. This phase could indicate the end of the broader corrective wave, setting up the stock for a potential upward movement.
3. **Wave (i), (ii), and (iii) - Impulsive Movements**
After wave (c), we see a series of impulsive waves labeled (i), (ii), and (iii). These waves mark the early stages of a potential new bullish trend. Wave (iii) suggests strong bullish sentiment, while wave (ii) represents a healthy retracement often seen in an Elliott Wave setup.
4. **Current Setup: Wave (iv) Retracement**
As wave (iv) retraces, there’s an opportunity to buy as the price pulls back into a key support zone. I’ve identified two potential entry levels:
- **Starting Buy Level:** $57.79
- **Secondary Buy Level:** $54.89 (if the price dips further)
This yellow zone marks an ideal area to start accumulating a position, anticipating a move up in wave (v).
### **Why Buy Dominion Energy Now?**
Dominion Energy’s technical structure aligns well with the Elliott Wave framework, providing a clear risk-to-reward setup. Here’s why this trade looks promising:
- **Wave (v) Target:** If the wave count is accurate, we could see the price push significantly higher as it completes wave (v), targeting the $70–$75 range in 2025.
- **Strong Support Levels:** The identified buy zones around $57.79 and $54.89 offer strong support, limiting downside risk.
- **Energy Sector Strength:** As the global economy adapts to energy shifts, companies like Dominion Energy are positioned to benefit, especially as they invest in infrastructure and alternative energy solutions.
### **Trading Plan**
Here’s how I plan to execute this trade:
1. **Enter Initial Position:** Start buying at $57.79.
2. **Add to Position if Dips Further:** If the price moves down to $54.89, I'll add to the position.
3. **Set Target for Wave (v):** Looking for the stock to reach around $70–$75 as the final wave (v) unfolds.
### **Risk Management**
As with all trades, risk management is key. I’ll monitor price action closely and reassess if the structure invalidates the Elliott Wave count or if the price breaks below significant support levels.
---
#### **Conclusion**
Dominion Energy is presenting a compelling setup based on Elliott Wave analysis, with a clear path forward for a potential bullish move. By entering at key levels, I aim to capture the upcoming wave (v) and ride the trend as the stock moves higher.
As always, this analysis is for informational purposes. Please conduct your own research or consult a financial advisor before making any trading decisions.
Happy trading! 📈
---
Let me know if you’d like to tweak any part of this!

USD/CAD Elliottwave I’ve mapped out an Elliott Wave structure for USDCAD on the 2-hour chart. Currently, the pair is progressing through the wave sequence, and I’m anticipating a final push to complete the 5th wave around the 1.4160 level.
🔹 Key Levels to Watch:
Potential retracement zones for waves 3 and 4 are highlighted, which could present good opportunities for those looking to enter or add positions.
This chart is free for everyone—feel free to use it as part of your trading plan! 🙌
If you find value in my analysis and would like to show some gratitude, consider supporting via Your support helps me keep sharing insights like these with the community!
#Forex #ElliottWave #USDCAD #TechnicalAnalysis #Trading

HDFC Elliott Wave Analysis - Weekly AnalysisHello Fellow Traders,
I started learning Elliott Wave Analysis with online free tutorials.
I could able to draw based on rules I learned and wanted to put in public to correct and learn my mistakes.
Last leg of irregular ABC is in progress and it will be end before 2618 and I feel next WAVE will be fast.

BALUSDT can bounce on Elliot wave CBALUSDT can bounce on Elliot wave C or on 4hr orderblock BINANCE:BALUSDT.P

JK Paper: In Elliot Collective WaveWe are looking into long term trend of J K paper in weekly timeframe with the help of Elliot Wave and Fib.
Here are our observations:
We are actually in the corrective A,B,C phase of wave formation.
The recent move of around 365 to 400+ is the wave-B of corrective wave-A,B,C.
The major corrective wave-C may be extended upto the 61.8% (Golden Ratio) of Fin retracement (which is around 300).

CRUID OIL ELLIOTT WAVE ANALYSIS 22.2.21BUY 58 TO 56.589
TARGET 71
Reason For Buying This Script :
In weekly frame it is forming the Elliott wave it is having good potential to move upward. so we can go for buy.
Now it is in correction mode . Use this opportunity and buy at this levels 58 to 56.589.
once it cross 71 and close above 71 in weekly time frame means next target up to 87 .
Note :
Above given levels are based on weekly time frame . It will take some days to achieve the target, So be patience.
Above given target are in USD .
All the best ...

SBI in a flat correction - Elliott Wave TheoryI have applied the Elliott Wave Pattern. The third wave is including a contracting triangle, and the fifth wave is including an ending triangle. Hence, the State Bank of India's (SBIN) cycle of the corrective wave started after the fifth wave.
There are two scenarios if it crosses 61.8% , C will be around 205 , and if it does not crossover the retracement level of 61.8% , C will be at/nearby 195 . These levels are target prices for the day traders.

MCX Silver's Next Target 65200 by the Elliott WaveHere, I have applied Elliott wave , moving average , volume , and MACD . Wave 4 can be steady or sideways for a while. Overall, silver is in an uptrend. Safe investors can buy silver at wave 4 for the following levels:
Intraday Targets: 62100 - 63300
Positional Targets: 64260 - 65200
At present, moving average and MACD throwing upward signal by crossover. Technically, multiple volume spikes are a great sign of a bullish trend.
