Nifty = SELL signal continuing on 9/34 EMAs on Index and RSIThough certain traders or investors are still finding it difficult to digest, such a fall due to a fatal virus, that has caused only a few casualties and infections outside of China.
I guess the sooner we come to terms with this, the better it will be.
On very reliable 9/34 EMAs on Index and RSI System, Nifty as well as Bank Nifty are running in SELL Since Jan 30th, the post budget recovery rally has shifted it into consolidation phase for a brief period, but with the recent fall has made it give a sell signal again on Feb 14th.
CAUTIOUS approach is a must guys, though Corona is not looking that serious at this stage, but we have seen many times in the past - markets do move ahead of times .
I am saying this because almost all major markets of the world have turned bearish in the past few days. Commodity markets are moving in tandem.
This may not be an overaction, may be the financial markets are sensing something, that is not known to us.
Following technical signals is so important.
Search in ideas for "EMA"


89 EMA Band89 EMA Band is plotted using the high and low of the 89 EMA. It is also called as Magic Band. Price above the band would be considered an uptrend and vice versa. Most of the times it would act as Resistance or support. It can be used as a reference but not for decision making. If you find price reverse from the band, correlate with other indicators to identify the targets.

SHORT-TERM TRADE IN BANKNIFTY F&0SHORT-TERM TRADE IN BANKNIFTY
VIEW:-
INDEX IS HOLDING ITS 21-BAR EMA ON HOURLY CHART
THIS SHOWS STRENGTH IN UP-TREND
TRADE IN BANKNIFTY 28TH FUTURE CONTRACT
LEVELS ARE ACCORDING TO SPOTS PLEASE ADJUST FOR FUTURES
BUY @30300
STOP @30200
TARGET 1@30450
TARGET 2@30550
TRADE IN OPTIONS
30500 14TH NOV CONTRACT CALL OPTION
BUY @330
STOP @260
TARGET 1@500
TARGET 2@600
LOT:20
QTY:15

Nifty - Over 100 points gone since EMA on RSI gave SELL signal.The correction or consolidation continues, Nifty is looking a little more weak on charts.
Today's low has been the lowest level since Oct. 17th, but Nifty did recover towards the end and managed to close exactly on the Trendline connecting previous highs since June.
Value of RSI on daily chart is well above 50, but on our tried and tested 9 EMA on 21 RSI system, it is still in SELL mode , friends who have been following me for some time must have noticed this very system giving timely BUY / SELL or Enter / Exit signals for some time.
I would advise,
initiating longs only when this system gives BUY signal,
taking small trades on the short side (mainly options) till then, &
take positional shorts only if and when RSI and other indicators confirm further weakness.
---------------------------------------------------------------------------------------------------------------------------------------------------
This post is not an advice to speculate using leveraged products, one must thoroughly understand the financial implications involved, consult some financial advisor before taking any positions.
----------------------------------------------------------------------------------------------------------------------------------------------------
Please consider hitting the LIKE button below the chart, if you find this post / idea worthy or informative. You may also FOLLOW me over this forum for periodic updates on Nifty and Bank Nifty.
Please add a comment... Positive feedback and constructive criticism are important to authors as well as the community.

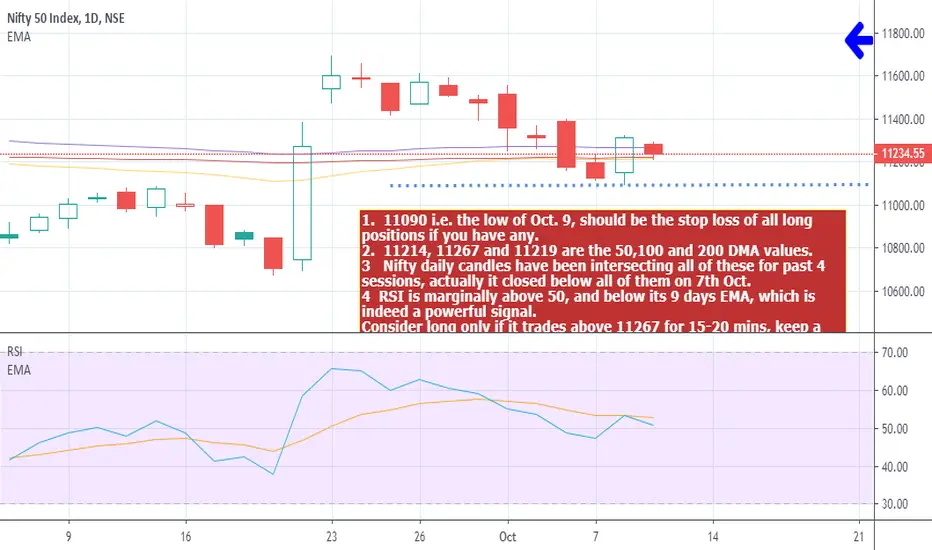
NIFTY trend using 50, 100 & 200 Days' EMAs and other indicators 1. 11214, 11267 and 11219 are the 50,100 and 200 DMA values.
2. Nifty daily candles have been intersecting or closing below these values for past four sessions.
3. RSI is just a tad above 50, but well below its nine days EMA, which is indeed a powerful signal.
4. Most other indicators too are on the verge of giving buy or sell signals.
5. Bank Nifty is looking weaker i.e. clearer SELL on most indicators. Nifty may not be able to outperform Bank Nifty for long.
6. 11090 i.e. the low of Oct. 9, should be the ultimate stop loss of all long positions, similarly 11315, high of Oct. 9, can be the stoploss for all Short positions.
Consider long only if it trades above 11267 for 15-20 mins, keeping a stop loss at 11210.
Short if it trades below 11210 for some time, with a stop loss of 11267.
Consider covering all shorts around 11090-11100 levels. Beyond technicals, assumption is 11050-11100 is strong support area, it is wise to book profit on short trades around these levels and wait for clarity.
Repeating decisive breach of 11315 or 11090 will confirm further strength or weakness of the market.
Please hit agree or like for this post / idea, if you find it worthy. You may consider FOLLOWING me, for periodic updates on Nifty, Bank Nifty.
GAP TO TRADE ?200 EMA HOURLY RESISTANCE.
IF NIFTY ENTERS THE GAP IT WILL FILL THE GAP WITH RESISTANCE AT 11020.
IT WILL A SIMPLE TRADE.
VIEW ON NIFTY MIGHT BE LONG IF HEALTHY BREAKOUT GIVEN OF 200 EMA.

Concor Retracemenet @ 38% with 50 EMA Resistance.Concor - After having a fall, retraced back to 500 Levels which 38% retracement. Also 50 EMA is @ 500 levels on daily charts. If not able to cross these hurdles we can see price @ 460-480 levels again.

Approacing Peak trend line with 20 EMA price-Watch 4 year Trend # Watch 4 year 20 EMA Trend touching Max Trendline.
# Wait for breakout or possible downtrend or consolidation @730

A GAP TO TRADE. Nifty's budget action NIFTY has closing in gap which was made during pre budget rally. We have the opportunity to trade the GAP setting 11400 has first tgt and support of 200 EMA has 2 tgt. Make your positions according to your target.
Happy trading


TCS EMA 50TCS is following 50 day EMA recently and its bounced back from it too.
Please like the idea if you agreed, comment bellow if you want to add anything.

MARUTI INVESTMENT PICK TRADING ABOVE 200 SMA AND EMALooking at Maruti Suzuki India Ltd chart for 8-9 month time horizon we have found it bullish from lower level. Its taking strong support of 200 SMA & EMA. Buying can be initiate in the rang of 6700-6720
INVESTMENT RATIONALE:
TECHNICAL ANALYSIS
1) RSI showing buying single
2) Trading above 200 SMA & EMA
3) Trading with good volume
FUNDAMENTAL ANALYSIS
1) Company has reduced debt
2) Company is virtually debt free.
3)Company has good consistent profit growth of 24.90% over 5 years
4)Company has been maintaining a healthy dividend payout of 27.27%
Open to discus:
If you have any views please share
HAPPY INVESTING

Positive signal from EMA and ADR. Buy now and stay for 1 day.Positive signal from EMA and ADR. Buy now and stay for 1 day. Expected profit >1%

Tata motors crossed 200 EMAFor Educational purpose only. Tata motors today closed above 200 EMA and has come out of a long consolidating channel.

IRB - a perfect crossover of 8, 13 and 21 EMA (BUY)Buy only if it crosses above 131.5
TGT 1 - 137
TGT 2 - 144
SL - 122
The move is also supported by the increase in volume
Once the stock crosses above 55 EMA, a huge move can be expected


long above break of both 50 & 200 EMA go long only if price closes above 50 and 200 EMA and also by seeing price action it looks like head and shoulder pattern is forming confirms only on close of above 161.long above 143 with stoploss of 136 and targets of 159 and if breaks 163 then 175/185/205.

AMARAJABAT - Near 30 D EMA Support - WatchAmarajbat is at 30 day EMA, whereas the TL support is around 820-830 levels. Need to wait and watch how it behaves. The Auto stocks will be in focus on monday(03rd Sept) due to sales numbers that released on Saturday. Close Watch on this scrip.


ZEEL Chart Observation with Mutli EMANSE:ZEEL has historical taken support at WEEKLY 100 EMA and rebound from lows. This time again its trying to take the support at 100 WEMA
Closing above 100 WEMA will gain start the upswing till resistance zone are 590-600


