REFEX - Swing TradeBuy Zone - above 560
Up side - Upto 760
Weakness - Below 520
Pattern: VCP
EMA's : EMA 10 > EMA 21 > EMA 50 > EMA 150 > EMA 200.
Price Up by 80% before consolidation
6 Week Long consolidation
Search in ideas for "EMA"

KECL - Swing TradeEntry: 132
Target: 155
SL: 124.5
Pattern: VCP BO and retest completed
EMA's : EMA 10 > EMA 21 > EMA 50 > EMA 150 > EMA 200.

SAFARI INDUSTRIES - Flag BOEntry: above 3090
Target: 3670
SL: 2930
Pattern: FLAG & POLE
EMA's : EMA 10 > EMA 21 > EMA 50 > EMA 150 > EMA 200.
Flag: Price breaking out from 5 week long Flag pattern.
Pole: Price Up by 25% before forming Flag pattern.

JAI BALAJI - Swing TradeEntry: 80.1
Target: 99
SL: 75.5
EMA's : EMA 10 > EMA 21 > EMA 50 > EMA 150 > EMA 200.
Price moved up about 90% + and consolidated for & weeks.

ISMTLTD - Swing tradeEntry: 81
Target: 88.5
SL: 76.2
Pattern: VCP
EMA's : EMA 10 > EMA 21 > EMA 50 > EMA 150 > EMA 200.
Base: Price breaking out from 3 month base.
Retest: Price retesting BO level with decreasing volumes.

KERNEX - Swing tradeNSE:KERNEX
Entry: 345
Target: 430
SL: 315
EMA's : EMA 10 > EMA 21 > EMA 50 > EMA 150 > EMA 200.
Base: Price breaking out from 6 month base.
Retest: Price retested BO level with decreasing volumes.

VIMTALABS - SWING TRADEEntry - 415
Target - 475
SL - 397.5
Price retraced to EMA 10 & resuming Upmove
EMA 10 > EMA 21 > EMA 50 > EMA 150 > EMA 200

Schaff Trend Cycle (STC) : Everything you need to knowEver felt curious about the forces that shape market movements? Let us introduce you to the Schaff Trend cycle, a user-friendly tool designed to reveal the market's natural ups and downs.
Created by Doug Schaff in the 1990s, this helpful indicator is built on the idea that market trends follow repeating patterns of highs and lows or cycles.
Imagine the Schaff Trend Cycle as a blend of the popular Moving Average Convergence Divergence (MACD) line combined with a modified algorithm and smoothed out for easier interpretation.
This powerful mix allows traders to see the direction of a trend cycle and identify the likely high and low points within it. This way, you can spot the best moments to enter or exit trades, helping you to make the most of your investments.
How to Calculate the Schaff Trend Cycle?
The formula of Schaff and Trend Cycle is:
- Schaff and Trend Cycle = 100 x (MACD – %K (MACD) / (%D (MACD) – %K (MACD)
- The Schaff Trend Cycle (STC) indicator is calculated in three steps as follows:
Step 1: Calculation of the MACD
Calculate the 23-period Exponential Moving Average (EMA) of the price's midpoint (i.e., the average of the high and low prices).
Calculate the 50-period EMA of the price's midpoint.
Subtract the 23-period EMA from the 50-period EMA to get the MACD
Step 2: Calculation of the MACD signal
Calculate the 10-period EMA of the MACD calculated in step 1.
Step 3: Calculation of the Schaff Trend Cycle
Calculate the Schaff Trend Cycle (STC) by subtracting the 10-period EMA of the MACD signal calculated in step 2 from the MACD itself.
Multiply the result by a constant factor of 0.5, add 0.5 to the result, and multiply the final value by 100.
The resulting STC value oscillates between 0 and 100, with values above 50 indicating a bullish trend and values below 50 indicating a bearish trend. Traders can use the STC indicator to identify trends, determine entry and exit points, and set stop-loss orders.
Interpreting the Schaff Trend Cycle Indicator
Looking to understand market trends and gain an edge in trading?
Let's dive into the Schaff Trend Cycle Indicator, a user-friendly tool that can help even beginners make sense of market ups and downs.
This indicator simplifies price movements and uses a line between 25 and 75 to give you insights into market trends.
Here's what you need to know about the Schaff Trend Cycle Indicator:
Crossing the 25 lines: When the indicator crosses above the 25 lines, it suggests that the market is in an uptrend.
Crossing the 75 lines: If the indicator crosses the 75 lines, it shows that the trend is gaining strength, whether it's going up or down.
Above 75 or below 25: When the indicator is above 75, it signals that the market is overbought, and when it's below 25, it indicates oversold conditions.
It is easier to make smarter decisions about when to buy or sell the market when you understand these signals. The Schaff Trend Cycle Indicator can be a great addition to your trading toolkit, helping you navigate the market with ease and confidence.
Above is an example of how the Shaff Trend Cycle indicator looks on the Adani Enterprises chart.
Conclusion
The Schaff Trend Cycle (STC) Indicator can be seen as a leading or lagging indicator, depending on one's perspective. Essentially, the STC aims to identify trends just before or as they occur, making it a potential leading indicator. However, the trading signals generated by the STC may sometimes be delayed, which also makes it a lagging indicator.
We hope you find this information helpful regarding the Schaff Trend Cycle Indicator. We usually post about trading and investing on blog.dhan.co (be sure to check it out).
Let us know what topic we should write about next.
Until then, happy trading!

FALLING KNIFE STORYHello guys here I am sharing the daily chart of Bajaj Finserv (THE GIANT) for why it falling down massively and giving one by one negative breakdowns on chart, So we can see after making a all time high touched to it's 20 day EMA taking support but gives a breakdown as closed below and started consolidation and taking support on 50 Day EMA but at the end gives another breakdown of 50 EMA and closed below after the same mentioned above it did same with 100 EMA and gives a final and major breakdown of below it's 200 EMA so by the example of this chart we can understand the behavior of falling stock no matter how good the stock is and how much strong fundamentals it is having as a part of trader we can easily avoid the setups like this one more thing by from this chart we can better understand the much importance of Moving Averages in trading because it's gonna keep us from getting trapped from a weak setup because in stocks what looks cheap is about to get more cheaper. Thank you Trading view for giving us such a wonderful platform like this from which we can share our view and idea to community maybe one can get help by this by chance #TRADINGVIEW
IMAGE WITHOUT EMA FOR BETTER READING

Nifty no brainer ideaWe are in modern world with access to history on our finger tips.
Look past data around 200 EMA, Nifty is exhibiting same pattern as shown in history.
In coming one two days, Nifty will come closer to 200 EMA but not touch it.
Use this time to invest. As we cannot 100% predict the market. We can use risk to reward in our favor.
Go to chartink to search shares above 200 EMA -->
( cash ( latest ema( latest close , 200 ) >= latest low and latest ema( latest close , 200 ) <= latest high ) )
Remember there is not perfect time to enter the market. According to me waiting for 18000 will be like letting the shares regain all there value.
If 200 EMA is broken and taken out by the next candle, we will need to respect the market and give our stop loss.
But if you are experienced trader you know thoda risk lene pe hi reward he.
I am not a SEBI registered trader. Only for education purpose. Consult your financial advisor before investing.

NIFTY view for 2 JAN 2023Nifty Strenghtening Support 1 - 18044, support 2 -17903, Strongest Support -17777
Nifty Strenghtening Resistance 1 - 18174, Resistance 2 - 18263, Strongest Resistance - 18323
MARKET RANGE - 17750 - 18350
EMA placement: 10 EMA - 18174, 20 EMA - 18256, 50 EMA - 18163, 100 EMA - 17861, 200 EMA - 17494
WORLD sentiments: Strong SELL.
Indicators : SELL.

What we see by analyzing the pharma index with 2 theories.Hey.. What do we get if we analyse one chart with two different theories ?
Is it a good idea ?
We use different techniques and methods to analyse a chart.
Some traders use chart patterns, some use moving averages and others use any other technique.
We all did the analysis to determine the trend of that instrument.
What if we use two different theories for the analysis ?
It will give us a more accurate view for that instrument.
Lets check the analysis Nifty Pharma Index Daily Chart by 2 different theories of Chart Patterns and Exponential Moving Averages.
Chart Pattern
A symmetrical triangle pattern appears on the chart.
And today we see the Breakdown of the pattern.
The breakdown of the pattern shows the weakness of the index.
Exponential Moving Averages
For this we use four exponential moving averages of 20, 50, 100 and 200 periods.
We start from the 20th of Jun 2022 when the price is below the all exponential moving averages.
From that day the price started its upward move and it crosses all ema's one by one
and finally it reached at 200ema on 5th of Aug 2022.
During the period of 3 months the all 4 ema's come close to each other.
But the price has failed to cross the 200 ema and it starts its downward move.
From 22nd of Aug 2022 the price tested its 20 ema and 50 ema but has failed to hold them.
Finally on the 16th of Sep 2022 the price closed with a big red candle.
The price traded below to all 4 ema's shows the weakness and start of a downtrend.
Conclusion:
From both theories we see the weakness in the pharma index.
So, the stocks of the sector show the bearish move in the coming days.
This explanation is for educational purposes.
My only intention is to share my style and techniques of analysis.
Thanks

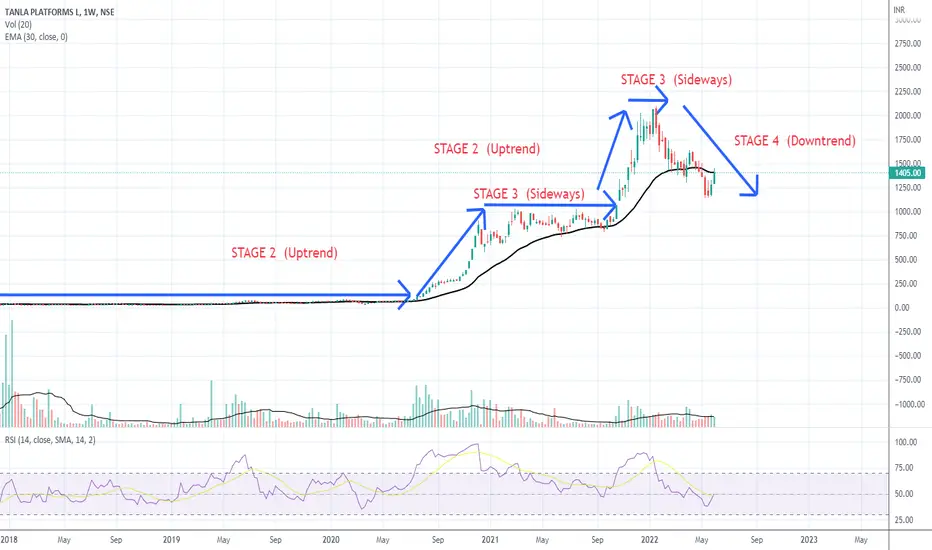
STAGE ANALYSIS of TANLA PLATFORMS CMP 1405
STAGE 1 : Accumulation Phase : TANLA Stock has been forming a Base Area for many Years approx. 11 years it has been in STAGE 1. The EMA 30 (Black Line) can be seen almost touching the Stock Prices for the Period of 11 years.
STAGE 2 : Uptrend (Ascending Phase) The Uptrend started in Mid 2020 during the Covid Period and the Stock started showing Signs of Bullishness and gave Multibagger Returns and Stock Price moved from Rs.100 to Rs.1000. The Stock Price can be seen Moving way about the EMA 30 Line and the Stock Gains Momentum.
STAGE 3 : ( Sideways Movement )The Stock loses its upward momentum and starts to trade sideways. There are an equal number of buyers, who are late to the party, and sellers, who are aware that it is time to Book some Profits. Volume is bit heavy and the Stock moves, up and down. The EMA-30 loses its upward momentum and starts to flatten out. The declines in stage 2 all held above the EMA 30, in Stage 3 the EMA 30 line is seen touching the Stock Prices a few times.
STAGE 2 & STAGE 3 Are Repeated and Stock Gains Momentum after the Sideways Trend (STAGE 2) and again Moves Upwards and Later moves Sideways (STAGE 3).
STAGE 4 : Downtrend (Descending Phase). This is a Time when there is Fatigue and Pressure on the Stock due to Fearful Sellers who think it is Better to take the Money off the Table now since it is showing Great Profits. The EMA 30 starts taking a Curve and starts flattening out and is about to Move Downwards. But there is no Guarantee, Stock Prices can Change their Direction any time due to Various Reasons which are beyond our control.
TANLA PLATFORMS Passed through STAGE 4 and now in STAGE 1STAGE 1 : Accumulation Phase : TANLA Stock has been forming a Base Area for many Years approx. 11 years it has been in STAGE 1. The EMA 30 (Black Line) can be seen almost touching the Stock Prices for the Period of 11 years.
STAGE 2 : Uptrend (Ascending Phase) The Uptrend started in Mid 2020 during the Covid Period and the Stock started showing Signs of Bullishness and gave Multibagger Returns and Stock Price moved from Rs.100 to Rs.1000. The Stock Price can be seen Moving way about the EMA 30 Line and the Stock Gains Momentum.
STAGE 3 : The Stock loses its upward momentum and starts to trade sideways. There are an equal number of buyers, who are late to the party, and sellers, who are aware that it is time to Book some Profits. Volume is bit heavy and the Stock moves, up and down. The EMA-30 loses its upward momentum and starts to flatten out. The declines in stage 2 all held above the EMA 30, in Stage 3 the EMA 30 line is seen touching the Stock Prices a few times.
STAGE 2 & STAGE 3 Are Repeated and Stock Gains Momentum after the Sideways Trend (STAGE 2) and again Moves Upwards and Later moves Sideways (STAGE 3).
STAGE 4 : Downtrend (Descending Phase). This is a Time when there is Fatigue and Pressure on the Stock due to Fearful Sellers who think it is Better to take the Money off the Table now since it is showing Great Profits. The EMA 30 starts taking a Curve and starts flattening out and is about to Move Downwards. But there is no Guarantee, Stock Prices can Change their Direction any time due to Various Reasons which are beyond our control.

HDFC bank longTranche 1 - 53 @ 1513 on 8 April
1. Market is in what stage - Identified by what kind of highs and lows that are being formed + movement of price w.r.t 21, 50 and 200 EMA
Price bottomed at 1297... did an inverse head and shoulders and broke out of 200 EMA daily to top out at 1715 and then retracing to 200 EMA at 1500... this was because HDFC bank and HDFc merged
2. Is there any trend reversal in play?
1. Multiple divergence confirmations on MACD , RSI and MFI - Price broke out... now consolidating
2. At important support or resistance - horizontal - Yes 1500 at stable 200 EMA daily line
3. At important confluence of EMAs + price + support - Yes - 200 daily
3. How are the candlesticks behaving and what is the volume doing
Huge volume candle and price candle on 1300 to 1500 range... also biggest merger.. will buy more if the price comes down
4. Is there any trend continuation in play?
Looks like uptrend will continue... price should bounce upwards from 200 EMA daily
5. Is there any pullback or breakout in play with volume confirmation from a strong horizontal level (support or resistance)
No pullbacks or breakouts as of now
6. Fundamental factors in play
1. Revenue growth - EPS vs PE ratio - last 5 years comparison - EPS rising Quarterly and Yearly... because of better sales... OPMs consistent... also PE ratio to EPS is very very attractive since 2017
2. Are institutional investors/promotors increasing their stake - Stake consistent in owners and institutional... big dip in retail and big pick by DIIs

ITC - Still looks bearish in 1d,1w & 1month chartITC chart still looks in bearish mode..buying will not be a good idea. It will test the support levels at 159 & around 140-136.
Previously, it had bounced upside from 159 level on 12th May (1d chart) it will most probably test that level before going upside.
If it moves further down below 159 level then it will test support range of 140-135. Till then keep an observation..
Also, once it breaks 20 EMA upside, one can think of buying as it moved upward on 20th May (1D chart) but it will face resistance at 50 ema and 200 ema above like it faced on 20th April at 50 ema & 200 ema on 3rd July & 11th Aug.
On a safer side for a long term, it would be better to wait till it breaks 200 ema and buying above 206.
*This view is based on my technical analysis and is for educational purpose only. Please feel free to discuss if I'm wrong somewhere.

BANK NIFTY FUTURE FOR NOVEMBERBNF FOR NOVEMBER ...... ( NEUTRAL TO BIAS ON SHORT SIDE)
5 EMA CROSSED BELOW 20 EMA ON AN HOURLY BASIS INDICATING SOME WEAKNESS FOR THE INDICE. WE HAVE 50 EMA BELOW THIS AND AT THE BOTTOM IS THE 200 EMA. SHOULD BNF TAKE SUPPORT AT 50 EMA, IT WOULD STILL NOT BE A CARRY TRADE AS IT WILL THEN HAVE TO CROSS OVER 5 AND 20 ON THE UPSIDE. MOREOVER, FOR ANY BULLISHNESS TO RETURN, IT IS NECESSARY THAT 5 EMA CROSSES ABOVE 20 EMA AND HOLDS ABOVE IT . MARKET SEEMS TO BE IN A CONSOLIDATION MODE WITH THE US ELECTIONS APPROACHING. ALTOUGH FIIS HAVE BEEN BUYING IN CASH FOR THE LAST WEEK OR SO, THEY HAVE BEEN INCREASING THEIR PUTT OPTIONS CONSTANTLY. DIIS HAVE BEEN CONSTANT SELLERS IN THE MARKET, WHILE RETAILERS HAVE BEEN GOING MORE LONG THAN SHORT.
RELIANCE ON THE OTHER HAND SEEMS TO BE STILL SHOWING WEAKNESS . ALTOUGH THE MARKET HAS NOT REACTED TO RELIANCE FROM 2300 APPRX HIGHS TO 2000 CURRENTLY, I THINK THIS LAST WAVE OF C OF 2 OF 5, SHOULD COMPLETE ITSELF BEFORE WE START WAVE 3 UP. IT IS TOUGH TO TAKE A FIRM STAND CURRENTLY REGARDING C OF 2 OF 5, AS THE MARKET IS NEITHER GOING UP NOR DOWN.
FOR ME PERSONALLY, I WAS LOOKING FOR A CLOSE ON NIFTY BELOW 11930 YESTERDAY FOR WEAKNESS..... IT CLOSED AT 11930.60.
FROM A PERSONELL POINT OF VIEW, I AM OF THE OPINION THAT MARKET WILL COMPLETE C OF 2 OF 5, BEFORE HEADING UP, BUT I HAVE TO ADMITT IN ALL ERNEST.... THAT THE MARKET CAN DO N WILL DO AS IT DEEMS FIT

Petronet LNG: Stock to add to the kittyFundamental positive cues:
1. Indian Govt. news on regulating tariff and facilities of LNG to boost demand
2. Decreased impact on financial performance in spite of lockdown
3. June and July seeing an increase in storage and pipeline utilization in its major sites (Dahej Terminal) compared to April / May
4. Permission granted to open LNG stations across the nation
5. Predicted force majeure wins on account of cancellations
Technical cues:
1. Gradual upward move along the lower trend line since the fall in March 2020
2. Big spike of green candle to reach the time tested sticky zone of 272-278
3. Volume spike indicating a strong and sustainable up move
4. MACD in day TF looking for a steep crossover
5. 50 EMA cutting 200 EMA from below. Price > 20 EMA > 50 EMA > 200 EMA whilst all EMA facing upwards.
Buy: 270; Target: 300 (Short term) SL: 250
With cluster of positive news and market sentiments positive, it is a good buy even for long run as the company gives regular dividend.
Since the stock is good buy and a good addition to the portfolio in the long run, stop loss need not be strictly obliged.
However, in case of swing trading with tight liquidity - SL can be placed around 250

Nifty to bounce or correct 1000 points.Nifty is at a crucial level.
On the left we are looking a the 50 monthly EMA in white where nifty made a low on Monday. In the past (2016) nifty used this EMA to bounce and recover a huge amount of its loss. The 50 EMA bounce may recover 1000 points on the nifty in the next 30-60 days.
On the right we have the 100 monthly EMA in yellow. This was the EMA that supported the 2007-2008 down move. The EMA is at 8900 which is 1500 points lower than CMP. The market looks very negative and all sectors globally look like they are bearish.
With fears around COVID-19, Oil wars and increasing risk averse nature in lending, I would be more inclined to believe the chart on the right looking at the global situation of the world.

1st 15 minute range breakout system for day trading. Thanks you for expressing your interest in Trading system that I’ve backtested on Bank Nifty and shared the results over tradingview.com.
A friend has told me about this system and I backtested this manually out of sheer curiosity.
Follow is how this system can be applied and used.
*Step - 1*
Rule : Mark high and low points of first 15 minute movement / candle of nifty .
Let us understand it using Bank Nifty’s Nov. 18th movements as an example.
Above is the Chart, with high and low marked clearly.
*Step - 2*
Rule : Wait for B.Nifty to break this range in either direction.
As you can see, B.Nifty break the low on IInd 15 min. candle, but closed above that, the very next candle did closed below the low.
The 1st 15 min. low was marked at 31036, and 3rd or 9:45 Candle closed at 31009.
*Step - 3*
Check for corresponding EMA on RSI or some other indicator, and if it is not in sync with B.Nifty fall or rise, ignore the breakout,
If it is in sync, take a long or short position depending on side of breakout.
Since the RSI was well below the EMA line, we could have taken a short position near 31009, as both the conditions have met.
1. Nifty closed below the low of 1st 15 min. candle.
2. RSI is below EMA at the time of close.
*Step - 4*
Short or long position in Bank Nifty can be covered with a gap of approx. 100 points or more if the indicators permit.
Today, Bank Nifty did fall further and provided opportunity to close the position with a gap of approx. 100 points.
This system works equally well on Nifty and even individual shares.
*Step -5*
Theoretically the stop loss for such positions should be B.Nifty closing above the high of first 15 mins. In some cases (like today) this high is very far, waiting for such a high stop loss is not practical.
EMA on RSI indicator may assist in closing the position in profit or giving a viable stop loss, in such cases.
Looking at today's example, if RSI exceeded EMA around 12:30, 14th - 15th candle. Incase one has not been able to close the position by then, there was an opportunity to close this short in little profit.
You may use some other indicator to determine reversal, that you find more comfortable or reliable.
EMA on RSI combination does a good job for me, I prefer trade long or short on the basis of confirmation of this indicator combo.
You may find it here :
if you find it useful, LIKE it and add it to Favorites on this page itself. It will be handy in your indicators list then.
Send me direct message or post your queries below, if you need any more clarification.

TORNTPHARMIchimoku Conversion Line(3,7,14) >= Ichimoku Base Line(3,7,14)
Ichimoku Span A(3,7,14) >= Ichimoku Span B(3,7,14)
Close >= Ichimoku Cloud Bottom(3,7,14)
Close >= Parabolic Sar(0.02,0.02,0.2)
Rsi(10) >= 20
StochRsi(10) >= 20
Cci(10) >= 0
Mfi(10) >= 20
Williams %R(10) >= 80
Close >= Ema(close,14)
ADX DI Positive(10) >= ADX DI Negative(10)
Aroon Up(10) >= Aroon Down(10)
Slow Stochastic %K(5,3) >= Slow Stochastic %D(5,3)
Fast Stochastic %K(5,3) >= Fast Stochastic %D(5,3)
Close >= Sma(close,10)
Macd Line(14,5,3) >= Macd Signal(14,5,3)
Rsi(14) > 50
StochRsi(14) > 50
Rsi(10) < 80
Close >= Upper Bollinger band(20,2)
Close >= Ichimoku Cloud Bottom(9,26,52)
Close >= Open
Ema(close,5) >= Ema(close,20)
Ema(close,20) >= Ema(close,50)
Close >= Ema(close,50)

Can we see it stopped again at the head & shoulders neckline?Over time, eurjpy was pushed up from the area of YPP (P) 128.637 and MPP (P) 128.786.
It will be stopped around 130.000 and the next week will be come.
Weekly Chart
130.000 is not only a round number but also a head & shoulders neckline, so it seems that there are many conscious traders.
(Also worried that for MA users 800 EMA and 1600 EMA are close?)
Even if it goes up or down it has a possibility to move greatly, it is likely to be a turning point.
as you can see,YPP (P) was penetrated several times last month and Month before last.
Therefore, we do not think much about support line.
However, since MPP (P) don't have a lot of information to say that it is easy to be penetrated, attention is still necessary.
<< tactics >>
1) 130.000 functioned as a resistance line
short.
The first limit is above 128.785.
The second limit is above 128.000. * Assuming that it can penetrate MPP (P) and YPP (P)
2) It is doubtful that 130.000 functions as a resistance
If it penetrate 130.000 and function as a support line, I will consider long.
I would be grateful if you like it idea,give me follow or agrees!
------------------------- --------------------------
Brown thick line: Yearly Pivot Points (YPP in the text)
Light blue thick line: Monthly Pivot Points (MPP in the text)
Green thin line: Weekly Pivot Points (WePP in the text)
Indigo thickLine: Horizontal line or Trend line seen by weekly or monthly
Indigo thin line: Horizontal line or Trend line seen by 4hourly or daily
Indigo dotted line: outstanding round number.
Red curve: EMA 20 close
Indigo curve: EMA 200 close
Green curve: EMA 800 close
Black curve: EMA 1600 close
x mark: Line which may not function
------------------------- --------------------------
