NIFTY SPOT FIBONACCI PROJECTIONS FOR 27-APR-2023Today's Fibonacci projections for NIFTY. These projections are automatically plotted through my indicator.
Search in ideas for "FIBONACCI"


Nifty FibonacciNifty is near 2X Fibonacci level, in past nifty has corrected a bit near Fibonacci levels before continuing upwards again

Analisa Teknikal Menggunakan FibonacciAnalisa teknikal menggunakan fibonacci
SRTG
Buy : 1850-1860
TP : 2060
SL : < 1795

Tata Power 30%+ Profit Possibility for Long Term (Fibonacci)Tata Power correction has ended at 38.2 retracement level. As per the Fibonacci rule, it should touch 1.382 extn which is at 100 rs .
Fundamental of this company is strong and the promoters are increasing their stake.
This is only for educational purpose.

Surya Roshi Fibonacci RetracementSurya Roshi Fibonacci Retracement, targeting 385 plus in Jan 2021
*** Purely personal analysis ***
Investment in securities is subject to market risks. Kindly consult your financial advisor before investment

Trend Based Fibonacci retracement & extensionThere is a strong uptrend in the stock from past few months.
Upward movement in prices observed after retracement of price in upper highs.
RSI levels is currently at 71%.
This stock will hit 400 levels as per trend based fibonacci extension tool and Fibonacci retracement taken.


FIBONACCI TRADING TOOLSHi
There are 3 popular Fibonacci tools viz. Fib retracement, fib extension and fib projection. Most of the times traders get confused with these three and make wrong calculations.
These levels can be calculated manually but most advanced trading platforms provide tools so that you don't have to go through the time consuming process of writing everything on the paper. In TradingView platform there are Fib retracement and Trend-based Fib extension tools, in the left pane of the chart window, for this purpose.
Fib retracements is the most popular among the three tools mentioned above. When a stock is in a strong uptrend and then it pulls back, this tool gives us potential reversal points where the pullback might end. These levels are 0.382, 0.5 and 0.618. We should look for some bullish pattern in this zone if we want to enter into a trade.
Fib extensions is a least known but still useful tool. It is used when the pullback is over and we have already taken an entry. It is calculated from the length of the pullback itself. It gives us targets which we should be looking for to exit the trade. Levels 1.272 and 1.618 are the popular ones among others.
Fib projection is also a popular tool to identify the targets to exit a trade. It is calculated form the length of the impulse as well as retracement.
I hope this information would help some traders in taking better trading decisions.
Regards
JJSINGH

Lets find New Nifty Top with Fibonacci and Elliott Wave TheoryDISCLAIMER:There is no guarantee of profits nor exceptions from losses.
Technical analysis provided on the chart is solely the personal views of my research.
You are advised to rely on your own judgments while taking any investing/Trading decisions.
Past performance is not an indicator of future returns. Investment/trading is subject to market risks.
Seek help of your financial advisors before investing/trading.
I may or may not trade this analysis. Details in description.
-------(((((Please LIKE & Donate Coins to support my analysis)))))-------
Lets find New Nifty Top With Fibonacci and Elliott Wave Theory
To everyone's surprise Nifty after declining more than 3% on daily chart on 21st Dec 2020 recovered and mere few points away from 13777
Look at Blue Impulse Wave plotted on Chart
Now with Gap up opening on Thur 24th Dec it is confirmed that wave 3 in progress and wave 3 ended above 1.618 Fibonacci level
Wave 4 was very short and didn't even retrace 0.236 levels so now if wave 5 is in progress then should reach to 13940-65
Now Look at Orange Impulse Wave
Wave 3 in extended case can go till 2.618 Fibonacci level 14017 next in wave 4 again 13700 will be tested finally wave 5 should end at 14212

NIFTY FIBONACCI STUDY AND ANALYSISFIBONACCI RETRACEMENT STUDY
CRUCIAL LEVELS OF FIBO:-61.8% (GOLDEN)
:-50% (HALF-WAY POINT)
ANALYSIS:
2)NIFTY MANAGED TO BOUNCE BACK FROM THE
HALF-WAY POINT
1)IT WOULD HAVE BEEN GREAT IF THE BOUNCE WAS
FROM THE 61.8% MARK AS THE 200-DMA IS AT THE
SAME POINT.
3)WEEKLY CHART SHOWS INDEX FORMED A DRAGON-FLY DOJI.
4)BOUNCED FROM ITS 23.6% FIBO LEVELS
5)MANAGED TO BOUNCE FROM-200 DMA
CONCLUSION
-INDEX WILL FIND IT HARD TO BREAK ABOVE 10730
-DUE TO HEAVY CALL WRITING @10700 LEVES
-IF BREAKS THEN THERE WILL BE SERIOUS SHORT COVERING WHICH WILL PROPEL THE INDEX TO TEST 10815
NIFTY WEEKLY STUDY
invst.ly

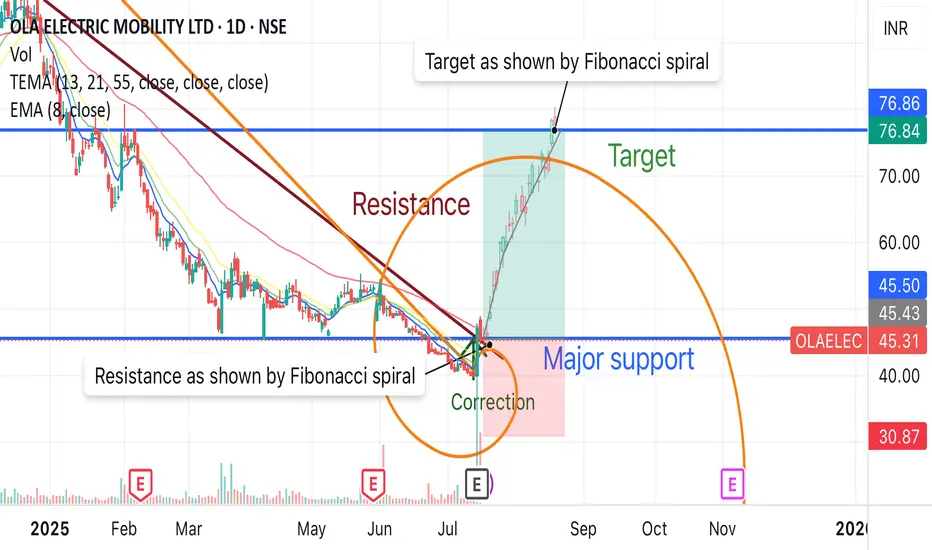
Ola Electric breakout with 65% of upside potential by FibonacciOla electric mobility is going to give 65% of upside with Fibonacci spiral and resistance breakout with high volume.
Buy around - 45 to 47
Target - 76
Duration - 2-3 months
Adani Power - Perfect Fibonacci Trade SetupAdani Power Trade Setup
The fibonacci setup is giving a very good trade setup for this stock.
the MACD trend lines are about to move up showcasing the end of downward cycle and it's perfectly setting on the fibonacci setup.
Wait for a day or two for the movement in the upward direction and take an entry in the stock with a price target of 895.
the trade is having a ratio of 1:3.6

Fibonacci divider and 5 waves It anyone knew about Elliott , we could have used Fibonacci divider to show us the the top. This was a perfect wave .
Note how wave iv divided the entire wave into 0.618 : 0.382 ratio . A Fibonacci divider.
Now just hope this wave should not be retraced by more than 0.618 percent . If it does the we can assume this was an extended wave 5 which will put a cap on the stock for atleast double the time of its current wave up. Regards

IndoBorax - Fibonacci Targets in sight after Breakout - DailyIndo Borax & Chemical Ltd. has recently broken out cleanly from a descending trendline. The Fibonacci retracement levels provide clear targets for the upcoming price action, making this an interesting setup.
Technical Analysis:
Descending Trendline Breakout: The stock has decisively broken out from a descending trendline, indicating a shift in momentum from bearish to bullish.
Fibonacci Retracement Levels: The Fibonacci retracement levels drawn from the recent high to the low indicate potential resistance and support levels. Key observations include:
Support at Fib 1: The price took support at the 1.0 Fibonacci level (₹171.10) post-breakout and bounced off strongly.
Resistance at 2.618: The stock faced resistance at the 2.618 Fibonacci level (₹213.59) but has since taken support at the 1.618 level (₹187.33).
Potential Target Levels: A daily close above ₹213.59 opens up the 3.618 level (₹239.86), with the previous high acting as another target at ₹232.21.
Volume Analysis: The breakout was accompanied by a significant increase in volume. The Volume has spiked again today.
Key Levels to Watch:
Support: ₹171.10 (1.0 Fibonacci level) and ₹187.33 (1.618 Fibonacci level).
Resistance: ₹213.59 (2.618 Fibonacci level) and ₹232.21 (previous high).
Bullish Divergence on Weekly
On the Weekly chart, you will also notice that there has been a Bullish Divergence where the price made a Lower Low, while RSI made a Higher Low, shortly before the Breakout.
The RSI seems to be on an upward trajectory since, as you can see in the chart below.
Let me know your thoughts in the comments. Please do Boost and Follow for more analyses!
Disclaimer: This analysis is for educational purposes and should not be considered financial advice.

Fibonacci Retracement - Zig Zag - Swing TradeOn the Chart, the price follows a zig-zag pattern. Using Fibonacci the price touches 1.414 at price 155 with RSI below 30. It bounces back to 0.314 which is up to 196 in short term.

Entry and Exit Levels for this Dmart uptrend rally (Fibonacci)Entered at 1441.40 and Exiting at 1644.25.
202.85 points profit estimated at fibonacci level 78.6%.

Principle of convergence in FibonacciIf we take two recent swing lows and swing highs and draw Fibonacci Retracement levels for getting a clear idea of possible retracements then there are following possibilities.
1. Nifty has two retracement levels in close proximities, which coincides with each other.
2. First Retracement level of 18030-18080 is already completed. If Nifty Sustains, will move up.
3. If Nifty breaks this level of Retracement, then it might lead to next retracement level of 17480-17576.(buy Put or sell Future)

BoB| Fibonacci Breakout after Retracement of C&H BO |New TrendNSE:BANKBARODA
Fibonacci BO > 94
Retracement after Cup & Handle Breakout complete
Now, CMP above 50 & 200 Week SMA
This is a signal for start of new positive trend.
Tgt: 108-126-137
SL: 78
RSI > 55 and increasing

Fibonacci Channel on #Copper weekly ChartNew to the world of CHARTS, but always fascinate by Fibonacci. Tried the fib Channel on Copper weekly chart, markets seem to mostly respect the time schedule as per Fib.
Will keep analyzing more.

SBIN following fibonacci series strictlyClearly we can see that at every major fibonacci levels the stock had a response. yesterday stock has touched 38.2% retracement which is good though not considered very strong because a retracement of 61.8% and bounce is considered very strong. Also this is expected because of the external influences. a 38.2% retracement is healthy and bounce here can take the stock beyond earlier high. I would like to consider little below 23.6% (306) as a stop loss and go long. My first target would be 344 and 2nd target is 362.

ITC Channel and 0.618 Fibonacci LevelsITC previously corrected 0.618 fibonacci level after making swing high from march 2020 lows.
When channel drawn on swing high and March low 0.618 fibonacci level comes at lower end of channel. Coincidence or probability of downside in future.
