Power Boosters For PowerGRID _ LONGIt may touch 190 and may even break out ..
Sentiment & Factors :
1.Upcoming Earning Results
2.US election results
3. COVID vaccine news
4. Increased Industrial Production
Indicators:
Taking RSI , Bollinger Bands and PitchFork indicators into account, Still have enough room for expansion
Search in ideas for "INDICATORS"

BANKNIFTY analysis. Possible down moveHello Trader, Here is the full analysis of BANKNIFTY:
1) Monthly - This support can be tested at 19900 of two supports are broken
2) Hourly - It is forming lower highs and lower lows and is below the trend line and can test this trend line to break upside.
Action
Due to the huge volatility in prices and weak markets globally one can see a downfall to test support 1 and support 2 levels. There is a significant fall in Dow to -1417 and this is huge fall straight 2 days. One can look for shorting opportunity for levels 20370 and 20130.
If the trend line is broken upside then we can look for long opportunity for level 20820 and 21100 level
Current market
NASDAQ 9,641.67 -378.68
SGX NIFTY (Jun 11) 9,599.00 -254.00
Dow futures 25,544.0 -1417.0
Technical Indicators:
Moving Averages Bearish
Technical Indicators Bearish
Moving Averages Crossovers Bearish
How can you support me :
1) Like my idea.
2) Follow me for more analysis
Feedback :
Please share your feedback in comments and this will help me to improve my drawing and analysis
Note : This is purely for educational purpose.

USDCHF multi time frame analysisHello Trader, Here is the full analysis of USDCHF:
1) Monthly - No significant price action found.
2) Daily - Forming big red candles which shows weakness in the prices.
2) 4Hourly - Currently testing the buy zone/support level and is in between 0 and 0.23 fib level(which is not an important level) .
3) Current retracement level is at 0.5 which is good level for prices to move up
Action
marubozu candles are formed on the daily chart which shows a weakness in the prices. If the support is broken with a marubozu candle then we can see a downfall below support. Wait for these levels to look for entry opportunity .
Technical Indicators:
Moving Averages - Strong Sell
Technical Indicators - Strong Sell
Moving Averages Crossovers - Strong Sell
COT data(Commitment of traders):
JUNE 06/02/2020
USD - Long(17877) Short(9619)
CHF - Long(13364) Short(4375)
JUNE 05/26/2020
USD - Long(21039) Short(6240)
CHF - Long(13246) Short(4507)
How can you support me :
1) Like my idea.
2) Follow me for more analysis
Feedback :
Please share your feedback in comments and this will help me to improve my drawing and analysis
Note : This is purely for educational purpose.

MARUTI UP Trend comes to an END.]MARUTI : 6762.50. [/b
Candle pattern: Possibility of ]EVENING DOJI STAR [/b (Bearish)
Indicators: ADX, RSI, W%R & some other Indicators are OverBought.
Volume: Much Below 20 day AVG. & -12.44% compare to Prev. day.
WAVE Count: Today Already achieved 2.272 Fib. Retracement (WAVE - 5)
GAP: Bullish GAP formed on 02 May 2017 (@ 6589.90 to @ 6618)
DERIVATIVE: Spot: 6762.5 Future: 6756.0 Discount: 6.5 '
PCR: Current: 1.05 Previous: 1.07 Change: -1.869%
INTRADAY Levels:
Resistance: @ 6798, @ 6825 - @ 6844 (Hurdle Zone), @ 6882
Support: @ 6712, @ 6685 - @ 6665 (Bounce Zone), @ 6614
Positional Swing Levels:
Resistance: @ 6912, @ 6955 (STRONG), @ 7070
Support: @ 6597, @ 6554 (Strong) , @ 6440
CONCLUSION for TRADE:
In CASH: SELL ON RALLY.
In DERIVATIVE:
#1 SHORT FUT with LONG Call Option. (For HEDGE)
#2 Long ITM PE + Short Nearer OTM PE

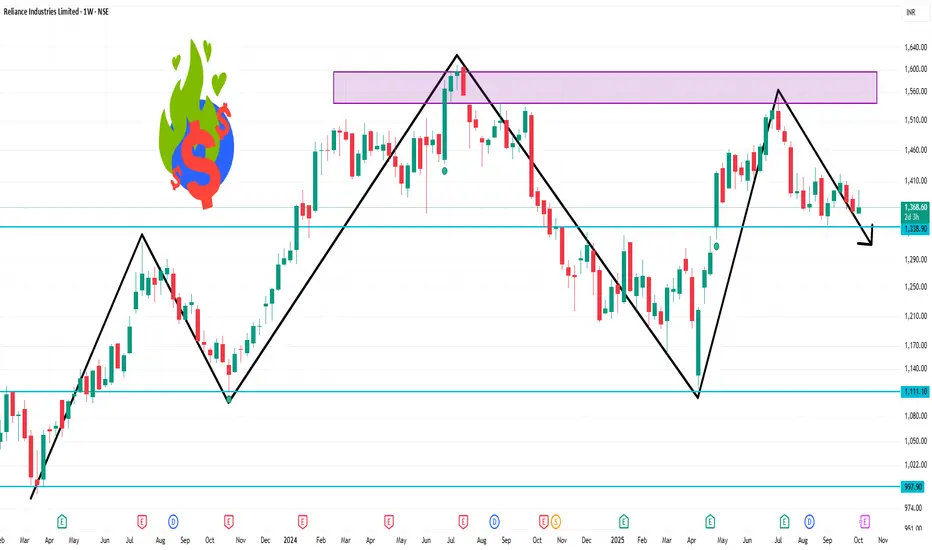
RELIANCE 1 Week Time Frame 📊 Weekly Technical Outlook
Overall Trend: The prevailing trend is bearish, with a "Strong Sell" signal on the weekly timeframe.
Moving Averages: All key moving averages—5-day, 10-day, 20-day, 50-day, 100-day, and 200-day—are indicating a "Sell" signal.
Relative Strength Index (RSI): The RSI is at 44.99, suggesting the stock is neither overbought nor oversold but leans towards a bearish stance.
MACD: The Moving Average Convergence Divergence (MACD) is positive at 1.73, indicating potential upward momentum.
🔧 Key Support & Resistance Levels
Weekly Pivot Point: ₹1,369.77
Support Levels: ₹1,318.43, ₹1,337.67
Resistance Levels: ₹1,401.87, ₹1,414.73
🔍 Additional Indicators
Technical Summary: The stock is rated as a "Strong Sell" based on moving averages and technical indicators.
Pivot Analysis: Current price is trading below the weekly pivot point, indicating a bearish short-term outlook.
📈 Conclusion
Reliance Industries Ltd is currently in a bearish phase on the weekly chart, with all major moving averages signaling a "Sell." While the MACD suggests some potential for upward movement, the overall technical indicators and pivot analysis point towards caution. Traders should monitor the support levels closely; a break below ₹1,318.43 could lead to further downside.
Learn from the Charts: Educational Stock Watchlist (Aug 29, 2025Here’s today’s carefully selected Watchlist of Stocks. Each stock has been shortlisted based on its chart structure, indicators, and candlestick behavior. These are not trade tips — the goal is to help you learn how to analyze live setups.
🔹 HONAUT (Honeywell Automation)
💼 Industrial Automation Leader
About: A leader in industrial automation and engineering solutions, known for stable long-term growth.
Technicals: The stock shows strong bullish momentum with high volume participation. RSI and Stochastic confirm strength, while candlesticks are forming higher highs and higher lows.
👉 Why Track This? Excellent case study to see how large-cap, fundamentally strong companies sustain momentum rallies. It will help you understand the role of volume confirmation in bullish breakouts.
🔹 ASTRAZEN (AstraZeneca Pharma)
💼 Global Pharma Giant
About: A global pharma major focused on medicines for oncology and chronic diseases.
Technicals: The stock is showing short-term bearish pressure with MACD and CCI negative, though volumes remain high. Candles are showing signs of volatility and possible reversal attempts.
👉 Why Track This? Great learning to watch how heavy volumes can precede potential reversals even in weak phases. Pharma stocks often give sharp swings — observing this helps in spotting bottoming-out patterns.
🔹 WAAREE ENER (Waaree Energies)
💼 Renewable Energy – Solar Solutions
About: A key player in renewable energy, specializing in solar PV modules and solutions.
Technicals: The stock is in strong bullish momentum. RSI is in overbought territory, CCI also signals strength, and candlesticks point toward continuation of trend.
👉 Why Track This? Perfect example of how high-momentum renewable stocks can keep trending despite overbought indicators. A good study for understanding extended rallies in growth sectors.
🔹 JUBILANT CPH (Jubilant Pharmova)
💼 Diversified Pharma
About: Diversified pharma and life sciences company.
Technicals: High momentum stock but currently undergoing a bearish phase. Charts show lower highs forming, and candlesticks suggest pullbacks.
👉 Why Track This? Useful for studying retracements within otherwise strong momentum stocks. This teaches how to differentiate between temporary corrections and deeper reversals.
🔹 CAPLIPOINT (Caplin Point Laboratories)
💼 Fast-Growing Export Pharma
About: A fast-growing pharma company with strong presence in exports.
Technicals: Stock is trending bullish with low risk. Indicators are supportive, and candlesticks are showing higher lows, confirming accumulation.
👉 Why Track This? A good case study for observing how a stock consolidates before making higher moves. Helps you understand the concept of “low-risk bullish entries” on charts.
🔹 MALLCOM
💼 Safety Gear Manufacturer
About: Manufacturer of industrial safety gear and protective equipment.
Technicals: Despite strong past moves, momentum has turned bearish. Charts show indecision with candles testing support levels.
👉 Why Track This? Great example to learn how indecisive candlestick patterns (dojis, small-bodied candles) can signal either breakdowns or reversals. Watching closely here will help you understand market psychology.
🔹 TTKHLTCARE (TTK Healthcare)
💼 Healthcare & Consumer Products
About: A diversified healthcare and consumer products company.
Technicals: Bullish momentum with low risk. RSI and MACD are supportive, and candles show steady accumulation.
👉 Why Track This? A classic case to learn how accumulation patterns look before bigger price movements. Tracking this will build your ability to spot early entry setups.
📊 Each of these stocks showcases different market phases — strong rallies, corrections, consolidations, and reversal attempts. Observing them today will sharpen your technical analysis skills.
Happy Learning & Observing,
STWP
⚠️ Disclaimer – Please Read Carefully
The information shared here is meant purely for learning and awareness. It is not a buy or sell recommendation and should not be taken as investment advice. I am not a SEBI-registered investment advisor, and all views expressed are based on personal study, chart patterns, and publicly available market data.
Trading — whether in stocks or options — carries risk. Markets can move unexpectedly, and losses can sometimes exceed the money you have invested. Past performance or past setups do not guarantee future results.
If you are a beginner, treat this as a guide to understand how the market works — practice on paper trades before risking real money. If you are experienced, always assess your own risk, position sizing, and strategy suitability before entering trades.
Consult a SEBI-registered financial advisor before making any real trading decision. By engaging with this content, you acknowledge full responsibility for your trades and investments.
💬 Found this useful?
🔼 Give this post a Boost to help more traders discover clean, structured learning.
✍️ Drop your thoughts, questions, or setups in the comments — let’s grow together!
🔁 Share with fellow traders and beginners to spread awareness.
👉 “If you liked this breakdown, follow for more clean, structured setups with discipline at the core.”
🚀 Stay Calm. Stay Clean. Trade With Patience.
Trade Smart | Learn Zones | Be Self-Reliant 📊
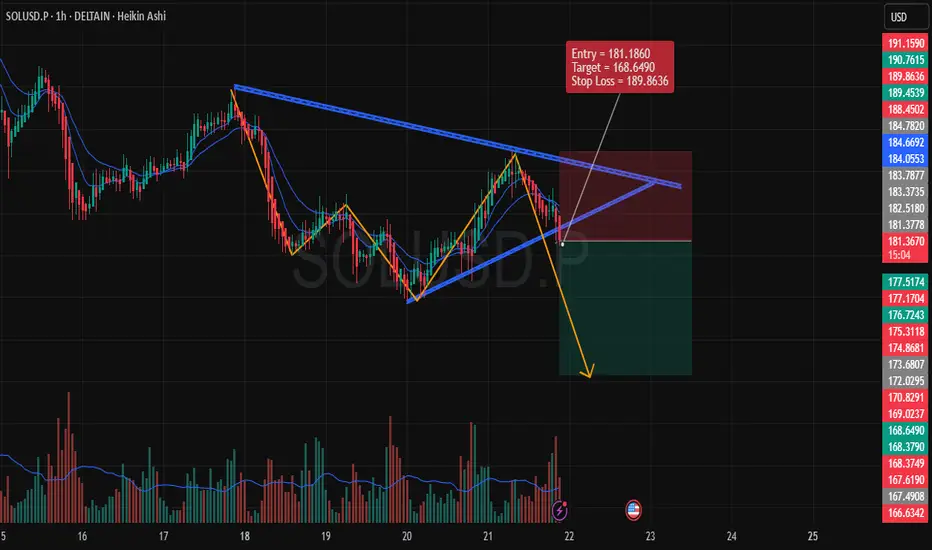
Bearish Setup on SOLUSD (1-Hour Time Frame)Entry Price: 181.1860
Target: 168.6490
Stop Loss (SL): 189.8636
1. Chart Analysis
We are observing a descending triangle pattern formation, which generally signals a bearish continuation once the price breaks downward.
The price action has already shown signs of rejection at the upper boundary of the pattern, reinforcing the possibility of a breakout to the downside.
2. Indicators & Confirmation
Volume Analysis: Noticeable spike in volume during the recent downward movement, which indicates strong selling pressure. This is crucial for confirming the potential bearish trend.
EMA Confluence: The price is below the 9 and 20 EMAs, which are crucial indicators of the current market trend. The EMAs are acting as dynamic resistance, further supporting the bearish scenario.
3. Risk Management
The stop loss is placed above the most recent significant high at 189.8636. This placement ensures that we protect against any false breakouts or short-term price reversals.
The target at 168.6490 is derived based on previous support levels and a measured move from the triangle pattern. This target is realistic given the market structure.
4. Price Action
The price action shows lower highs and lower lows, a typical characteristic of a downtrend. If this pattern holds, the next logical price move is to break downward through the support of the triangle.
5. Conclusion
Overall, this setup provides a solid bearish opportunity, backed by technical patterns and strong momentum indicators. The risk-to-reward ratio is favorable, making it a well-structured trade.
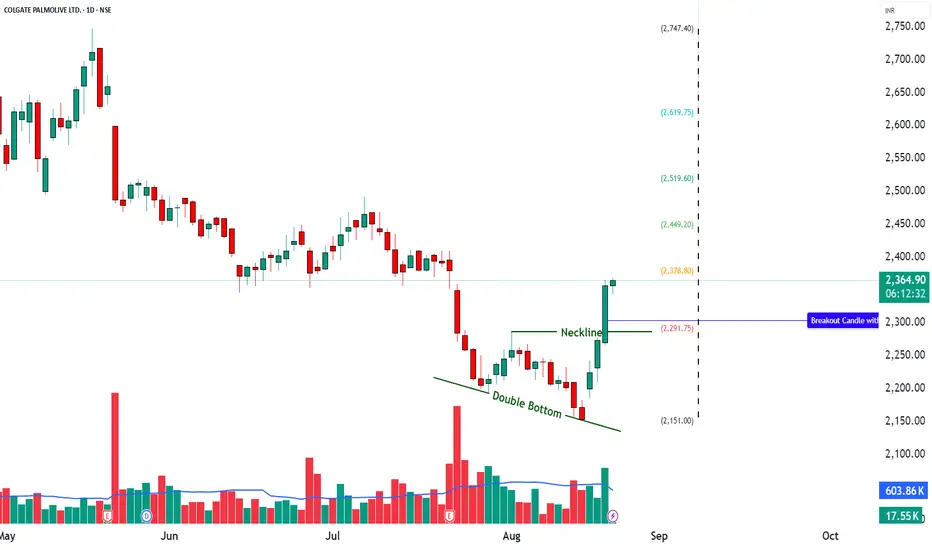
COLPAL - RSI Breakout + Bollinger Band Breakout📊 COLPAL – Technical & Educational Snapshot
Ticker: NSE: COLPAL | Sector: 🪥 FMCG
CMP: ₹ ▲ (as of 20 Aug 2025)
Rating (for learning purpose): ⭐⭐⭐⭐
Pattern Observed: 📈 RSI Breakout + Bollinger Band Breakout
COLPAL is showing strong bullish momentum supported by multiple technical indicators. The presence of a strong bullish candle, along with an RSI breakout at 61, highlights healthy buying pressure. A Bollinger Band breakout and BB Squeeze-Off indicate rising volatility and the possibility of a continuation move. The Bullish SuperTrend adds further confirmation, while momentum indicators (MACD bullish, CCI at 223, Stochastic at 96) signal strong near-term strength.
📊 Momentum Snapshot: Momentum indicators are aligned on the bullish side. While Stochastic shows overbought conditions, strong volume-backed momentum often sustains until key resistance levels are tested.
📊 Volume Check:
🔹 Current Volume: 1.01M
🔹 20SMA Volume: 710.56k ✅
💥 Significantly above average – confirms strong institutional / broad-based buying interest!
💡 Interpretation:
When volume is well above the 20-period average, it strengthens the reliability of a breakout.
It shows that the move is not just retail-driven but likely supported by larger participants.
Breakouts with high volume tend to sustain better compared to low-volume moves.
💡 Learnings:
Breakouts with Bollinger Band expansion often lead to strong follow-through moves.
RSI + MACD confirmation together strengthen trend reliability.
High CCI & Stochastic values show strong momentum but also highlight the importance of monitoring for pullbacks.
Defining pullback and invalidation levels helps in disciplined trade management.
Key Levels:
Resistance: 2393 | 2429 | 2492
Support: 2293 | 2229 | 2193
Pullback Area: 2294
Invalidation Level: Close below 2193
STWP Trade Setup:
Entry (Long): Above 2365
Stop Loss: 2262 or below
Reference Levels: 2467 | 2569
⚠️ Disclaimer – Please Read Carefully
The information shared here is meant purely for learning and awareness. It is not a buy or sell recommendation and should not be taken as investment advice. I am not a SEBI-registered investment advisor, and all views expressed are based on personal study, chart patterns, and publicly available market data.
Trading — whether in stocks or options — carries risk. Markets can move unexpectedly, and losses can sometimes be larger than the money you have invested. Past performance or past setups do not guarantee future results.
If you are a beginner, treat this as a guide to understand how the market works — practice on paper trades before risking real money. If you are an experienced trader, remember to assess your own risk, position sizing, and strategy suitability before entering any trade.
Consult a SEBI-registered financial advisor before making any real trading decision.
By reading, watching, or engaging with this content, you acknowledge that you take full responsibility for your own trades and investments.
💬 Found this useful?
🔼 Give this post a Boost to help more traders discover clean, structured learning.
✍️ Drop your thoughts, questions, or setups in the comments — let’s grow together!
🔁 Share with fellow traders and beginners to spread awareness.
✅ Follow simpletradewithpatience for beginner-friendly setups, price action insights & disciplined trading content.
🚀 Stay Calm. Stay Clean. Trade With Patience.
Trade Smart | Learn Zones | Be Self-Reliant 📊
Bharat Heavy Electricals LtdAs of May 16, 2025, Bharat Heavy Electricals Ltd. (BHEL) exhibited a strong bullish trend on the daily chart, supported by various technical indicators.
📊 Daily Technical Overview
Closing Price: ₹250.35
Day’s Range: ₹244.16 – ₹259.99
Volume: ~50.24 million shares, significantly higher than the 20-day average of ~12.66 million shares, indicating strong trading activity.
📈 Key Technical Indicators
Relative Strength Index (RSI): 68.19 – Approaching overbought territory, suggesting strong buying momentum.
MACD: 6.97 – Indicates bullish momentum.
Stochastic Oscillator: 88.40 – In overbought zone, which may signal a potential pullback.
Commodity Channel Index (CCI): 252.86 – Suggests the stock is overbought.
Williams %R: -19.29 – Also indicates overbought conditions.
Average Directional Index (ADX): 16.45 – Points to a weak trend strength, implying that while the trend is upward, it may not be strongly established.
🧭 Moving Averages
Short-Term:
10-Day EMA: ₹235.52
20-Day EMA: ₹229.64
Medium-Term:
50-Day EMA: ₹220.86
100-Day EMA: ₹222.11
Long-Term:
200-Day EMA: ₹244.28
The current price is above all these moving averages, reinforcing the bullish outlook.
TipRanks
🔍 Pivot Points (Classic Method)
Support Levels:
S1: ₹239.67
S2: ₹233.63
S3: ₹229.72
Resistance Levels:
R1: ₹249.62
R2: ₹253.53
R3: ₹259.57
The stock is nearing R1, and a breakout above this could lead to testing R2 and R3.
📌 Summary
BHEL's stock demonstrates strong bullish momentum, trading above key moving averages and supported by high trading volumes. However, several indicators suggest overbought conditions, which may lead to short-term consolidation or a minor pullback. Investors should monitor the stock's movement around the ₹250–₹260 range for potential resistance and watch for confirmation before making new entries.

INDUSIND Bank // 1month Support and ResistanceAs of May 5, 2025, here are the key 1-Month Support and Resistance levels for IndusInd Bank Ltd. (NSE: INDUSINDBK) based on recent technical analyses:
📊 Monthly Support and Resistance Levels
Level Value (₹)
S3 809.77
S2 888.08
S1 941.97
Pivot 1,015.58
R1 1,074.17
R2 1,152.48
R3 1,206.37
These levels are derived from the previous month's price range and are commonly used to identify potential reversal points in the market.
📈 Technical Indicators
Relative Strength Index (RSI): 44 (Neutral)
Moving Average Convergence Divergence (MACD): 5.16 (Sell)
Average Directional Index (ADX): 25.44 (Weak Trend)
Commodity Channel Index (CCI): -61.09 (Downtrend)
Money Flow Index (MFI): 26.16 (Strong Downtrend)
These indicators suggest a neutral to slightly bearish momentum, indicating potential downward movement if selling pressure increases.
📌 Summary
Immediate Support: ₹809.77
Immediate Resistance: ₹1,074.17
Medium-Term Outlook: Neutral to slightly bearish, with mixed signals from moving averages and momentum indicators.
Please note that technical analysis is subject to change based on market conditions. It's advisable to monitor these levels regularly and consider consulting with a financial advisor for personalized investment advice.

Nifty 50 //2hour Support and ResistanceAs of April 30, 2025, at 9:45 AM IST, the Nifty 50 index is trading at approximately ₹24,100. Based on recent analyses and technical indicators, here are the key support and resistance levels for the Nifty 50 on a 2-hour timeframe:
📈 Key Support Levels
S1: ₹23,800 – A significant support level where buying interest may emerge.
S2: ₹23,500 – A crucial support zone; breaching this could indicate further downside potential.
S3: ₹23,200 – A critical support level; if broken, it may lead to a more substantial decline.
📊 Key Resistance Levels
R1: ₹24,460 – Immediate resistance; a breakout above this level could signal bullish momentum.
R2: ₹24,550 – A strong resistance zone; surpassing this could lead to further gains.
R3: ₹24,800 – A significant resistance level; if breached, it may indicate a continuation of the uptrend.
📌 Technical Indicators
Relative Strength Index (RSI): Currently at 41.51, indicating neutral momentum.
Moving Averages: The index is trading above its 200-day Simple Moving Average (SMA) of ₹23,780.57, suggesting a long-term bullish trend.
🧭 Trading Strategy
Given the current levels:
Bullish Scenario: A breakout above ₹24,460 could lead to a rally towards ₹24,800.
Bearish Scenario: A decline below ₹23,500 may indicate a move towards ₹23,200.
Traders should monitor these levels closely and adjust their strategies accordingly.
Please note that these levels are subject to change based on market dynamics. It's advisable to use them in conjunction with other technical analysis tools and indicators.

EURUSD NEXT POSSIBLE MOVE SAXO:EURUSD
As of January 31, 2025, the EUR/USD pair is exhibiting signs of a potential bullish movement.
**Market Pulse**
The EUR/USD is currently trading within an ascending channel, indicating a short-term bullish trend. The pair is testing the support area near 1.0395, suggesting a possible rebound and continuation of the upward movement
**Key Technical Levels**
- **Resistance:** 1.0485
- **Support:** 1.0395
**Technical Indicators**
- **Trend:** The pair is moving within an ascending channel, indicating a short-term bullish trend.
- **RSI:** A rebound from the support line on the RSI indicator suggests a potential upward movement.
**Trade Recommendation**
Considering the technical indicators and the prevailing bullish trend, initiating a **buy** position is advisable.
- **Entry Point:** Buy at 1.0400
- **Take Profit (TP):** 1.0635
- **Stop Loss (SL):** 1.0325
**Risk Management**
This trade setup offers a favorable reward-to-risk ratio. Ensure that your position size aligns with your risk tolerance and overall trading strategy.
**Conclusion**
The EUR/USD pair is showing signs of a potential bullish movement, supported by technical indicators. Traders should monitor key levels and manage risk appropriately.
*Disclaimer: Trading forex carries a high level of risk and may not be suitable for all investors. Ensure you fully understand the risks involved and seek independent advice if necessary.*

EURUSD NEXT POSSIBLE MOVE SAXO:EURUSD
As of January 30, 2025, the EUR/USD pair is exhibiting signs of a potential bullish movement.
**Market Pulse**
The EUR/USD is currently trading within an ascending channel, indicating a short-term bullish trend. The pair is testing the support area near 1.0395, suggesting a possible rebound and continuation of the upward movement.
**Key Technical Levels**
- **Resistance:** 1.0485
- **Support:** 1.0395
**Technical Indicators**
- **Trend:** The pair is moving within an ascending channel, indicating a short-term bullish trend.
- **RSI:** A rebound from the support line on the RSI indicator suggests a potential upward movement.
**Trade Recommendation**
Considering the technical indicators and the prevailing bullish trend, initiating a **buy** position is advisable.
- **Entry Point:** Buy at 1.0400
- **Take Profit (TP):** 1.0635
- **Stop Loss (SL):** 1.0325
**Risk Management**
This trade setup offers a favorable reward-to-risk ratio. Ensure that your position size aligns with your risk tolerance and overall trading strategy.
**Conclusion**
The EUR/USD pair is showing signs of a potential bullish movement, supported by technical indicators. Traders should monitor key levels and manage risk appropriately.
*Disclaimer: Trading forex carries a high level of risk and may not be suitable for all investors. Ensure you fully understand the risks involved and seek independent advice if necessary.*

EURUSD NEXT POSSIBLE MOVE SAXO:EURUSD
As of January 29, 2025, the EUR/USD pair is exhibiting signs of a potential bullish movement.
**Market Pulse**
The EUR/USD is currently trading within an ascending channel, indicating a short-term bullish trend. The pair is testing the support area near 1.0395, suggesting a possible rebound and continuation of the upward movement.
**Key Technical Levels**
- **Resistance:** 1.0485
- **Support:** 1.0395
**Technical Indicators**
- **Trend:** The pair is moving within an ascending channel, indicating a short-term bullish trend.
- **RSI:** A rebound from the support line on the RSI indicator suggests a potential upward movement.
**Trade Recommendation**
Considering the technical indicators and the prevailing bullish trend, initiating a **buy** position is advisable.
- **Entry Point:** Buy at 1.0400
- **Take Profit (TP):** 1.0635
- **Stop Loss (SL):** 1.0325
**Risk Management**
This trade setup offers a favorable reward-to-risk ratio. Ensure that your position size aligns with your risk tolerance and overall trading strategy.
**Conclusion**
The EUR/USD pair is showing signs of a potential bullish movement, supported by technical indicators. Traders should monitor key levels and manage risk appropriately.
*Disclaimer: Trading forex carries a high level of risk and may not be suitable for all investors. Ensure you fully understand the risks involved and seek independent advice if necessary.*

Breakout and Breakdown Strategy in 3D Time FrameTrend-Based Fibonacci Extension Levels (3-Day):
CRYPTO:BTCUSD
COINBASE:BTCUSD BINANCE:BTCUSD OANDA:BTCUSD MARKETSCOM:BITCOIN FOREXCOM:BTCUSD BITFINEX:BTCUSD OKX:BTCUSD BITMEX:BTCUSDF2025 KRAKEN:BTCUSD EASYMARKETS:BTCUSD OKCOIN:BTCUSD VANTAGE:BTCUSD BYBIT:BTCUSDT WEBULLPAY:BTCUSD WEBULLPAY:BTCUSD CRYPTOCOM:BTCUSD MEXC:BTCUSDT HTX:BTCUSDT UPBIT:BTCUSDT BYBIT:BTCUSDC UPBIT:BTCUSDT
1. Breakout Strategy
This strategy is for when the price breaks out above the 400% level or breaks down below the 361.80% level.
Bullish Breakout (Above 400%):
Trigger: A strong close above the 400% level, ideally with increased volume. Look for confirmation from indicators like the MACD (crossing bullish) or the Daily CMO moving higher from its low value.
Entry: Enter a long position just above the breakout candle high to avoid false breakouts.
Stop-Loss: Below the 400% level or the nearest support level, such as the 391% region.
Targets:
First Target (T1): 423.60% (next major resistance).
Second Target (T2): 450% if bullish momentum strengthens.
Bearish Breakdown (Below 361.80%):
Trigger: A strong close below the 361.80% level with confirmation (e.g., bearish MACD continuation or CMO dipping further negative on both Daily and 3-Day).
Entry: Enter a short position just below the breakdown candle low.
Stop-Loss: Above the 361.80% level or the last significant swing high.
Targets:
First Target (T1): 330% (midway support).
Second Target (T2): 261.80% (strong pullback level).
2. Range Trading Strategy
If the price continues to trade between the 361.80% and 400% levels, this strategy involves buying at support and selling at resistance.
Key Steps:
Entry:
Long near the 361.80% level if price shows signs of reversal (e.g., bullish candlestick patterns like hammers or engulfing candles).
Short near the 400% level if price shows rejection or reversal (e.g., shooting stars or bearish engulfing candles).
Stop-Loss:
For longs: Just below the 361.80% support level.
For shorts: Just above the 400% resistance level.
Targets:
For longs: Exit at 400%.
For shorts: Exit at 361.80%.
Indicators to Monitor in the Range:
Look for divergence between the CMO (Daily) and price at the support/resistance zones.
Use RSI: Enter positions when RSI approaches oversold (near 40) at support or overbought (near 70) at resistance.
3. Pullback Strategy
This strategy works if the price breaks a key level (either 400% or 361.80%) but pulls back to retest the level before continuing in the breakout direction.
Entry:
Bullish Pullback:
Wait for a breakout above 400%, then enter long when the price retests 400% and holds as support.
Bearish Pullback:
Wait for a breakdown below 361.80%, then enter short when the price retests 361.80% and confirms as resistance.
Stop-Loss:
Place the stop just below (bullish) or above (bearish) the retest level to manage risk.
Targets:
Bullish Target: First 423.60%, then higher extensions if momentum aligns.
Bearish Target: First 330%, then 261.80%.
Risk Management Tips
Position Sizing: Risk no more than 1-2% of your capital per trade to protect against unexpected moves.
False Breakouts: Be cautious of false breakouts—wait for confirmation (e.g., a retest or increased volume) before entering.
Multi-Time Frame Confirmation: Always confirm setups on both the Daily and 3-Day time frames, especially for breakout trades.
Final Thoughts
If you’re unsure about the direction, focus on range trading until a breakout occurs.
Watch for divergence between the Daily CMO (short-term momentum) and price. For example:
If CMO rises while price struggles at 400%, it could signal a breakout.
If CMO drops sharply as the price approaches 361.80%, a breakdown becomes likely.
Scenario Breakdown:
The price is consolidating between 361.80% (support) and 400% (resistance).
The pullback to 261.80% reflects a prior correction, indicating that this level might act as a significant support zone in the event of further downside.
The repeated rejection at the 400% level, coupled with resistance at 423.60%, confirms strong selling pressure in the current zone, preventing a bullish breakout.
MACD (3-Day):
The MACD line below the trend line with a previous bearish crossover suggests that bearish momentum dominates the 3-Day time frame. This adds to the challenges for a sustained breakout above 400%.
RSI (3-Day):
The RSI at 61 indicates moderate bullish strength but not strong enough to push the price past key resistance levels yet. The current level hints at consolidation or fading bullish momentum, depending on further price action.
CMO (Chande Momentum Oscillator):
3-Day time frame (CMO at 33): The asset still holds moderate bullish momentum on the higher time frame, although it isn’t in an overbought zone.
Daily time frame (CMO at 4.71): This much lower value indicates almost no momentum or very weak bullish sentiment in the shorter term. This divergence between time frames highlights a lack of alignment between the shorter and longer-term trends.
Interpretation of Multi-Time Frame Analysis:
3-Day Time Frame:
The asset is struggling to build momentum, as indicated by the bearish MACD crossover, rejection at 400%, and moderate CMO levels. The RSI suggests that the price is not completely bearish, but the indecision between 361.80% and 400% signals potential consolidation unless a breakout occurs.
Daily Time Frame:
The CMO at 4.71 in the Daily time frame shows that short-term momentum is almost flat. This could mean:
Bulls are losing strength, and the price could revisit the 361.80% level as support.
If there’s no significant bullish catalyst, a move lower to 261.80% might occur.
The Daily time frame momentum lagging behind the 3-Day time frame suggests that the shorter-term market activity does not yet support an imminent breakout to the upside.
Potential Scenarios:
Bearish Scenario:
The lack of momentum on the Daily time frame (low CMO and bearish MACD) suggests that the price may retest the 361.80% support level.
If this support breaks, the price could drop toward the 261.80% level, which has been a significant pullback level in the past.
Bullish Scenario:
If the price can reclaim the 400% level with volume and bullish momentum, a test of the 423.60% resistance level is likely.
A break above 423.60% could trigger further bullish continuation, but this requires alignment of both Daily and 3-Day indicators.
Neutral/Rangebound Scenario:
The asset might continue consolidating between the 361.80% and 400% levels until there’s a clear catalyst to break out of this range.
Key Insights:
Watch the Daily time frame CMO closely: The low value indicates weak short-term momentum, so any significant moves will need improvement in this indicator.
Pay attention to the 400% level: A clean breakout and daily close above this level could signal bullish strength returning.
Monitor the 361.80% level for breakdowns: If this support fails, a deeper correction becomes likely.

Maruti Suzuki India Ltd daily chat analysis
1. Chart Overview
📈 This Maruti Suzuki India Ltd chart represents the daily price movement. On the NSE. It shows candlestick patterns alongside various technical indicators like MACD, RSI, Volume, and some custom overlays such as support and resistance zones.
2. Key Chart Feature and Pattern Observation
🔹 The price recently broke above a key resistance level, as indicated by the green candlestick and volume spike.
🔹 A triple-bottom pattern (Bottom 1, Bottom 2, Bottom 3) is visible, signaling a potential reversal and a bullish trend.
🔹 The background has alternating green and red highlights, likely reflecting trend strength or signal zones (bullish or bearish).
3. Indicator Analysis
📊 Volume
- A significant volume spike coincides with the breakout, confirming strong buying interest.
📊 MACD (Moving Average Convergence Divergence)
- The MACD line (black) has crossed above the signal line (red), confirming bullish momentum.
- The histogram is transitioning from red to green, indicating a positive trend.
📊 RSI (Relative Strength Index)
- The RSI is trending upwards and is around 39.74, suggesting the stock is leaving oversold territory.
- It is yet to enter overbought zones, leaving room for further upside.
4. Key Levels or Price Levels
🔑 Support Levels
- Immediate support at approximately 11,375, marked by the breakout point.
- Stronger support near 10,725, as indicated by previous bottoms.
🔑 Resistance Levels
- Immediate resistance around 12,000.
The next key resistance is at 13,680 (as per the high marked on the chart).
5. Overall Summary
📝 The chart depicts a bullish breakout following a period of consolidation, confirmed by a triple-bottom pattern. Indicators like MACD and RSI support the bullish bias, while the volume spike adds further confirmation of market interest.
6. Trading Strategy
💡 For Buyers
- Look for pullbacks near 11,375 for entry opportunities, with a stop-loss below 10,725.
- Target 12,000 in the short term and 13,680 for a medium-term outlook.
💡 For Sellers
- Wait for price rejection or a bearish divergence near 12,000 before considering short positions.
7. Conclusion
🚀 The chart signals a bullish breakout with strong confirmation from patterns and indicators. Traders can capitalize on this momentum while being cautious of resistance levels and broader market conditions.

INTC Swing Complete.I wanted to test out some simple no-BS indicators on a swing trade. I ended up using the MACD cross and Overbought/Oversold indicators. I'd say it was pretty successful. The I had a support/resistance line (yellow) and would have been better off selling when it crept near that $24 area. That being said, it's important to read candles and formations for reversals etc. Using purely the indicators I'd say the trade was successful. I didn't have a bunch of money invested (for obvious reasons), but I still gained something like 8.4% of my original investment. So not bad. Hope this helps someone. NOTE: I plan to re-enter a position once a buy signal is posted. I think Intel is due for some more upside soon.
Not trading advice.

A strong candidate for long term Infra Stock NSE: NILAINFRA Technical Analysis of NSE: NILAINFRA
Nila Infrastructures Limited (NSE: NILAINFRA) has shown some interesting technical patterns and indicators. Here’s a detailed analysis based on the latest data:
Price Movement and Trends
Current Price : As of the latest data, the stock is trading around ₹11.97.
52-Week Range : The stock has fluctuated between ₹4.90 and ₹14.50 over the past year1.
Recent Performance : The stock has seen a significant rise, with a 55.94% increase in the last year2.
Technical Indicators
Moving Averages : The stock is trading above its 200-day moving average, which is a bullish sign. However, it is close to its 50-day moving average, indicating potential consolidation.
Relative Strength Index (RSI) : The RSI is currently neutral, suggesting neither overbought nor oversold conditions.
MACD (Moving Average Convergence Divergence) : The MACD line is above the signal line, indicating a bullish trend.
Volume : There has been an increase in trading volume, which often precedes significant price movements.
Support and Resistance Levels
Support : The immediate support level is around ₹11.40.
Resistance : The immediate resistance level is around ₹12.69. A breakout above this level could signal further upward movement.
Fundamental Analysis
Debt Levels : Nila Infrastructures has a significant amount of debt, which could pose a risk if not managed properly3.
Profitability : The company has shown poor profit growth over the past few years, with a negative growth rate1.
Valuation : The stock is trading at a high P/E ratio of 41.46, indicating that it might be overvalued at current levels1.
Investment Advice
Given the technical and fundamental analysis, here are some considerations for long-term investment:
I would be interested in a Long Position if theres a breakout with good volume:
The stock has shown strong upward momentum over the past year.
Technical indicators like MACD and moving averages suggest a bullish trend.
High promoter holding (61.9%) indicates confidence in the company.

JKLAKSHMI's Anti-Shark and Bat Patterns, Potential TargetsIn this post, we will conduct a comprehensive analysis of JKLAKSHMI, focusing on the formation of the anti-shark and bat patterns on the chart. Additionally, we will consider the impact of a rumored reduction in Goods and Services Tax (GST) on cement products, which could potentially influence the stock's performance. Let's delve into the analysis and gain insights into the situation.
Chart Analysis:
Upon examining the provided TradingView chart for JKLAKSHMI, we can observe the formation of both the anti-shark and bat patterns. These patterns provide potential trading opportunities for investors.
The bat pattern has an activation zone at 688.5, suggesting a potential bullish reversal if the price reaches this level. The first target for the bat pattern is set at 715.2, with the second target at 738. It is important to establish a stop loss at 655 to manage risk effectively.
The anti-shark pattern has an entry point at 693, indicating a potential bullish reversal. The first target for the anti-shark pattern is set at 719, with the second target at 741. A stop loss at 660 is recommended to limit potential losses.
Support and RSI Analysis:
The daily chart of JKLAKSHMI displays a weak trendline support, further enhancing the potential significance of the anti-shark pattern. A buying price of 660, with a small stop loss of 645, is suggested for trendline traders. However, it is essential to exercise caution and ensure confirmation through other technical indicators and price action before making trading decisions.
Additionally, the daily Relative Strength Index (RSI) is in the oversold zone, indicating that the stock may have been oversold and could potentially experience a rebound in the near future. While this can provide a supportive argument for the bullish case, it should be considered alongside other factors and indicators.
Impact of GST Reduction Rumors:
It is crucial to consider the potential impact of the rumored GST reduction on cement products. If the GST rate on cement products is reduced from 28% to 18% in the next GST meet, it could have a positive influence on cement manufacturers like JKLAKSHMI. Such a reduction could potentially lead to increased demand and improved profitability for the company, which might positively affect its stock price.
Conclusion:
Based on the analysis, JKLAKSHMI exhibits the formation of the anti-shark and bat patterns, which suggests potential bullish reversals. Traders should carefully monitor the price levels mentioned, along with the suggested stop losses and targets, while considering additional technical indicators and price action for confirmation.
Furthermore, the rumored reduction in GST on cement products could act as a catalyst for JKLAKSHMI's stock price. Investors should stay informed about developments surrounding the GST meetings and subsequent decisions.
However, it is important to note that trading and investment decisions should be made after thorough analysis and consideration of both technical and fundamental factors. It is advisable to consult with a financial advisor or conduct further research before making any financial decisions.

GBPUSD Falling wedge on 4HRA falling wedge pattern is a technical chart pattern that forms when the price consolidates between two converging trendlines that slope downward. It is typically considered a bullish pattern because it suggests a potential reversal of the prevailing downtrend.
In the context of the GBP/USD currency pair, if the price has formed a falling wedge pattern, it means that the currency pair has been experiencing a downward trend but is now showing signs of consolidation. This consolidation is represented by the converging trendlines of the falling wedge pattern.
The breakout from a falling wedge occurs when the price breaks above the upper trendline, which suggests that the selling pressure is weakening. This breakout is often seen as a bullish signal by traders, indicating a potential reversal of the downtrend and the possibility of an upward move.
After the breakout, it is common for the price to retest the upper trendline. This retest is a way to validate the breakout and confirm that the selling pressure has indeed decreased. If the price successfully retests the upper trendline without falling back into the wedge pattern, it can provide further confirmation of the bullish signal.
Based on the statement you provided, it suggests that the GBP/USD has already broken above the upper downtrend line of the falling wedge pattern. The expectation is that the price will now retest the upper trendline and potentially continue to rise thereafter.
However, it's important to note that market movements are unpredictable and can be influenced by various factors such as economic data, geopolitical events, and market sentiment. Chart patterns provide insights into potential price movements, but they are not foolproof indicators. Traders and analysts often use additional tools, such as technical indicators and fundamental analysis, to make more informed decisions.
To make accurate trading decisions, it is advisable to consider a combination of factors, including the current market conditions, news events, and technical indicators, while also managing risk effectively. Additionally, staying updated with real-time market data and seeking insights from trusted financial sources or professional analysts can be beneficial.

HINDALCO & TATASTEEL ANALYSISMetal sector is having good momentum and good charm these days, here are some stocks analysed like Hindalco and Tatasteel, both are looking good enough to go long, as per price actions and as well as per elliot waves along with trend indicators.
Indicators of Hindalco
hindalco macd in weekly positive crossover
hindalco macd in daily is positive
rsi in daily uptick and above 70
Indicators of Tatasteel
Tatasteel weekly macd positive
Tatasteel daily macd positive
rsi in daily in tatasteel uptick
Disclaimer
I am not sebi registered analyst
My studies are Educational purpose only
Please consult your Financial advisor before trading or investing

ADANI POWER - POSITIONAL - 2022ADANI POWER pick as positional due to bullish technical indicators, stock recently get trend line breakout after consolidation around 95 to 100 level and give good upmove ..last 3-4 trading session nifty sharply corrected 700-800 points ..effect of which stock get corrected bit .. now around same level golden crossover as well as trend line breakout seen.
this is fair level of stock to buy where technical indicators are extremely bullish, Risk to reward ration is around 1:2 from current level 10-20 % profit can seen from cmp 109.95 Short term stock can see 125-135 and mid term 140-150 level if quarter result improves .
fundamentally co have to improve profit margin to go for long in this stock ..at present its pure technical call to get 10-20% POSITIONAL trade short term.
Techncial indicators.
1. Trendline breakout
2. Golden cross 20,50,200 sma
3 Double bottom formation at consolidation
4. RSI VALUE 61 ( 60-80) bullish when stoock uptrend
5. Higher top higher bottom formation
6. MACD above center and signal line
** PLEASE DO OWN ANLYSIS THIS IDEA CAN HELP FOR EDUCATION PURPOSE.. take call at own risk .!
HAPPY TRADING. !

Intraday trading with ATR points (ATR Trailing Stops)Share Market options are very logical. But most of the time we don't realise this. ATR Trailing stop indicators are useful in trading options. ATR trailing stops are different from all other indicators and can be used to easily understand day trade (intraday trade).
If you use Zerodha or upstox, Select Nifty 50 Chart -> select Studies -> search ATR Trailing Stops & select Change Plot Type -> Squarewave -> givenPeriod-21 & Multiplier 3 -> Click Done.
How to calculate ATR points? After 3.30p.m. or after share market is closed, Calculation can be done using today's closing price and ATR closing price (Today’s closing price - ATR points). It will help us to trade on the next day. Take ATR points 1min, 5min, 10min, 15min, 30 min & 1hr. Most of the time Nifty will reach till 1hr. Sometimes it will reach 2hrs also. So we have to calculate till 2hrs.
If we calculate, we will know the range nifty will go through & what point it will reach next. (i.e.) If 10 min value is reached & it crosses that value, the points will reach 80% of the next point. So we can buy when we get signal for buying and with ATR, we can find a convenient point for selling by realising if it will reach this point or not.
In my trading page, I have selected candle Heiken Ashi, ATR Trailing Stops Indicators. In the chart page, you can see the above mentioned ATR on 7/1/2022. In the chart, ATR value is 17690 and the closing price is 17816. But in 30 min chart, the closing price is 17820. So we have to calculate for both closing price of the day and 30 min closing price.
I will show you how to calculate ATR value and it will work for the next day.
30min -> 17816-17690 = 126
17816 + 126 = 17942, (if close price higher than ATR , add closing price)
17690 -126 = 17564( if ATR smaller than closing price, subtract ATR price)
15 min-> 17884-17820 = 64
17884 + 64 =17948
17820 - 64 = 17756
ATR calculation are perfect for day traders. It is useful for the entire day.
