Gold has been correcting. Gold has given been in bear's grip since Wednesday (25-09-19), it formed a Doji on daily chart yesterday (26-09-19) and resumed the fall today.
It has come out of a medium term channel on 25th, 1483-89 is the range it managed to form a bottom from when it corrected a few days back.
It may break this support this time, 1440-1460 is the next target on the down side.
Other indicators too are suggesting further weakness.
Beyond technical analysis, Gold is probably reacting to news of US China trade talk resumption, which has seen many weathers in the recent past.
Besides US China trade developments, there are many factors that can push the prices higher in near term, all major economies around the globe are giving signals of severe slowing down of economy, central banks have been cutting interest rates to support economies.
In my opinion Gold should not break 1440-1460 levels in near future, investors should accumulate on dips and investors should trade long on confirmation of technical indicators. The indicators have not being supporting a buy at this stage, so wait for confirmation.
Mature or experienced traders may short and ride the trend.
Search in ideas for "INDICATORS"

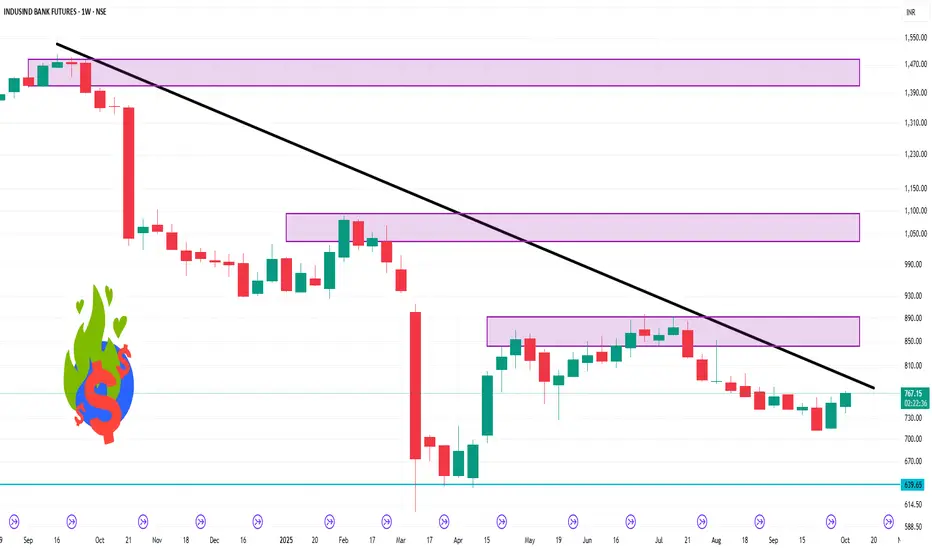
INDUSINDBK 1 Week Time FrameKey Technical Indicators:
Oscillators: Neutral
Moving Averages: Strong Buy
Overall Technical Rating: Neutral
Support and Resistance Levels:
Weekly Pivot Points:
Support: 739.63
Resistance: 766.72
Additional Insights:
Relative Strength Index (RSI): The 14-day RSI is at 70.368, suggesting the stock is approaching overbought conditions, which may indicate a potential pullback
Moving Averages: The 5-day moving average is 755.54, and the 50-day moving average is 744.63, both indicating a bullish trend
Conclusion:
While the overall technical rating is neutral, the price action above the weekly pivot point and the bullish moving averages suggest a potential for upward movement. However, the elevated RSI indicates caution, as the stock may be due for a correction. Traders should monitor these levels closely and consider the broader market conditions before making trading decisions.
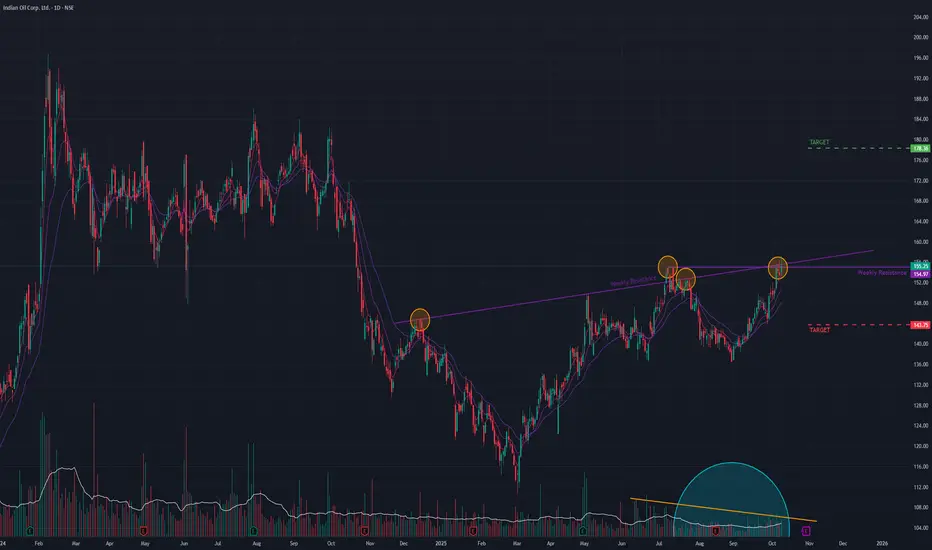
IOC (D) - Tussling with a Critical Resistance ZoneIndian Oil Corp (IOC) is showing a strong bullish structure, but it has arrived at a critical juncture where two significant resistance levels are converging. The price action suggests a battle between buyers and sellers is underway, and a decisive move is imminent.
The Bullish Foundation
After a year-long downtrend that ended in February 2025, the stock has carved out a clear new uptrend , consistently forming higher highs and higher lows. This upward momentum is well-supported by multiple technical indicators:
- Golden Crossover: A long-term bullish "Golden Crossover" of the Simple Moving Averages (SMAs) occurred a few months ago.
- Indicator Strength: The short-term Exponential Moving Averages (EMAs) and the Relative Strength Index (RSI) are in a bullish state across the Monthly, Weekly, and Daily timeframes.
The Resistance Test: A Mixed Signal
The primary challenge for IOC is a confluence of two resistance trendlines: a long-term angular resistance and a short-term horizontal resistance .
Today's trading session was a clear attempt to breach this zone, which resulted in a mixed signal:
- Partial Success: The stock managed to close above the short-term horizontal trendline , a minor positive.
- Key Rejection: However, while it did trade above the more critical long-term angular trendline intraday, it failed to hold these gains and closed below it .
This failure to close above the long-term resistance, combined with consolidating (non-expanding) volume, suggests that sellers are still active and buyers currently lack the conviction to force a decisive breakout.
Outlook and Key Levels
The next few trading sessions are crucial and will provide clarity.
- Bullish Scenario: A convincing daily close above the long-term angular trendline , especially if accompanied by an increase in volume, would confirm the breakout and signal a move towards the ₹178 level.
- Bearish Scenario: Continued rejection from this trendline could lead to a pullback, with the stock likely to find support around the ₹141 level.
The current price action warrants close monitoring. A breakout is clearly being attempted, but confirmation is required before a new directional trend can be established.
Gold Price Action | Educational Breakout Setup at 4040 ZoneHello Traders and Investors,
Gold has delivered a powerful bullish rally over the last few weeks, driven by continued demand for safe-haven assets and technical breakouts above key resistance levels. However, the current market structure shows that the metal is nearing exhaustion, and traders should stay alert for a potential reversal or deeper pullback.
🔹 Technical Structure:
Current Market Price: Around $4,045
Resistance Zone (PRZ): $4,040 – $4,090
Support Zone / Target for Pullback: $3,830 – $3,850
Overall Trend: Bullish but Overextended
Price action clearly shows that Gold has entered a major resistance zone, aligning with both historical supply levels and overbought technical conditions.
Multiple tests of this region without strong follow-through suggest buyer fatigue.
The recent candles show long upper wicks, indicating supply pressure and a potential loss of bullish momentum. If sellers gain control here, the market may begin a healthy correction phase.
🔸 Market Behavior & Confirmation:
Momentum Indicators: RSI and stochastic oscillators are showing overbought readings, suggesting a slowdown in upward momentum.
Volume Analysis: Volume is decreasing as the price approaches resistance — a typical sign that buyers are losing strength.
Candle Structure: Lower timeframe rejection wicks around 4040–4080 support the idea of a potential short-term reversal zone.
If we get a bearish engulfing candle or a break below short-term support at 4020, it could open the path for a correction toward the 3850 region, which aligns with the previous breakout area and EMA support zone.
🔹 Educational Breakdown:
This setup represents a textbook example of how market structure, resistance confluence, and momentum divergence align to form a Potential Reversal Zone (PRZ).
Such areas are not guaranteed reversal points but zones of interest, where professional traders look for confirmation before taking positions.
Always remember:
A reversal starts with structure shift on lower timeframes.
Entry confirmation is key — never pre-anticipate a reversal.
Manage risk properly; structure-based trading focuses on reaction, not prediction.
🔸 Forward Scenarios:
Scenario 1 – Reversal Setup (Most Likely):
If Gold faces rejection near $4,090 and fails to break higher, we could see a retracement toward $3,850, completing a healthy correction.
Scenario 2 – Continuation Setup:
If buyers break and close above $4,100 with strong volume, the next resistance lies near $4,180 – $4,220.
🔹 Conclusion:
Gold remains bullish in the macro trend, but short-term exhaustion is visible. Traders should look for rejection confirmation near the resistance zone for potential correction opportunities.
Patience and confirmation will define the next profitable move.

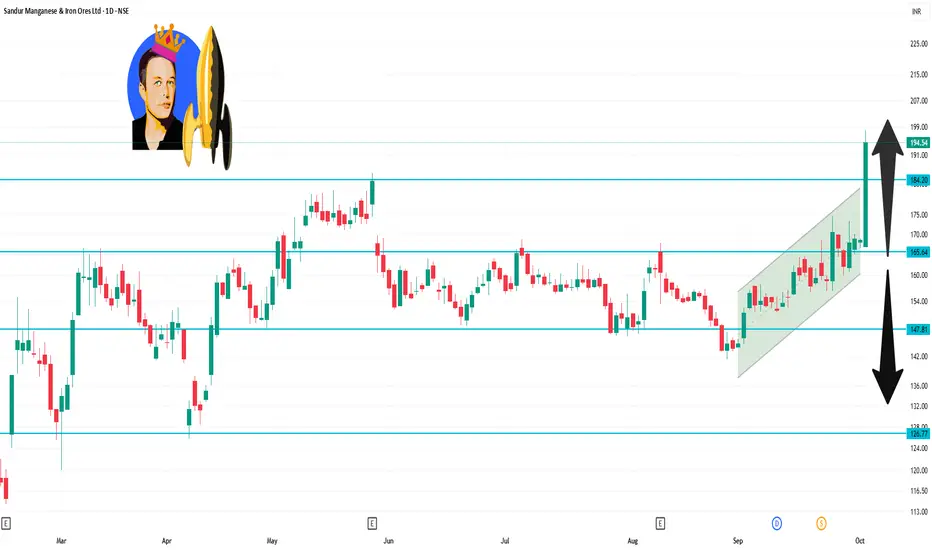
SANDUMA 1 Day Time Frame Key Intraday Data:
Opening Price: ₹167.00
Closing Price: ₹194.40
Day’s Range: ₹166.85 – ₹198.10
52-Week Range: ₹112.77 – ₹198.10
Volume Traded: Approximately 36.3 million shares
Market Capitalization: ₹9,457 crore
The stock closed at ₹194.40, marking a 15.34% increase from the previous close of ₹168.54. It also achieved a new 52-week high of ₹198.10 during the day.
Technical Indicators:
Technical analysis indicates a strong bullish trend for the stock. The Relative Strength Index (RSI) stands at 78.05, suggesting that the stock is approaching overbought territory.
Hindustan Zinc – Diya aur Batti Pattern📈 Pattern Analysis: Hindustan Zinc is currently shaping a "Rounding Bottom formation" on the charts, a classic reversal pattern that suggests the possibility of a long-term trend change. The stock is consolidating in a narrow range since Nov 2024 after a steep 50% decline from its top , indicating a phase of "Accumulation" .
Interestingly, alongside the rounding bottom, we also identify a newly observed structure – the “Diya and Batti Pattern” – which combines stability with a gradual build-up in price strength.
📊 Trend & Support:
The stock is trading above its 50 EMA, which is sloping upward, confirming the underlying uptrend.
Price stability over months strengthens the base formation and increases the probability of a powerful breakout.
🔎 Momentum Indicators:
Volumes remain muted during consolidation, a common sign of accumulation.
A decisive breakout must be accompanied by **rising volumes and a bullish candle** for confirmation.
🎯 Projection & Outlook: A confirmed breakout above the rounding bottom and accumulation zone will likely mark the beginning of a multi-year uptrend. Once breakout levels are crossed, Hindustan Zinc could witness significant upside momentum with potential medium- to long-term targets well beyond current levels.
⚠️ Disclaimer:
This is a technical projection intended for educational purposes, not an investment recommendation. Any trading strategy should be executed with proper risk management.

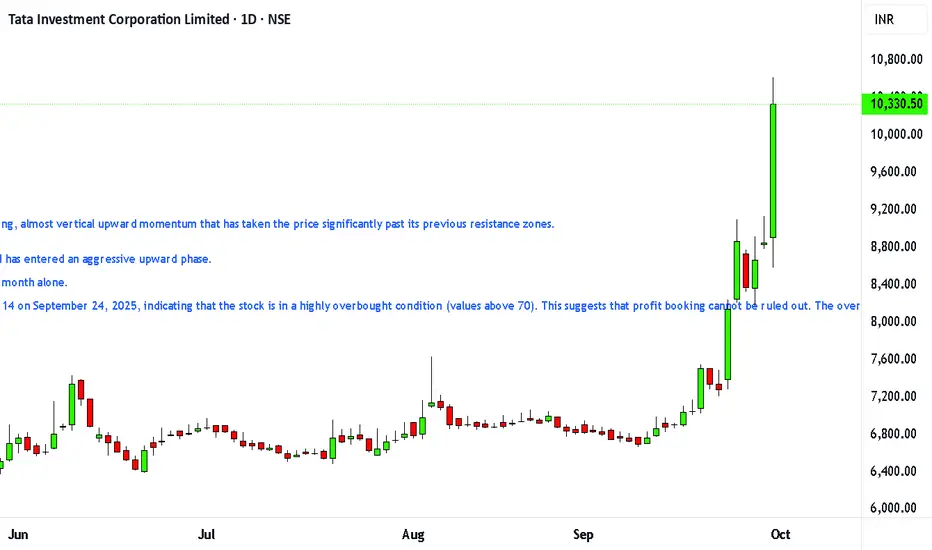
#TATAINVESTTechnical Analysis and Key Levels
The provided weekly chart (Image 1) and daily chart (Image 2) clearly show a strong, almost vertical upward momentum that has taken the price significantly past its previous resistance zones.
Current Technical Outlook
Trend: The trend is identified as a strong bullish reversal after a sharp decline and has entered an aggressive upward phase.
Price Movement: The stock has seen a massive surge, gaining over 50% in the last month alone.
Technical Indicators: The 14-day Relative Strength Index (RSI) was recorded at 87.14 on September 24, 2025, indicating that the stock is in a highly overbought condition (values above 70). This suggests that profit booking cannot be ruled out. The overall market sentiment, however, remains "very bullish" as of September 30, 2025.
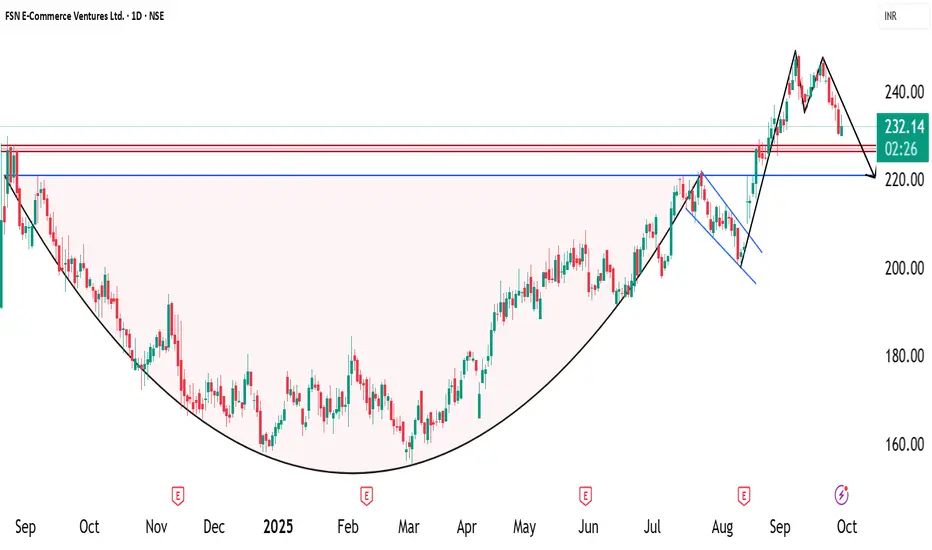
NYKAA - Cup with handle pattern📈 Pattern Analysis: Nykaa recently completed a "Cup-with-Handle Breakout" , which is a strong bullish continuation pattern. However, the breakout targets have not yet been achieved. In the past few sessions, the stock has witnessed selling pressure, forming a double-top bearish pattern on the chart.
📊 Key Levels & Structure: The price is currently in a corrective phase and may move lower to retest the breakout zone of the cup-with-handle pattern. This zone is expected to act as a strong support level and could provide a fresh opportunity for accumulation if the structure holds.
🔎 Momentum Indicators:
RSI has cooled off from overbought levels, creating room for the next leg of upside.
Volumes during the recent dip are lower compared to the breakout volumes, suggesting the decline is corrective rather than a trend reversal.
🎯 Projection & Outlook:
A successful retest of the breakout zone could resume the uptrend with upside targets around ₹ .... levels in the medium term. Failure to hold the support could, however, lead to extended consolidation.
⚠️ Disclaimer:
This is a technical projection, not an investment recommendation. Traders should manage risk carefully and align strategies with their financial objectives.
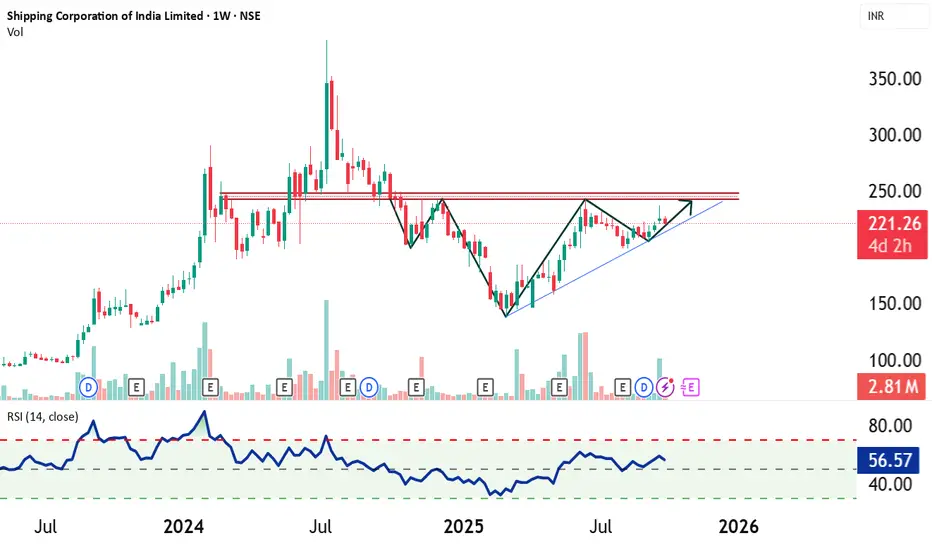
Shipping Corporation of India - Forming Bullish Head & Shoulder📈 Chart Analysis: On the weekly chart, Shipping Corporation of India (SCI) is showing signs of forming a "Bullish inverted head and shoulders pattern" , which is typically a reversal structure that signals the resumption of an uptrend. The neckline resistance is placed near ₹245–₹250 levels, and a decisive breakout above this zone could unlock strong upside momentum.
📊 Trend & Support: The stock is trading along an established uptrend line, which acts as a "Dynamic Support Level" . This trendline has been respected multiple times, reinforcing its validity. As long as the price sustains above this trendline, the bullish structure remains intact.
🔎 Momentum Indicators: RSI (Weekly) is currently around 56, showing neutral-to-positive momentum with room for further upside. Volumes have shown accumulation on upward moves, suggesting buying interest on rallies.
⚠️ Disclaimer:
This is a technical projection, not an investment recommendation. Any trading strategy should be established based on risk appetite, confirmation signals, and individual financial goals.
✍️ Prepared by: SEBI Certified Research Analyst (Not Registered)
Bajaj Health care falling wedge pattern.Price Action: A "weapon candle breakout" is evident, with the price testing 497.60 INR, supported by a "huge volume" spike, indicating strong bullish momentum.
Pattern: A falling wedge pattern is noted, typically bullish, with the breakout suggesting a potential upward trend.
Targets and Support:
As per chart any dip up to 458 is buying opportunity for Price targets are set at 646 INR (TG1) and 784 INR (TG2).
Indicators:
RSI (14, close) at 67.72 nears overbought levels.
MACD shows a bullish crossover.
ADX is in momentum (above 25) with +DI above -DI, confirming trend strength.
Like and support.

LUPIN 1 Day ViewKey Intraday Levels:
Opening Price: ₹2,020.00
Day’s High: ₹2,040.00
Day’s Low: ₹2,002.70
VWAP (Volume Weighted Average Price): ₹2,014.61
Volume Traded: 696,221 shares
52-Week High: ₹2,402.90
52-Week Low: ₹1,795.20
Market Cap: ₹92,000 crore
P/E Ratio: 24.87
EPS (TTM): ₹80.99
Beta: 0.82
Technical Indicators:
The technical analysis for Lupin Ltd indicates a neutral outlook, with oscillators showing no strong buy or sell signals.
Analyst Insights:
Analysts maintain a positive stance on Lupin Ltd, with a consensus "Buy" rating. Recent recommendations suggest a potential upside, with target prices ranging between ₹2,500 and ₹2,600

BTC LONG SETUPBTC/USDT – 1H Long Setup Analysis
🔹 Current Price: 111,653 USDT (Bitget Perpetual)
🔹 Trend: After a sharp drop from recent highs, BTC is showing signs of forming a base with a possible rebound setup.
⸻
Key Observations:
1. Support Zone:
• Strong support is visible around 110,744 – 110,747 USDT, marked by previous demand and horizontal structure.
• Below that, deeper support lies near 109,383 – 108,534 USDT.
2. Resistance Levels / Targets:
• TP1: ~115,078 – 115,980 USDT
• TP2: ~117,340 – 118,165 USDT
• Higher extension target: ~119,810 USDT
3. Trend Structure:
• Price broke a rising channel but has bounced back after a correction.
• Current pullback is retesting demand, indicating potential continuation to the upside if bulls defend the base.
4. Indicators:
• EMA 9 (blue) is currently under pressure, suggesting short-term weakness, but if reclaimed, momentum could shift bullish.
• Volume shows increased activity at recent lows, hinting at accumulation.
⸻
Long Trade Plan (Swing Bias):
✅ Entry Zone: Between 111,000 – 111,700 USDT (current price zone, near support)
✅ Stop-Loss: Below 110,744 USDT (to avoid fakeouts)
✅ Take Profit Targets:
• TP1 → 115,078 – 115,980 USDT
• TP2 → 117,340 – 118,165 USDT
• Extended TP → 119,810 USDT
📊 Risk-Reward Ratio: Favorable (approx. 1:3+ if targeting TP2).
⸻
Summary:
BTC is consolidating above a strong support base. If bulls hold the 111K–110.7K zone, upside targets remain valid towards 115K–118K. A break below 110.7K would invalidate this setup and could push price toward 109K or lower.

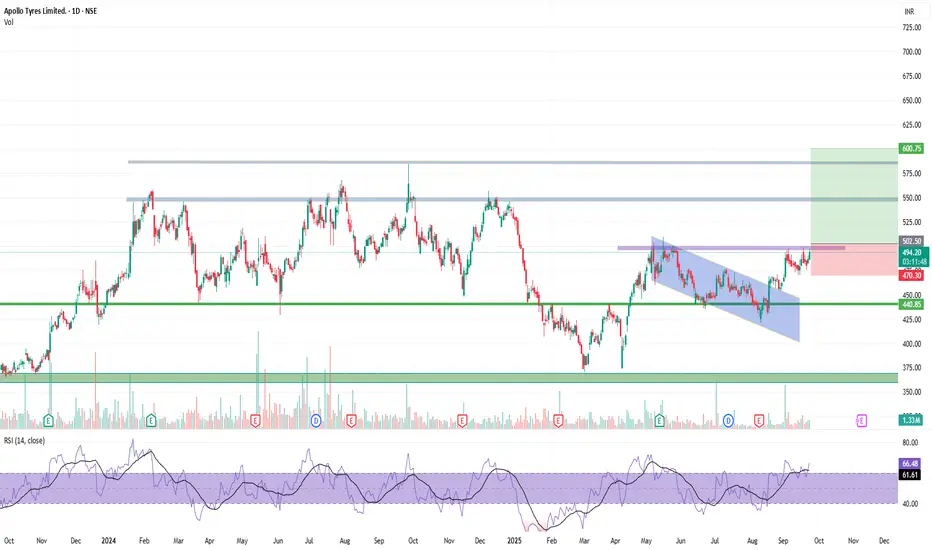
Apollo Tyres – Breakout from falling channel📈 Trade Idea: Apollo Tyres (NSE: APOLLOTYRE)
Chart Setup
Pattern: Breakout from a falling channel (bullish reversal structure).
Current Price: ₹493.35
Support Zone: ₹440 – ₹450 (strong historical demand zone).
Resistance Zone: ₹500 – ₹525 (short-term supply).
Indicators: RSI near 66, showing bullish momentum but not yet overbought.
📊 Trade Plan
Entry Zone: Around ₹490 – ₹495 (current breakout retest).
Stop Loss: Below ₹475.55 (recent swing low & invalidation level).
Target 1: ₹525 (intermediate resistance).
Target 2: ₹600+ (major resistance & measured move from channel breakout).
⚖️ Risk–Reward Setup
Risk (SL): ~₹18 per share.
Reward (Target 2): ~₹107 per share.
Risk:Reward Ratio: ~1:6 (favorable).
📌 Technical View
Breakout from descending channel with volume confirmation.
Price holding above 200-day EMA.
RSI momentum bullish, still room to move higher.
Strong demand zones protecting downside risk.
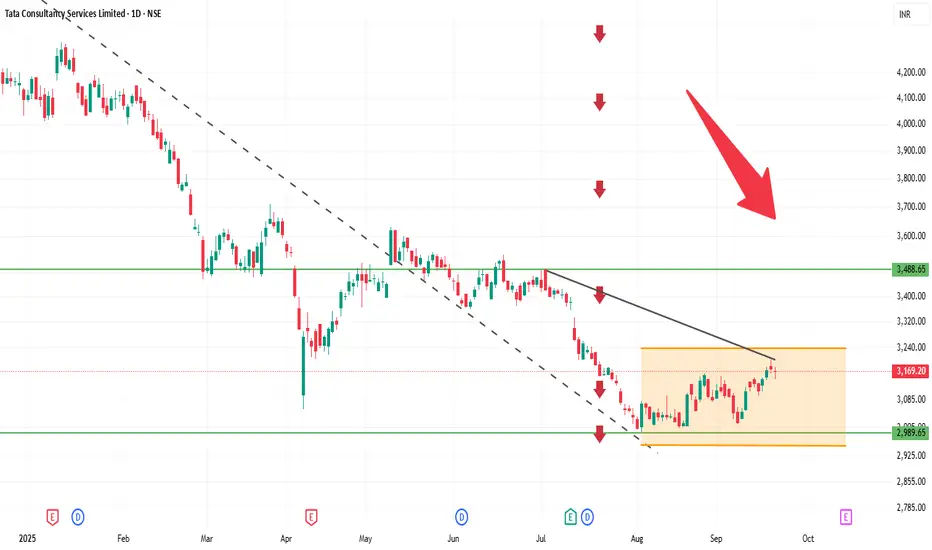
TCS 1D Time frameCurrent Price: Around 3,174
Current Trend: Stock is in a sideways to slightly bullish phase after consolidation.
Support Zone: Strong support at 3,140 – 3,150. Buyers may defend this level.
Resistance Zone: Key resistance at 3,200 – 3,220. A breakout above 3,220 can trigger fresh upside.
Indicators: Daily candles indicate mild buying interest; volume is stable.
Outlook:
Above 3,220 → bullish momentum may extend toward 3,250+.
Below 3,140 → weakness may push toward 3,100–3,120.
👉 In short:
Range: 3,140 – 3,220.
Neutral to slightly bullish; breakout will determine next move.
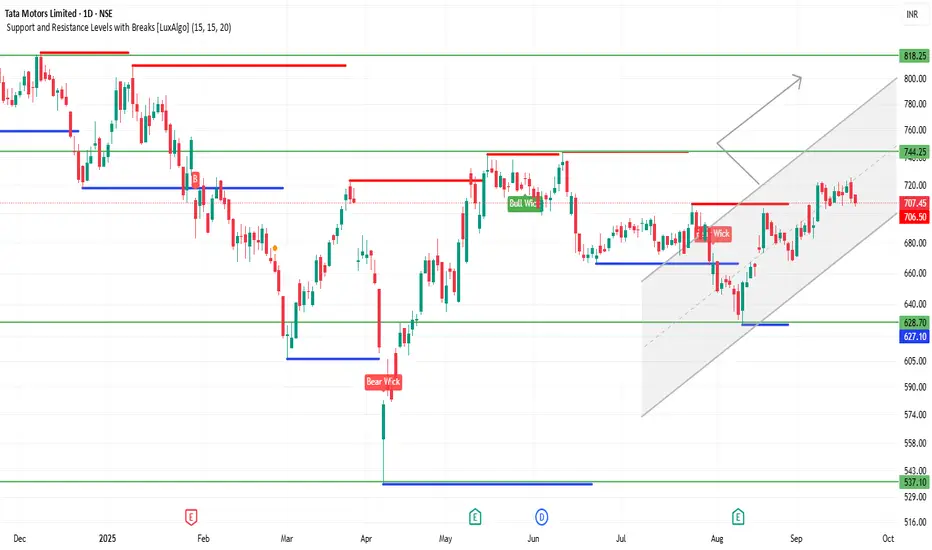
TATAMOTORS 1D Time frameCurrent Price: 707
Current Trend: Strong bullish momentum; stock is trading near recent highs.
Support Zone: Immediate support at 695 – 700. If this holds, uptrend remains intact.
Resistance Zone: Next resistance at 720 – 730. A breakout above this can push toward 750+.
Indicators: Daily candles are bullish, showing higher highs and strong buying interest.
Outlook:
Above 720 → continuation of bullish rally likely.
Below 695 → minor correction possible toward 680–685.
👉 In short (with 707 current price):
Bullish tone.
Range to watch: 695 – 730.
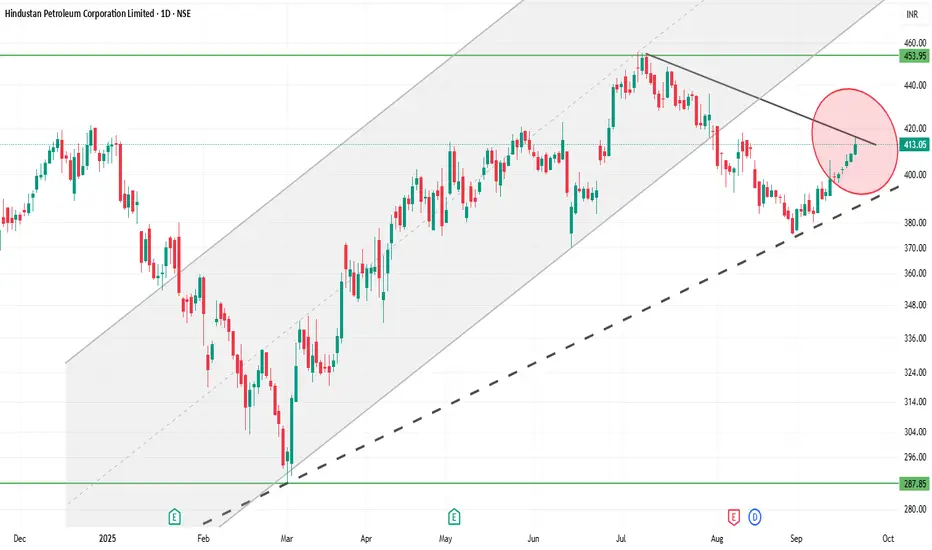
HINDPETRO 1D Time frameCurrent Price: 413
Current Trend: Strong bullish momentum; stock is trading near recent highs.
Support Zone: Immediate support at 405 – 410. If this holds, uptrend remains intact.
Resistance Zone: Next resistance at 420 – 425. A breakout above this can push toward 435+.
Indicators: Daily candles are bullish with strong buying interest; higher highs and higher lows visible.
Outlook:
Above 420 → continuation of bullish rally likely.
Below 405 → minor correction possible toward 395–400.
👉 In short (with 413 current price):
Bullish tone.
Range to watch: 405 – 425.
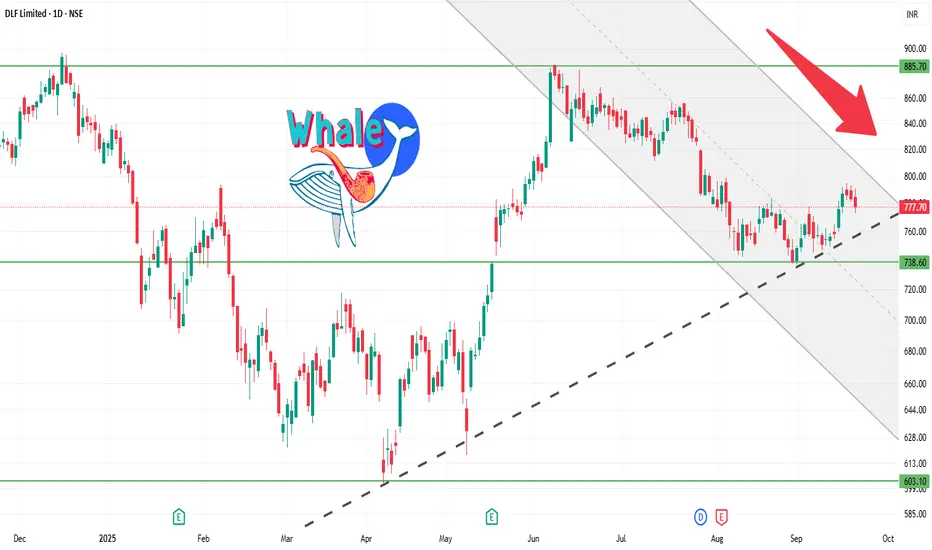
DLF 1D Time frameCurrent Price: Around 780 – 790.
Current Trend: Stock is in a strong uptrend, consolidating after recent highs.
Support Zone: Strong support at 770 – 775. Buyers are likely to defend this level.
Resistance Zone: Key resistance at 800 – 810. A breakout above this can lead to fresh upside.
Indicators: Daily candles show higher lows forming, indicating strength; volumes are healthy.
Outlook:
Above 810 → bullish momentum may continue toward 830+.
Below 770 → weakness may drag it toward 750.
👉 In short:
Tone: Bullish with consolidation.
Range: 770 – 810.
Shall I also prepare a re
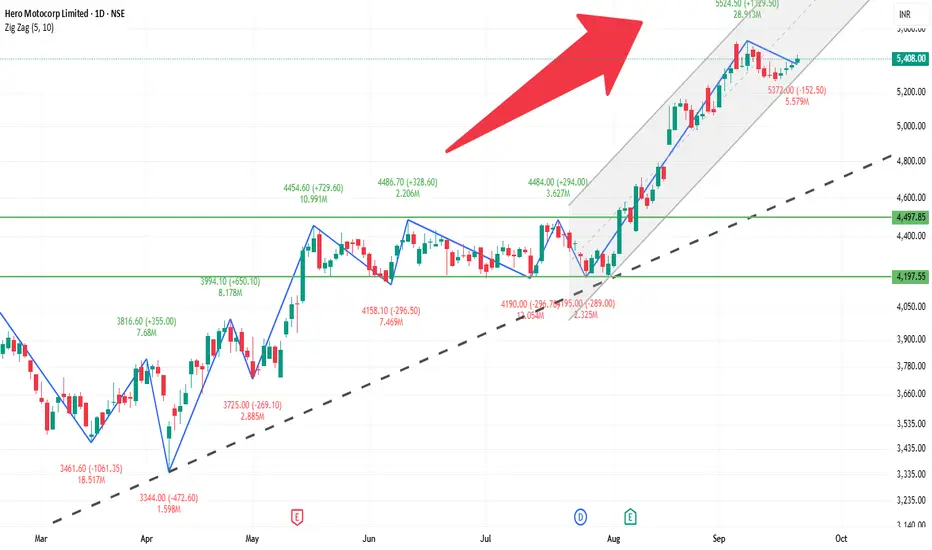
HEROMOTOCO 1D Time frameCurrent Price: 5,408 (near recent highs).
Current Trend: Strong bullish momentum; stock is trading above key resistances.
Support Zone: Immediate support at 5,300 – 5,350. If this holds, uptrend remains intact.
Resistance Zone: Next resistance is around 5,500 – 5,550. A breakout above this can push toward 5,650+.
Indicators: Daily candle structure is bullish, showing higher highs and strong buying interest.
Outlook:
Above 5,500 → continuation of bullish rally.
Below 5,300 → minor weakness; may slip toward 5,200.
👉 In short (with 5,408 price):
Bullish tone.
Range to watch: 5,300 – 5,550.
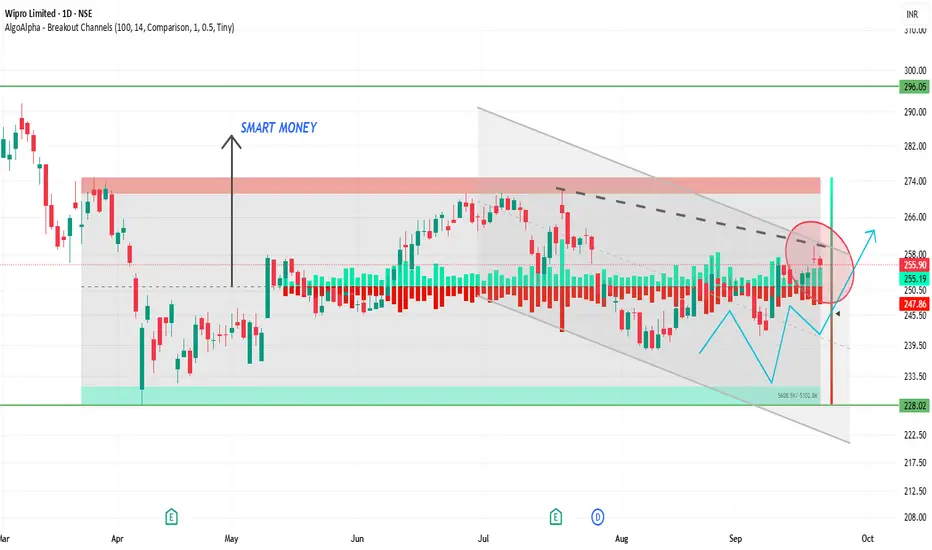
WIPRO 1D Time frameCurrent Price: WIPRO is trading near the 520 – 525 zone (recent levels).
Current Trend: Stock is moving sideways after a sharp move earlier, showing consolidation.
Support Zone: Strong support at 510 – 515. Buyers likely to defend this area.
Resistance Zone: Key resistance around 530 – 535. A breakout above 535 can lead to upward momentum.
Indicators: Daily candles indicate indecision; volumes are stable, showing accumulation at lower levels.
Outlook:
Above 535 → bullish momentum possible toward 550+.
Below 510 → weakness may extend toward 495.
👉 In short:
Range: 510 – 535.
Neutral to bullish tone if it breaks above resistance.
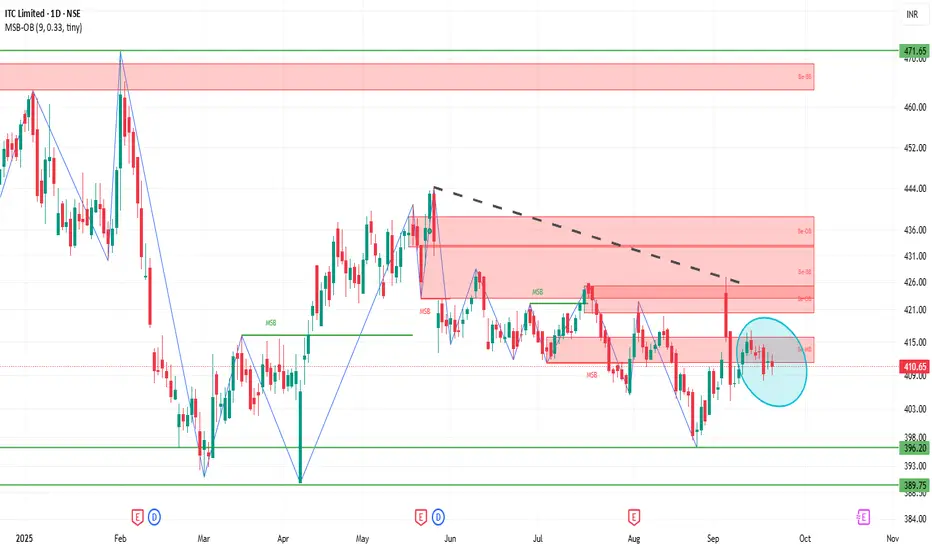
ITC 1D Time frameCurrent Price: Please confirm, but ITC is trading near 440–445 zone recently.
Current Trend: Stock is in consolidation after a recent decline; sideways movement visible.
Support Zone: Strong support lies at 435 – 438. If this holds, stock may bounce.
Resistance Zone: Major resistance is around 450 – 455. A breakout above 455 can bring fresh upside.
Indicators: Daily candles show buyers trying to defend lower levels, but volume is moderate.
Outlook:
Above 455 → bullish momentum may return.
Below 435 → weakness can extend toward 425.
👉 In short:
Range: 435 – 455.
Neutral tone, waiting for breakout.
SENSEX 1D Time frameCurrent Trend: Still sideways to mildly bullish, but trading closer to support levels.
Support Zone: Now the strong support shifts to 82,300 – 82,500. If this zone holds, bounce is possible.
Resistance Zone: On the upside, watch 83,200 – 83,500 for resistance. Breakout above this can push price higher.
Indicators: Daily candle suggests consolidation; buyers defending 82,300 zone.
Outlook:
Above 83,500 → fresh bullish momentum likely.
Below 82,300 → weakness can extend further.
👉 In short (based on 82,626 level):
Range: 82,300 – 83,500.
Market neutral, waiting for breakout either side.

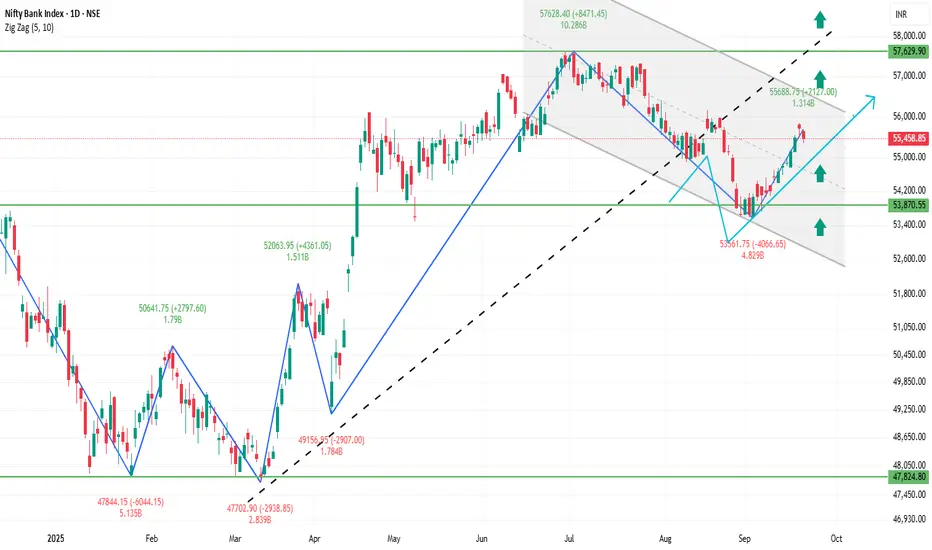
BANKNIFTY 1D Time frameCurrent Trend: BANKNIFTY is showing consolidation with mild bullish bias.
Support Zone: Strong support lies near 55,200 – 55,400. If this holds, buyers may remain active.
Resistance Zone: Key resistance is around 55,800 – 56,000. A breakout above this can bring strong momentum.
Indicators: Daily structure is stable; candles show demand near support zones.
Outlook:
Above 56,000 → fresh rally possible.
Below 55,200 → weakness can extend.
👉 In short:
Sideways to bullish.
Strength above 56,000, weakness below 55,200.
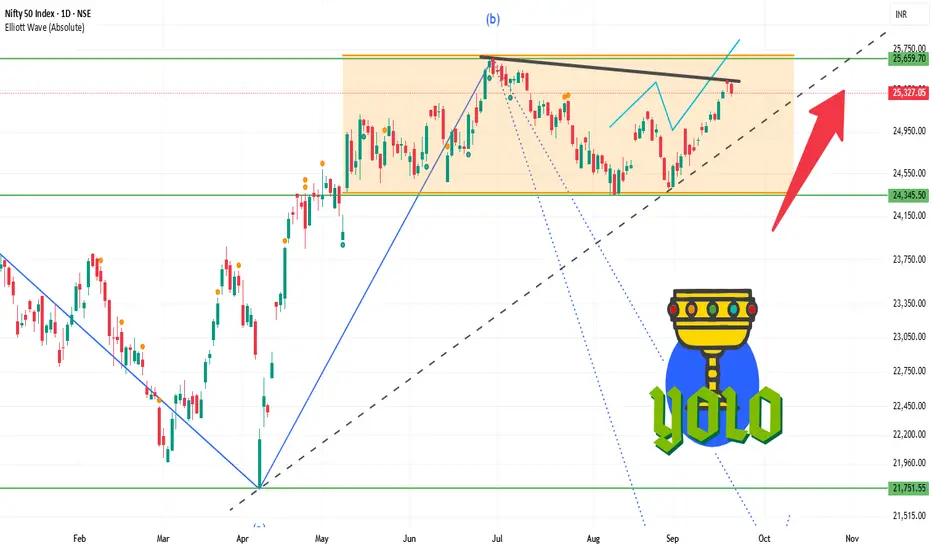
NIFTY 1D Time frameCurrent Trend: Market is moving sideways with limited momentum.
Support Zone: Strong support is around 25,200 – 25,250; bounce is possible from here.
Resistance Zone: If NIFTY sustains above 25,350 – 25,400, fresh upward momentum may come.
Indicators: Daily candle shows buyers are slightly in control, but resistance breakout is important.
Outlook: As long as NIFTY holds above 25,200, the uptrend remains safe. A close above 25,400 can trigger new buying.
👉 In short:
Sideways to bullish tone.
Weakness below 25,200, strength above 25,400.