Hemi 4H Bullish Play • Pair: HEMI/USDT (Perpetual Futures)
• Timeframe: 4H (4-hour chart)
• Current Price: Around 0.03724 USDT
• Price Movement:
• The price is consolidating just below a resistance zone at 0.0402 – 0.0403.
• A recent bullish push attempted to break this level but got rejected.
• The support zone is near 0.0369 – 0.0370.
• Chart Setup:
• A long position trade is set up with entry around 0.0372 USDT.
• Stop Loss: Around 0.0369 USDT (tight SL just below support).
• Target (TP): Extends upward to nearly 0.085 USDT (suggesting a high reward-to-risk ratio).
• Indicators:
• Moving averages (yellow, red, blue lines) are starting to slope upward, suggesting bullish momentum.
• Volume spikes show active trading interest around the breakout attempts.
• Observation:
• If the price breaks and sustains above 0.0403, strong bullish momentum could follow.
• If rejected again, it may retest 0.0369 – 0.0370 support.
Search in ideas for "INDICATORS"

Bearish Trade Setup for SOLUSDOverview:
This is a short position on SOLUSD, entering on the 1-hour chart with a well-defined risk-to-reward ratio. The trade is based on a downward trend confirmed by the price action and EMAs, making this a high-probability bearish scenario.
Key Levels and Indicators:
Entry Point: 186.6736
The entry is triggered when the price moves below the resistance level. This confirms the continuation of the downtrend.
Stop Loss: 202.2042
The stop loss is set above the most recent swing high to protect from any sudden price reversals. This level is designed to avoid a whipsaw and ensures the trade is kept within a reasonable risk range.
Target: 155.5356
The target is calculated based on a projected price movement in line with the current trend. Given the current market structure, this target provides an optimal reward-to-risk ratio.
Why is this a Bearish Setup?
Trend Confirmation:
The price has been consistently moving lower, showing strong bearish momentum. The EMAs (9 and 20) are also sloping downwards, reinforcing the likelihood of further downside movement.
Price Action:
The recent price action has formed lower highs and lower lows, a key indication of a strong downtrend.
EMA Alignment:
The 9-period EMA (188.6387) is below the 20-period EMA (192.3233), a classic bearish crossover that confirms the downward bias of the market.
Risk-to-Reward Setup:
The trade offers an excellent risk-to-reward ratio of approximately 1:3, which ensures that potential profits outweigh the risk taken on the trade.
Trade Management:
Entry Criteria: Enter the position when the price breaks below the support zone, ideally near the entry point.
Exit Strategy: Target is set at 155.5356, but keep an eye on the price action in case a trend reversal occurs before hitting the target. Always adjust the stop loss to lock in profits as the price moves in your favor.
Final Thoughts:
This is a well-structured bearish trade idea based on both technical analysis and price action. Always ensure that you follow proper risk management rules and adjust your stop loss or take profit levels based on market conditions.

Mina 2H LongPair: MINA/USDT Perpetual Contract
• Timeframe: 2 hours
• Current Price: ~0.1822 USDT
• Indicators:
• EMA (likely short-term, e.g., EMA 9 & 20)
• Volume profile below
⸻
🔹 Key Observations
1. Descending Trendline:
• A downward sloping resistance line is drawn from August highs.
• Price is consolidating below this line, suggesting a possible breakout attempt.
2. Support Zone:
• Strong horizontal support near 0.1810 – 0.1709 (marked in red).
• This zone has been tested multiple times, showing buyer defense.
3. Resistance Levels (Upside Targets):
• 0.1991 – first resistance after breakout.
• 0.2055 – 0.2215 – mid-range resistance cluster.
• 0.2365 – major resistance zone.
• 0.2950 – 0.3126 – extended upside target area.
4. Trade Setup (Highlighted Box):
• Entry: Around 0.1822 (current price).
• Stop-loss: Below 0.1570 (strong support breakdown).
• Take-Profit (TP): Staged at resistance zones up to ~0.2950.
5. Risk/Reward:
• Favorable R:R as the stop is tight compared to higher upside potential.
⸻
🔹 Bias
• Bullish Setup: If price breaks above the descending trendline and holds above 0.1900–0.1990, it could trigger a rally toward 0.22 → 0.2365 → 0.29.
• Bearish Risk: If 0.1709 – 0.1570 breaks, the next downside level is around 0.1450 (previous low).

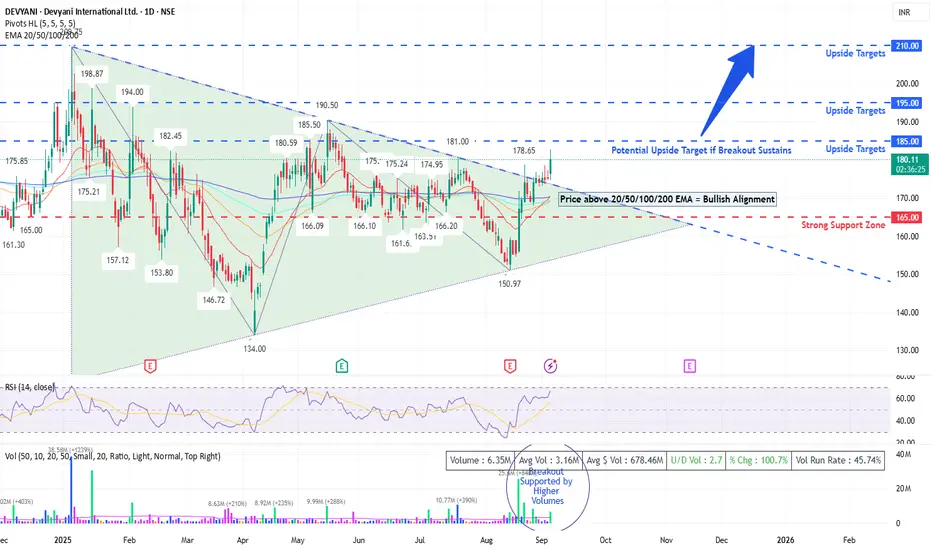
DEVYANI - TRINGLE BREAKOUTDevyani Intl – Triangle Breakout Loading? 🚀
📊 Stock Analysis: Devyani International Ltd (NSE: DEYANI)
🔹 Technical Overview
Pattern: Symmetrical Triangle breakout attempt visible on daily charts. Price has tested the upper resistance trendline multiple times (₹190–₹195 zone) and is now trading above short-term EMAs.
Key Support Levels : ₹165, ₹150
Immediate Resistance Levels: ₹185, ₹195 (major breakout zone)
Indicators:
RSI (14): 66.5 → Positive momentum, but near overbought levels.
EMA Cluster (20/50/100/200): Price trading above all key EMAs – strong short-term bullish signal.
Volume: Breakout supported with above-average volumes (5.3M vs 3.1M avg).
➡️ A sustained close above ₹185–₹190 could trigger a rally towards ₹200–₹210.
🔹 Fundamental Snapshot
Business Model: Devyani International Ltd is the largest franchisee of Yum! Brands in India, operating KFC, Pizza Hut, and Costa Coffee.
Growth Drivers:
Rapid store expansions (targeting Tier II/III cities).
Rising QSR demand in India with improving urban disposable income.
Long-term industry tailwinds in organized food retail.
Risks:
Margin pressures due to inflation in raw materials.
Intense competition in QSR space (Domino’s, McDonald’s, Burger King).
High dependence on discretionary consumer spending.
🔹 Trading Strategy
Short-Term (1–3 weeks): Buy on dips near ₹170–₹175, SL below ₹165. Target: ₹190 / ₹200.
Medium-Term (2–3 months): If breakout above ₹195 holds with volume, positional target can be ₹220+.
Risk Management: Keep SL below triangle support (₹160) for positional trades.
🔹 Sentiment & Outlook
📈 With improving consumer demand and strong expansion plans, Devyani remains a long-term growth story in India’s QSR sector. Current technical setup indicates a potential breakout rally if momentum sustains above ₹185–₹190.
⚡ Conclusion:
👉 Stock is at a make-or-break zone. Sustained move above ₹190 could unlock fresh highs, while failure may keep it in consolidation within the triangle.
RLC going goodPrice was consolidating below a descending trendline (blue). It has now broken above it with momentum, suggesting a bullish breakout.
• Entry Zone:
Current price is around 1.3480 USDT after reclaiming the breakout area. The long entry zone starts above this breakout.
• Stop-Loss Zone (Red Area):
Placed below 1.3100 – 1.2500 USDT, with deeper support around 1.1770. This covers previous consolidation lows, protecting against false breakouts.
• Target Zone (Green Area):
The first target is around 1.4085 USDT (near resistance).
The major target is 1.6296 USDT, extending up toward 1.72 USDT (previous highs).
• Risk-to-Reward (RR):
The setup looks to be a high RR trade, aiming for more than 2–3x reward compared to the risk zone.
• Indicators:
Short EMA (yellow) has crossed above the longer MA (blue), confirming bullish momentum. Volume has also picked up on the breakout, which strengthens the setup.
👉 Overall: This is a bullish breakout trade with stop-loss protection below recent supports and upside targets toward 1.62–1.72 if momentum continues.

Yatharth Hospital & Trauma Care Services Ltd. 4 Hour View4-Hour Time-Frame View – Technical Snapshot
While many platforms don’t provide a dedicated 4-hour technical summary, we can still glean insights from related intraday data—particularly from platforms like Investing.com (5-hour view) and TopStockResearch’s 4-hour-specific metrics.
Investing.com (5-Hour, closest available proxy)
Technical Summary (5-Hour): Strong Buy
Overall Summary (5 Hrs → Strong Buy) indicates strong upward momentum even over shorter intraday frames
TopStockResearch (4-Hour TSR Strength Index)
This platform provides a more granular “4-Hour” breakdown:
TSR Strength Index: Strong Bullish — YATHARTH is more bullish than 97–98% of stocks
Indicators:
RSI: ~69–70 → Buy
MACD: ~20 → Buy
ADX: ~36 → Buy
Stochastic: ~42 → (Neutral or Buy range)
ROC: ~4–5 → Buy
Supertrend: ~647 → indicating upward trend
Williams %R: Slightly negative (near overbought region)
CMF (Chaikin Money Flow): Positive (~0.13) → Buying pressure
PSAR: ~674
These inputs together reinforce a strong bullish bias over the 4-hour window
Pivot Levels (Intraday / 4-Hour Range)
TopStockResearch provides intraday pivot level analysis:
Current Price (~₹749) is trading above all primary resistance levels—including R3 (Classic), Camarilla R4, Fibonacci R3, Woodie’s R2, and DeMark R1, signaling a robust intraday breakout

BTC LONG AND HAVING SUPPORT OVER THE CHANNEL Chart Overview
• Pair/Timeframe: BTC/USDT – 4H
• Exchange: Bitget
• Pattern: Breakout from a falling wedge / descending channel, shifting momentum bullish.
• Indicators:
• EMA 9 (yellow) and EMA 20 (blue) are crossing bullishly.
• Volume spike supports the breakout.
⸻
Price Action
• BTC broke out of the descending trendline (blue) and retested support before moving higher.
• Currently trading at 110,780 USDT (+1.46%).
• Strong bullish momentum is visible with higher lows forming since Aug 31.
⸻
Trade Setup
• Entry: Around breakout zone (near 110,000 – 110,500).
• Stop Loss (SL): Below 108,500 zone (highlighted red zone).
• Targets:
• TP1: 114,658 USDT
• TP2: 115,980 USDT
⸻
Key Levels
• Immediate Support: 109,383 – 108,534
• Major Support Zone: 107,200 – 107,386
• Immediate Resistance: 111,998 – 113,217
• Target Resistance: 114,658 (TP1) and 115,980 (TP2)
• High Reference: 117,340 – 117,345
⸻
✅ Summary: BTC has broken out of a falling wedge on the 4H chart with strong bullish confirmation. If price sustains above 110k, it could move toward 114.6k (TP1) and 116k (TP2). Losing 108.5k support would invalidate this bullish setup.

XAU/USD 4H – Strong Breakout from ConsolidationGold has broken out above its descending resistance line and is now trading at $3,447, reaching fresh highs. The breakout also cleared the key resistance at $3,409, turning it into immediate support.
📈 Price is well above the 200 EMA ($3,357), confirming strong bullish momentum.
📊 Indicators:
RSI (14): At 81, showing overbought conditions — momentum is strong, but a short-term pullback cannot be ruled out.
ADX (14): At 34, indicating a strengthening trend.
🔺 Bullish Scenario: As long as Gold holds above $3,409, continuation towards $3,460 and beyond remains likely.
🔻 Bearish Scenario: A rejection at current highs could trigger a retest of $3,409 or even the EMA zone near $3,357.
⚡ Momentum favors the bulls, but caution is warranted with RSI in overbought territory.

ETH/USD 4H – Losing Momentum at Key LevelsEthereum is struggling to hold above its ascending trendline after rejection from the $4,800–$4,880 resistance zone. Price is currently trading around $4,395, sitting just above support at $4,186 and $4,066.
📉 ETH has broken below its short-term uptrend while the 200 EMA ($4,184) now acts as a crucial support zone. A breakdown below this level could accelerate downside pressure.
📊 Indicators:
RSI (14): Around 42, showing bearish momentum with room for further downside before oversold levels.
ADX (14): At 26, indicating a weakening trend strength compared to previous moves.
🔻 Bearish Scenario: Failure to defend $4,184–$4,066 could open the door for deeper retracements.
🔺 Bullish Scenario: A reclaim of the descending trendline and $4,792 resistance would be the first sign of recovery.
⚡ ETH is at a decision point — support retest or deeper correction.

BTC/USD 4H – Testing Key SupportBitcoin continues its downtrend after rejection from the $120K zone, trading below the 200 EMA and respecting the descending trendline.
🔻 Price is currently hovering around $108.5K, with immediate support at $107.3K. A breakdown below this level could expose further downside towards $106K.
🔺 On the upside, resistance lies at $112K, aligning with the descending trendline and the 200 EMA — making it a critical level for bulls to reclaim.
📊 Indicators:
RSI (14): Hovering near 40, showing bearish momentum but nearing oversold territory.
ADX (14): At 31, suggesting the current downtrend still has strength.
⚡ Watch for either a bounce from support for a potential relief rally, or a breakdown continuation towards lower levels.

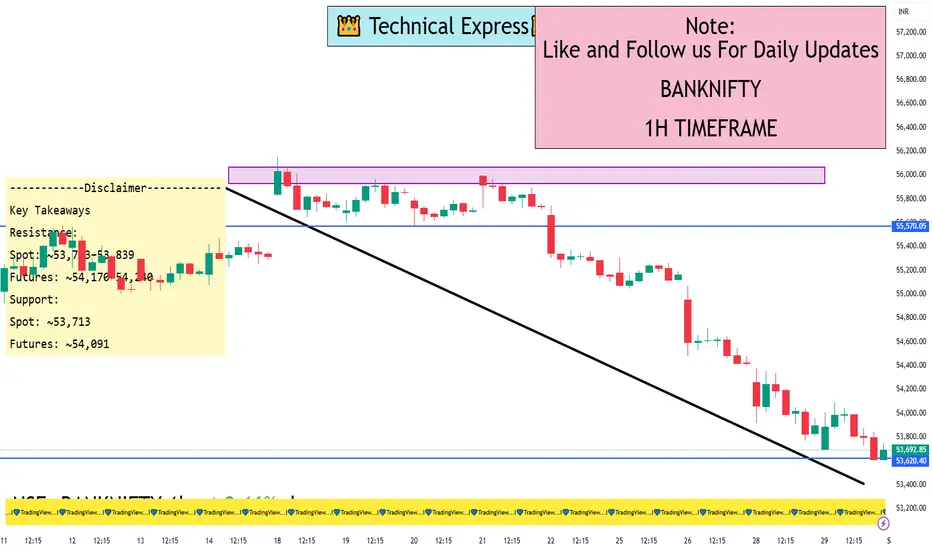
Bank Nifty Index 1 Hour ViewHourly Technical Summary (as of August 29, 2025, ~10:00 AM GMT)
Investing.com’s “Nifty Bank (NSEBANK)” technicals on the hourly chart show:
Overall Summary: Strong Sell
Moving Averages: 12 out of 12 (both Simple and Exponential across various periods) suggest Sell
Key Indicators:
RSI (14): ~25 – Sell
Stochastic oscillator: Overbought
MACD: Sell
ADX: Strong Sell (indicating trending weakness)
Other metrics (CCI, ROC, Bull/Bear Power) – mostly Sell
Pivot-levels (Hourly):
Classic:
S1: 53,713
Pivot: 53,783
R1: 53,839
Fibonacci: similar to above
Camarilla: tighter range around 53,783
How to Use This
Short-term traders might look to enter on bounces near the resistance end of the range with tight stop-loss, targeting support.
Breakout traders should watch if support breaks — could see accelerated decline — or if resistance is broken with volume, signaling possible reversal.
Risk management is key given mixed oscillator readings and macro volatility.
Do keep in mind:
These are technical snapshots as of August 29, 2025. If you're looking for real-time or updated levels, regularly check live tools like TradingView, Investing.com, or your trading platform.
Always blend technical levels with broader market context and risk tolerance before taking action.
ETHUSD Harmonic Pattern AnalysisPattern Analysis
• The chart identifies a possible harmonic pattern (likely a Bat or Gartley) with labeled points X, A, B, C, and a projected D.
• Crucial level noted at USD, referred to as “Eye of the Harmonic,” representing a significant support/resistance.
• The chart suggests, “Harmonic D can be Tested if pt B Breaks,” implying bearish potential if the price drops below point B.
• Current ETHUSD price is 4,336, with a recent decline of about 3.88%, and visible moving averages providing trend context.
Key Technical Points
• Swing trading setup: Uses harmonic pattern recognition for potential entry/exit decisions.
• Resistance & Support zones: Eye of the Harmonic ( USD) and potential future support region near projected point D ( USD).
• Indicators: The chart overlays zone levels, moving averages, and pattern ratios (e.g., 0.523, 0.785, 1.194, 1.419), which are standard in harmonic pattern calculations.
Potential Scenario
• If price breaks below point B, traders may target the level indicated by point D for possible support or reversal opportunities.
• The scenario implies caution for long positions until the price confirms support above crucial harmonic levels.

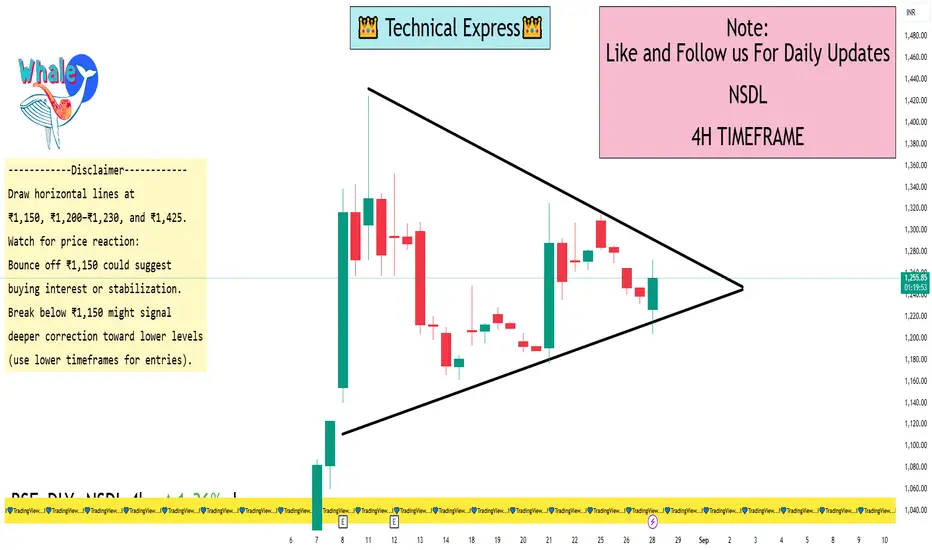
NSDL 4 Hour ViewKey Levels to Watch
Support Levels
₹1,150 — Analysts highlight this as a critical support. Post-Q1, NSDL dropped nearly 9% in two sessions, and ₹1,150 is seen as a potential line of defense. A break below may lead to sharper losses.
₹1,200–₹1,230 — Near the stock's current region (around ₹1,237), which can act as a short-term base due to recent consolidation and VWAP alignment.
Resistance Levels
₹1,425 — The recent all-time high reached after a strong post-IPO rally. Forms a clear resistance zone.
Technical Context & Market Sentiment
Recent Rally: NSDL surged ~78% from its ₹800 IPO price and ~62% from its ₹880 listing price, peaking near ₹1,425.
Profit Booking: The sharp decline post-Q1 earnings reflects investor caution and stretched valuations, reinforcing the significance of the ₹1,150 level.
How to Use These Levels on Your 4-Hour Chart
Draw horizontal lines at ₹1,150, ₹1,200–₹1,230, and ₹1,425.
Watch for price reaction:
Bounce off ₹1,150 could suggest buying interest or stabilization.
Break below ₹1,150 might signal deeper correction toward lower levels (use lower timeframes for entries).
Advances toward ₹1,425 could reignite bullish momentum if volume supports the move.
Combine with indicators:
Moving Averages (e.g., 20/50 EMA) — can offer dynamic support/resistance.
RSI/MACD — monitor for divergence or overbought/oversold conditions to time entries or exits.
Confirm before acting:
Look for candlestick signals (pin bars, engulfing patterns) around these zones.
Volume spikes on breakouts or bounces add conviction.
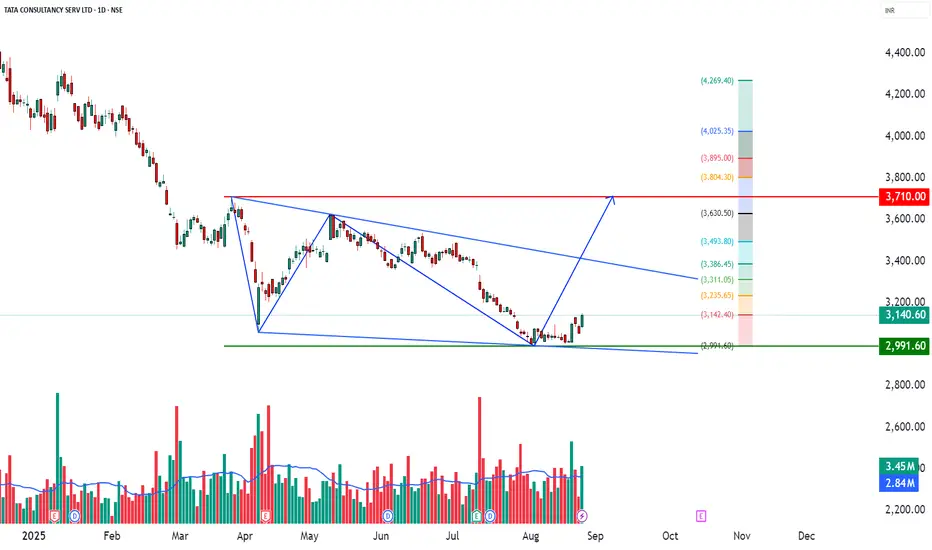
TCS – upport Bounce with Volume Confirmation📊 TCS – Technical & Educational Snapshot
Ticker: NSE:TCS | Sector: 💻 IT Services
CMP: ₹3,140.60 ▲ (+2.84% | 26 Aug 2025)
Learning Bias (for study purpose): ⭐⭐⭐ (Cautiously Bullish)
Pattern Observed: 📈 Support Bounce with Volume Confirmation
📰 Sentiment Analysis
👉 Overall Sentiment: Moderately Positive ✅
Bullish Drivers:
• Bounce from strong support near ₹3,000 with bullish candle & above-avg volume
• RSI breakout + Bollinger Band expansion → fresh buying interest
• Publicly available analyst reports indicate average estimates around ₹3,725; strong bullish case highlighted up to ₹4,610
• IT sector optimism for H2 FY26 earnings recovery
Risks (Bearish Case):
• Broader trend still marked Downtrend ⚠️
• Stochastic at 92 → overbought in short-term
• Employee layoffs & union protests (~12K–30K) may dampen sentiment
• Failure to hold ₹3,047 (support) could trigger deeper correction
Short-term Outlook: Upside momentum possible towards ₹3,160–3,200, but resistance supply zone must be watched.
Long-term Outlook: Positive — strong fundamentals, debt-free balance sheet, consistent dividends, and sector recovery cues.
📊 Technical Snapshot
TCS has formed a support bounce near the ₹3,000 bottom range, supported by a strong bullish candle and above-average volume.
Indicators: MACD bullish on daily/weekly, neutral-to-bearish on monthly.
RSI ~54 → healthy momentum without being overheated.
Trend direction still tagged as Downtrend, hence positional caution is advised.
📊 Volume Check
🔹 Current Volume: 3.45M
🔹 20 SMA Volume: 2.84M ✅
💥 Above-average participation → validates breakout reliability.
💡 Interpretation: Stronger demand from institutions/traders supporting price action.
💡 Learnings
Support bounces near psychological zones (₹3,000 in this case) often attract buying interest.
When combined with RSI breakouts, Bollinger Band expansion, and volume confirmation, the setup becomes more reliable.
However, overbought stochastic warns of possible near-term pullbacks — hence, stop-loss discipline is key.
📌 Key Levels
Resistance: 3,169 | 3,198 | 3,244
Support: 3,094 | 3,048 | 3,019
Fibonacci Reference Levels: 2,991 | 3,142 | 3,235 | 3,311 | 3,386 | 3,494 | 3,631
🎯 STWP Learning Reference
• Observed bounce zone: ~₹3,152
• Key support level: ~₹3,047
• Upside reference zones (if momentum continues): 3,200 | 3,244 | 3,310
• Pullback watch zone: 3,048–3,095
• Invalidation reference: Below 2,991 → momentum weakens
⚠️ Disclaimer – Please Read Carefully
This post is shared only for educational and informational purposes. It is not investment advice or a recommendation to buy/sell any security. I am not a SEBI-registered investment advisor. Please do your own research or consult a SEBI-registered advisor before making trading or investment decisions.
Trading and investing involve risk. Past performance or past setups do not guarantee future results. Always use stop-loss, proper position sizing, and risk management.
💬 Found this useful?
🔼 Boost this post to help more traders discover clean setups.
✍️ Share your thoughts, setups, or questions in the comments — let’s learn together.
🔁 Repost to spread awareness among traders & beginners.
✅ Follow simpletradewithpatience for clean charts, price action insights & beginner-friendly setups.
🚀 Stay Calm. Stay Clean. Trade With Patience.
Trade Smart | Learn Zones | Be Self-Reliant 📊
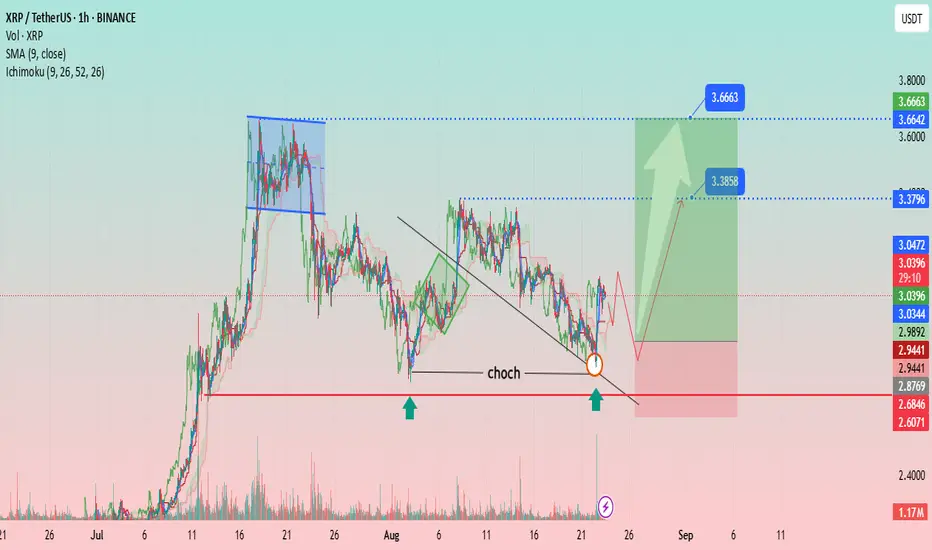
XRP/USDT – Bullish Reversal Setup After CHoCH BreakoutAnalysis:
The chart shows XRP/USDT (1H timeframe) developing a bullish structure after a Change of Character (CHoCH) confirmation near the $2.94 support zone. Price respected the key demand area (highlighted by green arrows) and broke above the descending trendline, signaling potential reversal momentum.
Support Zone: $2.94 – $2.87 (strong demand zone, price reacted twice).
Resistance Levels:
First target: $3.38
Second target: $3.66
Indicators:
SMA (9) at $3.04 – price hovering around it, suggesting early bullish strength.
Ichimoku showing potential cloud breakout aligning with bullish momentum.
Volume: Increasing at demand, indicating strong buyer interest.
Trade Plan:
Entry Zone: Around $3.00 – $3.05 (after retest confirmation).
Stop-Loss: Below $2.86 (invalidates setup if broken).
Targets:
TP1: $3.38
TP2: $3.66
Risk/Reward: Favorable, with potential 2:1 or higher depending on entry execution.
👉 This setup suggests that XRP may attempt a bullish continuation if support holds and volume sustains the breakout momentum.
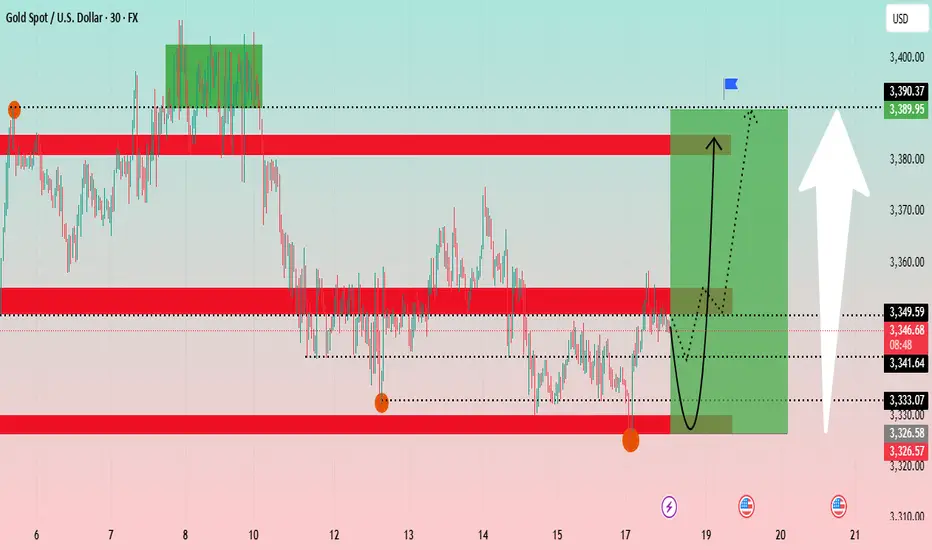
Gold Technical Analysis: Navigating Key Support ?The Gold chart shows a 30-minute timeframe analysis, highlighting recent price consolidation and potential future trends. The analysis suggests a potential V-shape recovery for gold.
Key Levels: The price is currently at a critical juncture, having tested a support zone around 3,326 - 3,333 USD. This zone has proven to be a strong base. Above it, a significant resistance zone is identified between 3,349 - 3,353 USD. Further up, another major resistance is at approximately 3,389 USD.
Price Action: The price has recently experienced a sharp decline and is now in a consolidation phase. The chart projects a potential bounce from the current levels, indicated by the black curved arrow, with the target being the upper resistance zone around 3,389 USD. The green shaded box illustrates the potential upward movement from the current position.
Conclusion: Gold appears to be at a key support level and could be poised for a rally if it successfully breaks above the immediate resistance zone.
Bitcoin (BTC/USDT) 4-Hour Chart Analysis
The Bitcoin chart shows a 4-hour timeframe analysis, focusing on a short-term uptrend channel.
Key Levels: The price is trading within an ascending channel. A significant support zone is identified between 112,000 - 114,000 USDT. A "weak supply zone" is marked around 118,000 USDT, which is currently acting as support. A major resistance is at approximately 124,564 USDT.
Price Action: After a strong push towards the channel's upper boundary, the price has pulled back and is now retesting the "weak supply zone." The blue and red arrows project two possible scenarios: a bounce back up towards the channel's high, or a deeper retracement towards the channel's lower trendline. The price movement appears to be following the blue projected path.
Indicators: The Ichimoku cloud and RSI strategy are used to confirm the trend and identify entry/exit points. The price is above the Ichimoku cloud, indicating a bullish trend.
Conclusion: Bitcoin is at a pivotal point within its uptrend channel. Its ability to hold the 118,000 USDT level will be crucial for a potential re-test of the 124,564 USDT resistance.
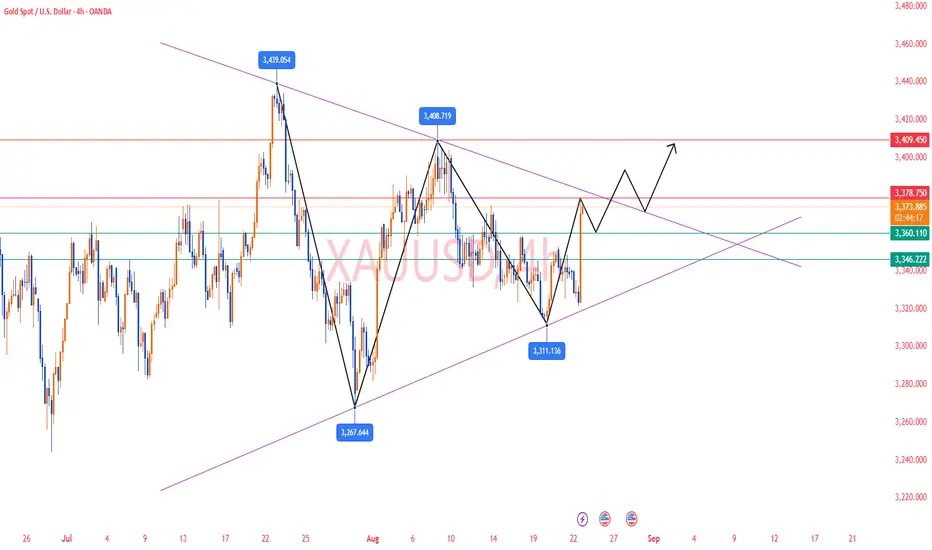
Gold Analysis and Trading Strategy | August 22✅ After a period of consolidation, gold posted a strong bullish candlestick today, sparking short-term bullish sentiment. Our buy positions placed in the 3323–3326 range also successfully gained nearly 300 pips. Overall, gold remains in a wide high-level consolidation range (around 3310–3400).
🔹 Moving Averages: MA5 and MA10 have formed a golden cross, but the price is still capped by MA20 and MA60, meaning the medium-term trend has not fully reversed yet.
🔹 Indicators: MACD shows a bullish crossover at the lows, but histogram momentum has not expanded; RSI is near the mid-range, reflecting strong competition between bulls and bears.
✅ On the 4-hour chart, gold rebounded sharply after bottoming at the 3311 level, reaching as high as 3378, but faced rejection at upper resistance. It is now consolidating between 3340–3375. The Bollinger Bands are slightly opening, and price is trading around the mid-band. If gold can hold above 3350–3360, it may continue toward 3375–3400. However, a drop below 3340 could trigger further downside risk.
🔴 Resistance Levels: 3380–3384
🟢 Support Levels: 3355–3360
✅ Trading Strategy Reference:
🔰 If price pulls back and holds at 3355–3360, consider light long positions, targeting 3375–3380.
🔰 If price rebounds to 3380–3385 and faces rejection, consider light short positions, targeting 3370–3360.
🔰 If price breaks above and holds 3375–3380, further upside toward 3400 is possible.
EUR/USD Bearish Trade Idea - Detailed Analysis** IF you like my observation, please boost and follow for more content."
Timeframe: 1 Hour
Entry Price: 1.16177
Stop Loss (SL): 1.16521
Take Profit (TP): 1.15763
Market Overview:
Trend Context: The EUR/USD pair is currently in a clear downtrend as indicated by the price action making lower highs and lower lows.
Chart Setup: The chart shows a descending triangle pattern, which typically signals a continuation of the bearish trend, as the price struggles to break through the resistance at the upper boundary while consistently making lower lows.
Trade Rationale:
Descending Triangle Pattern:
The formation of a descending triangle indicates a strong bearish bias, where the sellers have been consistently defending the resistance level.
The price is making lower highs and has found support at the 1.16177 level, a key point where the downtrend has previously gained momentum.
A breakdown from this triangle often leads to a continuation of the downward movement, reinforcing the bearish outlook.
Entry Setup:
The entry point at 1.16177 is set below the support level, confirming that the price is likely to break through and continue downward.
A close below this level would provide confirmation for the short position, as the breakdown indicates further downward potential.
Stop Loss Placement:
The Stop Loss (SL) is set at 1.16521, just above the last significant swing high and the trendline of the triangle. This allows for some room in case of a false breakout while minimizing risk if the price reverses above this level.
Take Profit Target:
The Take Profit (TP) is set at 1.15763, where the previous support has been observed. This level represents a logical exit point, based on the measured move of the triangle pattern and the market's reaction at this support area.
Risk-to-Reward Ratio (RRR):
This setup offers a favorable risk-to-reward ratio, with a stop loss of approximately 45 pips and a take profit target of approximately 114 pips. This results in an RRR of about 1:2.5, which aligns with a solid risk management strategy for a favorable trade.
Technical Indicators:
Exponential Moving Averages (EMA):
The chart indicates the use of EMAs, which are still in a bearish alignment. The price is below both the 9-period and 20-period EMAs, suggesting that the overall trend is downward.
The EMA setup confirms the bearish momentum, reinforcing the rationale for the short position.

EUR/USD Bearish Rejection at Resistance Zone – Target 1.15392📉 EUR/USD 1H Chart Analysis
Trend: The chart is showing a clear bearish trend inside a descending channel (support & rejection lines). Price continues to respect this downward structure.
Resistance Zone: A strong supply/resistance area is marked at 1.16148 – 1.16307 (highlighted in pink). Sellers are likely to defend this zone.
Indicators:
Price is trading below the 70 EMA and 200 EMA, confirming bearish momentum.
EMA crossover suggests continued downward pressure.
Price Action: Recently, a small pullback (yellow highlight) is visible after touching the lower boundary of the channel, indicating a short-term retracement before another bearish push.
Strategy:
📍 Entry: Look for short entries near the resistance zone (1.16148 – 1.16307).
⛔ Stop Loss: Above 1.16456 (previous high / EMA resistance).
🎯 Target: First target 1.15392, aligning with the projected channel support and marked demand area.
✅ Summary:
EUR/USD remains bearish as long as price stays below the EMAs and inside the descending channel. Expect rejection from the resistance zone and continuation to the downside toward 1.15392.

XRP/USD Trade Setup: Bearish Position on Technical AnalysisTimeframe: 1 Hour
Entry Price: 3.0229
Take Profit (TP): 2.8769
Stop Loss (SL): 3.1199
1. Market Overview
XRP is currently in a bearish phase, and the price action indicates that a downward continuation is likely. The market has been rejecting higher levels, with strong resistance at the 3.1777 zone, and now the price appears to be moving lower.
2. Entry Criteria:
The entry point is set at 3.0229, just below the current price level, where we anticipate the market to continue its downward movement after facing resistance at higher levels.
The recent price action shows a clear rejection from the upside, and we are expecting further downside once the price breaks below the immediate support near the entry.
3. Technical Indicators:
Heikin Ashi Candles: The chart uses Heikin Ashi candles, which help smooth the price action. The red candles indicate a bearish sentiment, confirming the continuation of downward pressure.
Volume Analysis: The increase in volume during the recent selling phase is confirming that the bears are in control and the trend may continue to the downside.
4. Support & Resistance Levels:
Resistance: The price is facing resistance around 3.1777, which has proven to be a significant level of rejection.
Support: The main support zone is located near the 2.8769 level, which coincides with our take profit (TP). This is a logical target as it aligns with previous lower levels and current trend structure.
5. Risk-Reward Ratio:
The Stop Loss is placed at 3.1199, just above the recent swing highs and resistance level, ensuring we limit risk in case of a market reversal.
The Take Profit is set at 2.8769, offering a solid risk-reward ratio of 1:1.5. This level is where we expect the price to find support and potentially reverse after hitting the target.
6. Trade Management:
Monitor Resistance Level: If the price fails to break below the entry and starts moving upward, consider adjusting the stop loss or exiting the position to limit losses.
Trailing Stop: Once the price starts moving in your favor, consider implementing a trailing stop to lock in profits as the price moves lower.
7. Potential Risks:
False Breakdown: A false breakdown is always a risk, where the price could temporarily dip below the support and reverse, hitting the stop loss before continuing lower.
Market Volatility: Be mindful of the inherent volatility in the crypto market, which can lead to sudden reversals due to news or other external factors.
8. Conclusion:
This trade setup is based on a bearish market structure, where price is showing clear resistance and the potential for further downward movement. The setup is logical with a strong risk-reward ratio and a clear target for profits. As always, risk management is crucial, and it's important to monitor price action closely for any signs of reversal.
Good luck, and trade carefully!

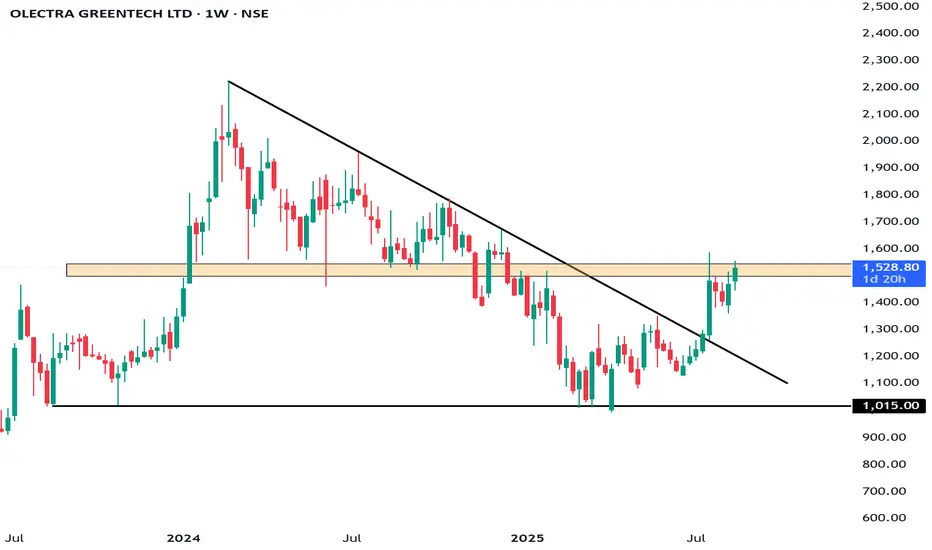
Olectra Greentech – The Silent EV Multibagger in MakingNSE:OLECTRA
📊 Technical Analysis (Weekly Chart)
Trend: The stock had a steep fall from ~₹1,800 (2024 highs) to ~₹1,000 (2025 lows). It has since formed a rounded bottom and is showing signs of reversal.
Current Price: ₹1,528.80
Resistance Levels:
₹1,600 (immediate resistance)
₹1,800 (major breakout level)
Support Levels:
₹1,400 (nearby support)
₹1,200 (major support, recent bottom area)
Indicators:
Momentum improving with strong green candles and higher lows.
Weekly structure suggests accumulation and potential trend reversal.
View: If stock sustains above ₹1,600, it can retest ₹1,800–₹2,000 in medium term.
🏭 Fundamental Analysis
Business Model: Olectra Greentech is India’s largest electric bus manufacturer, part of MEIL (Megha Engineering). It also works on tippers, EV trucks, and composite insulators.
Growth Drivers:
Government’s push for EV adoption in public transport (FAME-II scheme).
High demand for electric buses from state transport corporations.
Strong backing from parent MEIL ensures execution capacity.
Financials (Latest FY24/25) (approximate):
Revenue: ~₹1,300–1,400 Cr (growing rapidly with order wins).
Profit: Still moderate due to high R&D and capex.
Order Book: Over ₹12,000+ Cr, ensuring visibility for next 3–4 years.
Strengths:
Market leader in EV bus space.
Rising government contracts.
First-mover advantage.
Risks:
Execution delays (delivery timelines).
Intense competition from Tata Motors, Ashok Leyland.
Margin pressure due to high input and battery costs.
🎯 Conclusion
Technical View: Bullish reversal forming. Sustaining above ₹1,600 can lead to ₹1,800–₹2,000. Strong support at ₹1,200.
Fundamental View: Strong long-term growth story in India’s EV transition, backed by large order book and government support. Near-term volatility possible, but structurally a good EV play.
👉 Investor Stance:
Investors: Accumulate gradually for 3–5 years; could be a multibagger if execution sustains.
⚠️ Disclaimer:
This analysis is for educational and informational purposes only.
We are not SEBI-registered analysts or advisors.
This is our personal view based on available data and market trends.
Please consult your SEBI-registered investment advisor before making any investment or trading decisions.
You are solely responsible for any financial decisions you make based on this content.
========================
Trade Secrets By Pratik
========================
Kaynes Technology is at a crucial breakout zone:
Setup: Price consolidating within a symmetrical triangle, now testing the upper trendline.
Indicators:
RSI ~58, just entering bullish zone, but not overbought.
MACD turning positive → momentum aligning with trend.
EMAs: 20 & 50 EMA aligned upward; price holding above 6,000.
Levels:
Targets: ₹6846 , ₹7,203, ₹7711
Stoploss: ₹6190
👉 Outlook: Break and sustain above ₹6,500 can trigger fresh momentum towards ₹7,000+. Support at ₹6190 is critical.

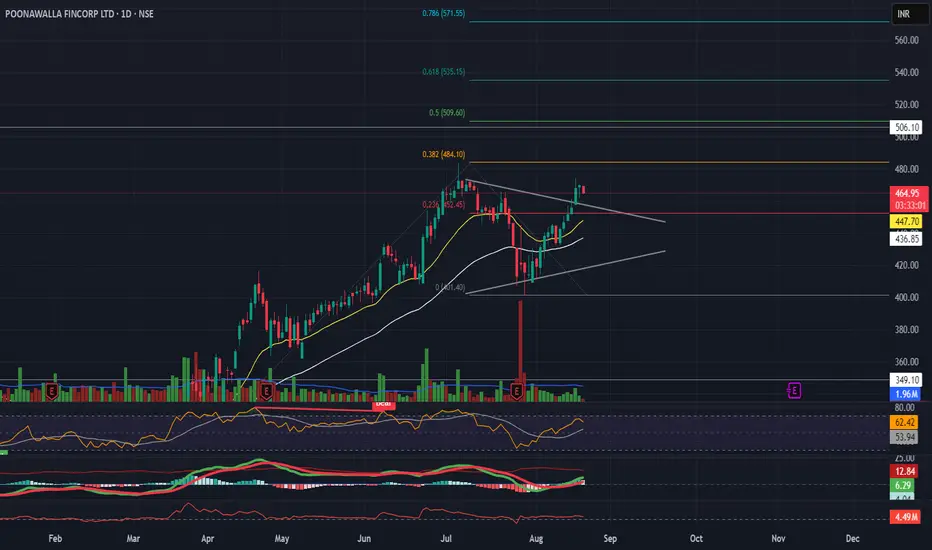
Poonawalla Fincorp showing a symmetrical triangle breakout:
Setup: Clear breakout above trendline resistance on daily chart.
Indicators:
RSI at 62 → momentum strong, near overbought but not overheated.
MACD bullish crossover with positive histogram.
EMAs: 20 & 50 EMA slope positive; price sustaining above both.
Levels:
Stoploss: ₹445
Targets: ₹509 immediate, then ₹535
👉 Outlook: Strong bullish bias. Sustaining above ₹473 opens path towards ₹500–506 zone. Support at ₹445.