Rossari Biotech – Stage 4 Ending? Stage 1 Base in Play!🧪 NSE:ROSSARI – 📉 Stage 4 Ending? Stage 1 Base in Play!
🕵️♂️ Technical Context
Rossari has been in a Stage 4 decline since its 2021 peak. But now it’s forming a solid Stage 1 base between ₹650–720, with signs of smart accumulation emerging.
🧩 Business Model Snapshot
🧵 Segments: Textile Chemicals, HPPC, Animal Nutrition
🛒 New Growth: Institutional & B2C (₹299 Cr, +67% YoY)
🌍 Markets: Strong domestic base, expanding in Middle East & SE Asia
🤝 Client Spread: Diversified, no over-reliance
🎙️ Management Commentary
⚙️ Focus on margin normalization across verticals
📊 Base EBITDA margin ~15% (excl. new segments)
🌐 FX risk control via new geographies (Egypt, Turkey, SE Asia)
🧱 Scaling up I&B2C as a future margin driver
📈 Trend Overview
📆 Monthly: Ending Stage 4 — beginning Stage 1 base
📉 Weekly: Consolidating in a tight rectangle ₹650–750
📅 Daily: Sideways movement; price hugging EMA — coiled for move
🔄 Volume: Subtle uptick — early sign of institutional interest
🧭 Indicators: MACD crossover possible, RSI turning positive
🎯 Trade Plan
💼 Accumulation Zone: ₹650–720
🔓 Breakout Buy: ₹750+ (weekly close + volume)
⛔ Stop-loss: ₹640
🎯 Targets: ₹900 → ₹1,100
📈 Risk-Reward: Up to 1:4.5 🚀
📊 Fundamental Edge
💰 FY25 Revenue: ₹2,080 Cr
🧼 Expanding B2C + Institutional verticals
🏗️ ₹192 Cr CapEx in progress
💹 ROE: ~13%, OPM: ~10%
🧾 Clean governance, no pledges
🟢 Momentum Score: 7/10
📉 Stage 1 base + rising volume
📊 Solid growth fundamentals
🧠 FX/geography risk being managed
📍 NSE: ROSSARI | Sector: Specialty Chemicals
⏳ Watch ₹720 breakout zone – Big move may be coming!
#Rossari #BreakoutStocks #StageAnalysis #SwingTrade #SmartMoney #TechFundamentals #TradingView #SpecialtyChemicals #IndiaEquity #finchoicebiz #markethunt
Search in ideas for "INDICATORS"

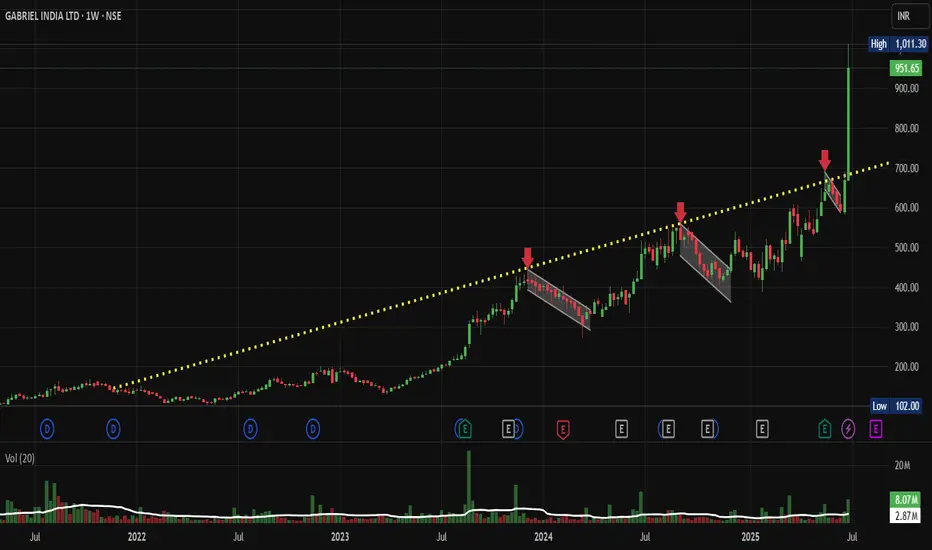
Gabriel India: Ascending Trendline Breakout, Chart of the WeekNSE:GABRIEL : A Technical Breakout Story That Could Double Your Investment? Let's Analyze it in my "Chart of the Week" Idea.
Price Action Analysis:
• The stock has shown a remarkable multi-year uptrend from around ₹100 levels in 2022 to current levels above ₹950
• A clear ascending channel pattern is visible with the yellow dotted trendline acting as dynamic support
• Recent price action shows a powerful breakout from a consolidation phase around ₹600-700 levels
• The stock is currently trading near all-time highs with strong momentum
• Volume expansion during the recent breakout confirms genuine buying interest
Volume Spread Analysis:
• Volume patterns show significant spikes during major price advances
• The recent breakout phase is accompanied by above-average volume, indicating institutional participation
• Volume tends to contract during consolidation phases, which is a healthy price action
• The volume profile suggests strong accumulation during the base-building phases
Key Technical Levels:
Base Formation:
• Primary base formed between ₹100-200 levels during 2022-early 2023
• Secondary base established around ₹400-500 levels in late 2023
• Most recent consolidation base around ₹600-700 levels before the current breakout
Support Levels:
• Immediate support: ₹850-900 (recent breakout zone)
• Strong support: ₹700-750 (previous resistance turned support)
• Major support: ₹600 (base of recent consolidation)
• Critical support: ₹500 (psychological level and previous consolidation zone)
Resistance Levels:
• Immediate resistance: ₹1000-1050 (psychological barrier)
• Next resistance: ₹1200 (measured move target)
• Extended target: ₹1400-1500 (based on channel projection)
Technical Pattern Recognition:
Primary Patterns:
• Long-term ascending channel with consistent higher highs and higher lows
• Multiple cups and handle formations during the uptrend
• Recent flag/pennant consolidation followed by breakout
• Classical stage 2 uptrend characteristics with expanding volume
Technical Indicators:
• Price trading above all major moving averages
• Strong momentum as evidenced by the steep price advance
• Healthy pullbacks followed by resumption of uptrend
• Volume-price confirmation during breakouts
Trade Setup:
Entry Levels:
• Aggressive entry: Current market price (₹950-970)
• Conservative entry: On pullback to ₹850-880 levels
• Breakout entry: Above ₹1000 with volume confirmation
• Accumulation entry: Any dip towards ₹800-820 levels
Exit Levels:
• First target: ₹1200 (26% upside from current levels)
• Second target: ₹1400 (47% upside)
• Extended target: ₹1600 (68% upside)
• Trailing stop strategy recommended for long-term positions
Stop-Loss Placement:
• For aggressive entries: ₹800 (16% risk)
• For conservative entries: ₹750 (12% risk from ₹850 entry)
• For breakout entries: ₹900 (10% risk from ₹1000 entry)
• Weekly closing basis stop-loss recommended
Risk Management Framework:
Position Sizing:
• Risk per trade: Maximum 2-3% of portfolio
• For ₹800 stop-loss from current price: Position size = (Portfolio × 2%) ÷ ₹150
• Recommended allocation: 5-8% of equity portfolio given the risk-reward profile
• Consider scaling into position over 2-3 tranches
Risk Parameters:
• Maximum drawdown tolerance: 20% from peak
• Time-based stop: Exit if consolidation exceeds 6 months
• Sector rotation risk: Monitor auto sector performance
• Market correlation: High beta stock, reduce position size in volatile markets
Sectoral Backdrop:
Auto Ancillary Sector Dynamics:
• Indian automotive sector showing strong recovery post-COVID
• Shift towards electric vehicles creating new opportunities for component manufacturers
• Export potential increasing with global supply chain diversification
• Government's PLI scheme supporting auto component manufacturing
Industry Trends:
• Increasing focus on high-quality, precision components
• Growing aftermarket business providing stable revenue streams
• Consolidation in the sector is favouring established players
• Technology upgrades driving margin expansion
Fundamental Backdrop:
Company Overview:
• NSE:GABRIEL is a leading manufacturer of automotive shock absorbers and suspension systems
• Strong presence in both OEM and aftermarket segments
• Diversified customer base across passenger vehicles, commercial vehicles, and two-wheelers
• Established relationships with major automotive manufacturers
Financial Highlights:
• Consistent revenue growth is driven by industry expansion
• Improving margins through operational efficiency and product mix optimization
• Strong balance sheet with manageable debt levels
• Increasing return on equity and return on capital employed
Growth Drivers:
• Expanding automotive production in India
• Growing replacement market for suspension components
• Export opportunities in emerging markets
• New product development and technology partnerships
Investment Thesis:
• Well-positioned to benefit from India's automotive growth story
• Strong competitive moat through technical expertise and customer relationships
• Potential for multiple expansions as the company scales operations
• Dividend yield providing downside protection for long-term investors
My Take:
The technical setup for NSE:GABRIEL presents a compelling risk-reward opportunity with the stock breaking out from a multi-month consolidation phase. The combination of strong sectoral tailwinds, robust fundamental backdrop, and bullish technical patterns creates a favourable investment environment. However, investors should maintain proper risk management given the stock's high beta nature and current extended valuation levels.
Keep in the Watchlist.
NO RECO. For Buy/Sell.
📌Thank you for exploring my idea! I hope you found it valuable.
🙏FOLLOW for more
👍BOOST if you found it useful.
✍️COMMENT below with your views.
Meanwhile, check out my other stock ideas on the right side until this trade is activated. I would love your feedback.
Disclaimer: "I am not a SEBI REGISTERED RESEARCH ANALYST AND INVESTMENT ADVISER."
This analysis is intended solely for informational and educational purposes and should not be interpreted as financial advice. It is advisable to consult a qualified financial advisor or conduct thorough research before making investment decisions.
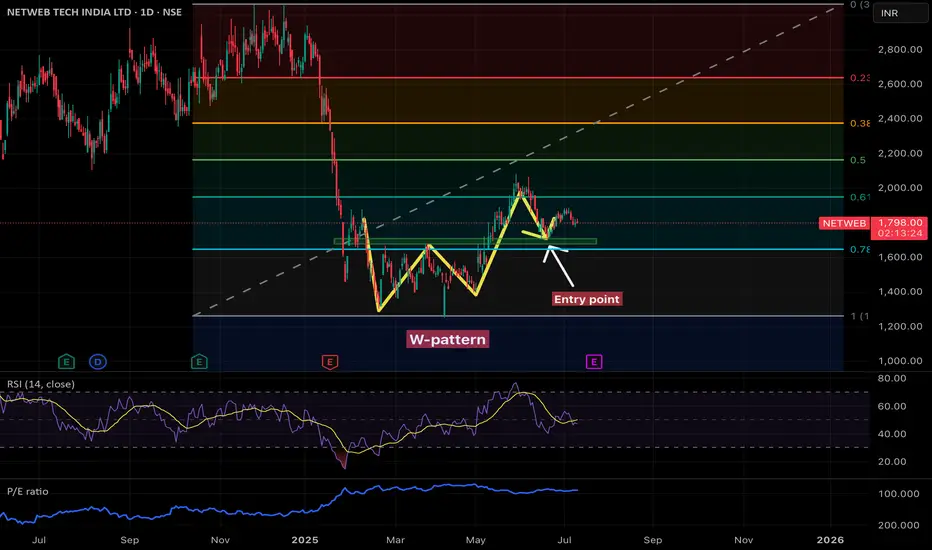
Technical analysis of the NETWEB TECH INDIA LTD (NSE)🧩 Chart Type: Daily (1D)
🔍 Pattern Observed: W-Pattern (Double Bottom)
• The W-pattern (double bottom) is a bullish reversal pattern.
• It indicates that the stock found strong support at a similar price level twice, suggesting potential accumulation.
• Breakout occurred after the second bottom, which was followed by a rally.
🎯 Key Technical Elements:
✅ Entry Point:
• Clearly marked just after the breakout from the neckline of the W-pattern.
• This aligns with a previous resistance level turning into support — a classic bullish confirmation.
• The green zone shows a support area, acting as a cushion for price retracement.
📏 Fibonacci Retracement Levels:
• Levels shown range from 0 to 1 (bottom to top of the recent trend).
• Price is hovering near the 0.618 Fibonacci level, a key retracement support (often termed the “golden ratio”).
• Below 0.618 lies the 0.786 level, which aligns with the marked support area — critical zone to watch for bulls.
📉 Indicators:
🔵 RSI (Relative Strength Index - 14):
• Currently in the neutral zone (~40-50) — neither overbought nor oversold.
• RSI previously bounced from oversold levels during W-pattern formation.
• No bullish divergence noted currently, but a bounce from 40 RSI could trigger a buying signal.
📘 P/E Ratio (Blue Line):
• Remains relatively steady after a spike — valuation seems to have normalized.
• Watch for any sharp moves that deviate from price action.
📌 Support and Resistance:
• Support:
• 1,700–1,750 INR (green zone, 0.786 level, neckline retest)
Resistance:
• ~1,950 INR (0.618 Fibonacci level)
• ~2,200 INR (0.5 Fibonacci level)
⚠️ Risk Factors:
• If price closes below the 0.786 retracement zone, W-pattern may fail.
• Volume data isn’t shown in detail, so confirmation on breakout strength is missing.
• A break below 1,650 INR could trigger stop-losses and invalidate the pattern.
✅ Conclusion:
• Bullish bias remains intact as long as price holds above the neckline and Fibonacci support.
• Entry near the support zone (green box) offers a favorable risk-to-reward ratio.
• Target levels: 1,950, 2,200, and possibly 2,400+ INR on trend continuation.
• Keep RSI and price action in sync for re-entry or exit signals.
GBP/USD 4H Bearish Reversal Setup – Short Below 1.36413 Toward 1Trade Setup Details:
Entry Zone: Around 1.36413
This level is a resistance zone, aligned with previous support turned resistance and a supply area.
Price has already tested and rejected this zone multiple times, forming lower highs.
Stop Loss: 1.36776
Placed above the resistance zone to avoid being caught by false breakouts.
Gives some buffer above the last swing high.
Target: 1.33681
Target lies near a key support zone.
Offers a potential risk-reward ratio of approximately 1:2.
📉 Technical Indicators:
Moving Averages:
Price is trading below the 50 EMA (red) and 200 EMA (blue), indicating bearish bias.
Structure:
Lower highs and lower lows formation.
Bearish engulfing candles near resistance confirm selling pressure.
⚠️ Bearish Bias Justification:
Strong rejection from resistance (supply) zone.
Momentum slowing down near 1.36413 area.
Confluence with EMA resistance.
📌 Summary:
Entry Stop Loss Target R:R Ratio Bias
1.36413 1.36776 1.33681 ~1:2 Bearish
Note: A break and close above 1.36776 invalidates this setup.

USD/JPY 30-Minute Chart Analysis – July 8, 2025USD/JPY 30-Minute Chart Analysis – July 8, 2025
Overview:
This chart presents a bearish setup for USD/JPY based on a potential trend reversal from the resistance area near 146.400. The trade plan suggests a short position with clearly marked entry, stop-loss, and target levels.
🔹 Key Levels:
Entry Point: 146.400 (Highlighted in blue)
Stop Loss: 146.633 (Upper purple zone)
Target Point: 144.577 (Lower purple zone)
Current Price: 146.316 (as of the chart time)
🔹 Technical Indicators:
200 EMA (Blue): Sloping upward, indicating a long-term uptrend.
50 EMA (Red): Price is slightly above it, indicating recent bullish momentum but with potential resistance nearby.
Support/Resistance Zones: Clearly marked purple boxes at both the top and bottom.
Trendline: An ascending trendline is drawn from the bottom-left (recent swing low) indicating bullish structure, but now nearing resistance.
🔹 Trade Setup Summary:
Bias: Bearish (Short)
Rationale: Price has approached a resistance zone (146.400–146.633) with multiple rejections (marked by orange dots). This increases the likelihood of a pullback or reversal.
Risk-Reward: Favorable. Target (144.577) offers a ~2.1% move vs. tight stop (~0.2%).
🔹 Trade Plan:
Parameter Value
Direction Sell / Short
Entry 146.400
Stop Loss 146.633
Take Profit 144.577
Risk (%) Approx. -0.16%
Reward (%) Approx. +1.25%
🔹 Conclusion:
This setup anticipates a downward move in USD/JPY from the resistance zone. Price action suggests weakening bullish momentum. If the resistance at 146.400 holds and the market fails to break higher, this short setup could yield a favorable risk-reward outcome targeting 144.577.

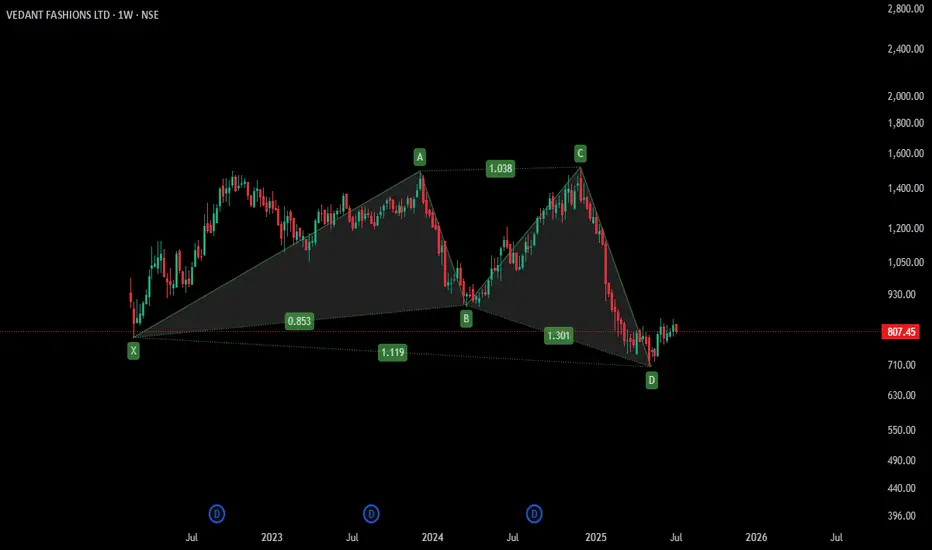
Stock Alert: Vedant Fashions ( $NSE:MANYAVAR)
📢 Stock Alert: Vedant Fashions ( NSE:MANYAVAR )
🗓️ *Date: 8 July 2025*
🔹 **Chart Setup:**
✅ Bullish Gartley pattern completed at ₹740–760
📈 Weekly reversal confirmed, price now at ₹805
🧭 Weinstein Stage 1 (early accumulation phase)
🔹 **Key Levels:**
📍 Entry: ₹790–800
🔒 Stop-Loss: ₹706
🎯 Target 1: ₹930 (6–8 weeks)
🎯 Target 2: ₹1,050 (3–6 months)
📊 Risk/Reward: 3:1 to 5:1
🔹 **Indicators:**
📉 RSI & MACD turning bullish
📊 Volume spike at bottom → smart money entering
🔁 VWAP support holding
🔹 **Fundamentals:**
💰 EPS & Sales improving
📈 ROE & OPM stable
💳 CRISIL Rating: **AA; Outlook: Stable**
📉 Down 50% from 52W high, near bottom
🔹 **Momentum Score: 7.5/10**
👍 Strong technical base + improving earnings
⚠️ Watch for breakout above ₹930
✅ **Action:** Buy on weekly strength ₹790–800
📌 Add more above ₹930 confirmation
🟢 Looks like a **low-risk, high-reward swing trade** setup with mid-term upside potential.
XAU/USD Bullish Reversal Setup XAU/USD Bullish Technical Outlook
Analysis:
Current Price: The gold spot price (XAU/USD) is at $3,311.
Key Levels:
Support Zones:
Order Block Support Level: Around $3,290 – $3,300 (highlighted by the grey box).
Key Support Level: Slightly lower near $3,275 – $3,280.
Resistance & Target:
The chart shows a bullish projection aiming for the $3,366 – $3,370 area, with an upside potential of ~3.3% from the bounce zone.
Indicators:
The 50 EMA ($3,328) and 200 EMA ($3,332) are above the current price, acting as dynamic resistances.
Price is testing the confluence of trendline support and horizontal support.
Structure:
The chart illustrates a clear bullish reversal pattern near the support area with an expected rally if buyers defend the zone.
The arrows project a bounce off the support with a break above the EMA cluster and continuation to the upper trendline and target zone.
Potential Trade Idea:
If price holds above $3,290, a long position could target $3,366, with stops below $3,270 (key support).
📌 Conclusion:
The analysis suggests that XAU/USD is positioned for a bullish reversal if the support block holds, with upside momentum targeting the $3,366 level. Watch the price action near the EMAs for confirmation of trend continuation.

BTC/USD Long Trade Setup – Bullish Reversal from Support Zone Entry Point:
108,150.12
Marked just above a support area where price shows potential reversal signs after a downtrend.
Stop Loss Zone:
Around 107,302.61 to 107,758.54
Positioned below the purple support box to minimize downside risk.
Target Point:
110,588.52
This is a projected EA target point, offering a Risk:Reward ratio > 1:3 based on visual estimation.
Key Indicators:
Red Line: Likely the 50 EMA, showing bearish pressure.
Blue Line: Likely the 200 EMA, acting as dynamic support near the entry.
Trendline (Blue): Break above this trendline could confirm bullish momentum continuation.
Price Action Notes:
Support Zone: Highlighted in purple — strong accumulation observed here.
Two Orange Circles: Represent lower high and possible higher low formation — indicating a potential reversal.
✅ Trade Outlook:
Bias: Bullish (Long Setup)
Confirmation: Await breakout & close above the red moving average or trendline.
Volume Confirmation: Volume spikes would strengthen the long signal.
⚠️ Risk Management:
Use Stop Loss: Below purple zone (around 107,300) to protect capital.
Take Partial Profits: Around 109,500 if price faces resistance before full target.

"Be Surprised" - "Jaisa Performance, Waisi Price!"Indigo Paints Ltd
About
Incorporated in 2000, Indigo Paints Ltd manufactures and sells decorative paints
Key Points
Leading Paint Company
The company is a leading paint company in India that produces a wide range of decorative paints. It is the first company to introduce category-creator products like Metallic Emulsions, Tile Coat Emulsions, etc in the decorative paint market in India. The company has ~80%-90% market share in some of its differentiated products.
Product Portfolio
The product portfolio comprises of Emulsions, Enamels, Wood Coatings, Primers, Distempers, Cement, Paints, Putties etc.
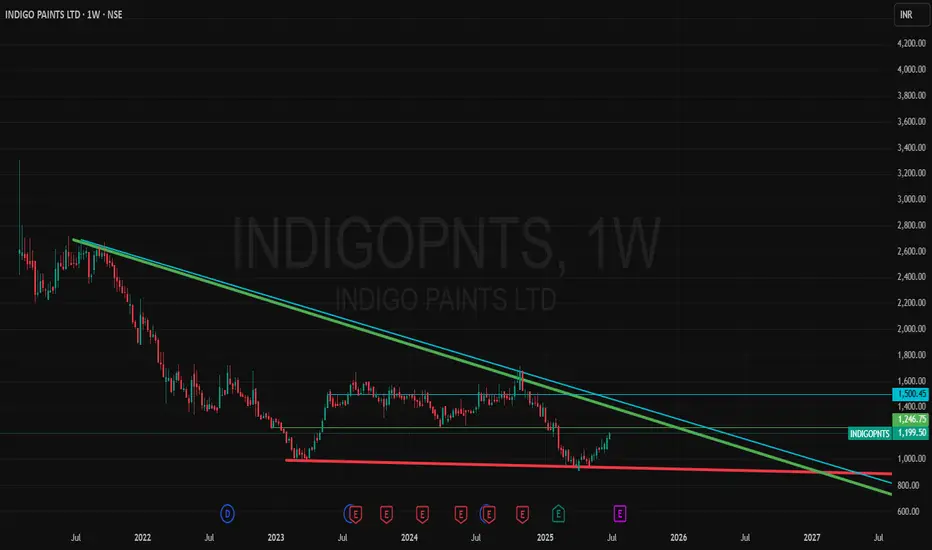
📈 Indigo Paints – Is a Breakout Brewing? 🎨
CMP: ₹1,199 | View: Positional Bullish | Chart TF: Weekly & Monthly
🔹 Technical Breakout:
Price has successfully broken out of a long-term falling trendline on both weekly and monthly charts after forming a strong base near ₹1,000.
MACD crossover, rising RSI, and Parabolic SAR flip all support this uptrend.
Volume spike seen recently confirming accumulation.
🔹 Bullish Indicators:
RSI (W1 & M1) back above 50 – momentum shifting.
MACD crossovers with histogram reversal.
Price reclaiming 50EMA and 100EMA for the first time in months.
Bullish divergence played out.
📰 Fundamental Triggers:
CNBC TV18: Management expects growth to pick up from Q1 FY26, with strong sales outlook.
MoneyControl: Sharekhan gave a Buy call with a target of ₹1234.
NDTV Profit: Indigo Paints picked as a top stock to buy this week.
📊 Screener Fundamentals:
Debt-free, consistent ROE ~18%
Strong operating margins
Expanding dealer network and brand recall improving
📝 Note: Please do your own due diligence. This is not a recommendation, just a view based on charts and fundamentals.
🧠 Disclaimer: For educational and research purposes only. No buy/sell advice.
📝 Chart Purpose & Disclaimer:
This chart is shared purely for educational and personal tracking purposes. I use this space to record my views and improve decision-making over time.
Investment Style:
All stocks posted are for long-term investment or minimum positional trades only. No intraday or speculative trades are intended.
⚠️ Disclaimer:
I am not a SEBI registered advisor. These are not buy/sell recommendations. Please consult a qualified financial advisor before taking any investment decision. I do not take responsibility for any profit or loss incurred based on this content.
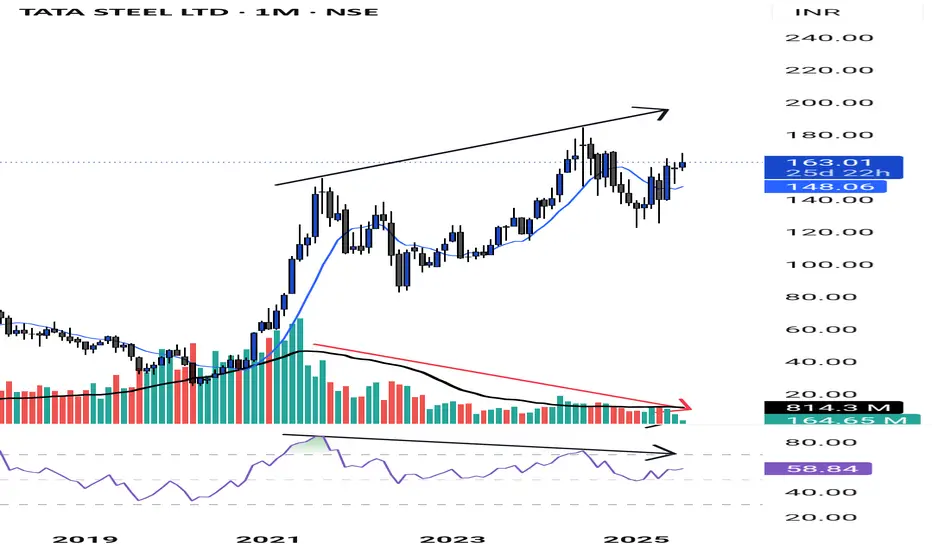
Swing Trading - Stock Options Buying Strategy Part 3📊 Tata Steel Monthly Chart Analysis
Indicators: RSI Divergence, Volume Contraction, and Market Structure
In the monthly chart of Tata Steel, we can observe some crucial technical signals that traders should pay attention to:
🔻 1. Volume Contraction
The volumes are gradually contracting, indicating a reduction in participation and momentum. This often signals a potential reversal or a consolidation phase in the market.
📉 2. RSI Divergence
A clear RSI divergence is forming—while the price is making higher highs, the RSI is forming lower lows. This reflects a loss of strength in the uptrend and a weakening momentum.
⚠️ Note:
There’s a common misconception that RSI divergence always leads to a price fall. While it can be an early warning signal, we do not take trades based solely on RSI divergence. Instead, we confirm signals using market structure and volume.
✅ Confirmation Using Market Structure
To validate the divergence, we also check:
Market Structure – Patterns like higher highs/higher lows or lower highs/lower lows.
Volume Behavior – Are volumes expanding or contracting?
Only when these elements align do we consider it a reliable trade setup—as discussed in Part 1 and Part 2 of our sessions.
📌 Five Key Steps for Analyzing Any Stock
Whether trading cash, futures, or options, follow this proven five-step approach:
1. Start with the Monthly Timeframe
This is a golden rule.
Never begin with a smaller timeframe. The monthly chart gives you the most reliable trend information. On the monthly chart:
Identify the latest swing high and swing low
Check if the price is above the 9-period SMA
2. Check Volume on Monthly Chart
Observe what the volume is doing:
Increasing? Decreasing? Flat?
Volume behavior gives deeper insight into the strength or weakness of the trend.
3. Look for RSI Divergence on Monthly
Is there a mismatch between price and momentum?
If the RSI shows divergence while prices climb, it could indicate an upcoming reversal.
4. Repeat the Process on Weekly and Daily Charts
Once the monthly chart confirms your bias:
Move to the weekly chart. Check if it is also above the 9 SMA.
Then check the daily for potential entry setups.
📌 Often, the weekly and daily charts will give earlier signals of 9 SMA crossovers before the monthly confirms the trend.
5. Confirm Trend and Set Risk Management Rules
Identify the ongoing trend:
Uptrend: Higher highs and higher lows
Downtrend: Lower highs and lower lows
Set your trade plan:
Stop Loss (SL): Below the previous swing low
Target: Based on the swing high from a higher timeframe
📈 Final Thoughts
To trade effectively, align these five elements:
Higher timeframe confirmation (start with monthly)
Volume behavior
RSI divergence
Market structure
Solid risk management plan
Only when all conditions align should a trade be considered.
This structured approach prevents emotional trading and increases the probability of success.
List of 50 NSE liquid stocks - RELIANCE, INFY, HDFCBANK, ICICIBANK, SBI, TATAMOTORS, TATASTEEL
AXISBANK, BAJFINANCE, LT, ITC, TCS, HINDALCO, POWERGRID, BHARTIARTL, MARICO
HINDUNILVR, NTPC, ONGC, WIPRO, SBIN, COALINDIA, GRASIM, M&M, ULTRACEMCO
HDFC, CIPLA, EICHERMOT, NESTLEIND, BRITANNIA, ASIANPAINT, SUNPHARMA, DRREDDY
AMBUJACEM, TATACHEM, GODREJPROP, INDUSINDBK, CANBK, IOC, PFC, RECLTD
BIOCON, HINDPETRO, NTPC, PETRONET, SBILIFE, LAURUSLABS, COLPAL, BAJFINANCE
Add to your watchlist. Only trade in these.
Please leave a comment if you have any doubts. God bless you all!
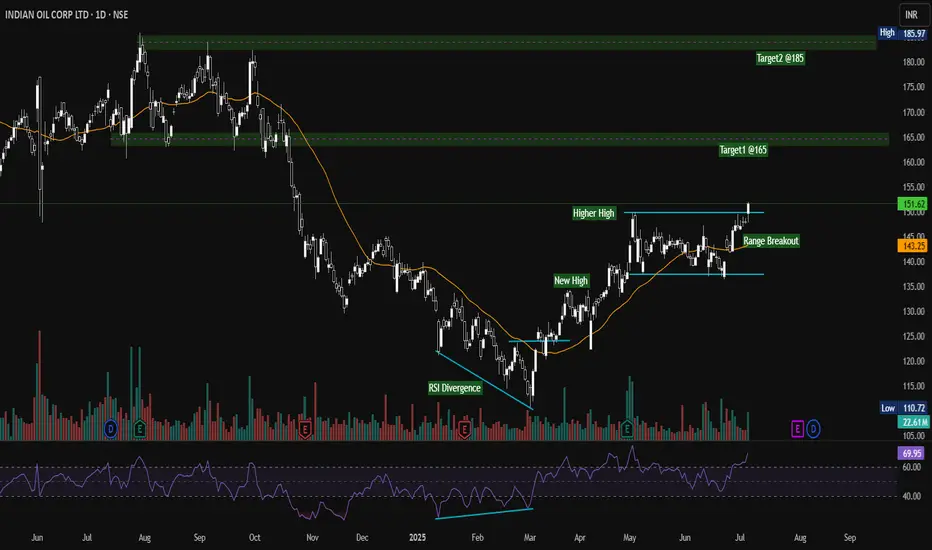
IOC Range Breakout Confirmed | Bullish Momentum Building Toward NSE:IOC – Strong Bullish Setup with Range Breakout | Targets: ₹165 & ₹185
Indian Oil Corp Ltd (IOC) has shown a decisive breakout from a prolonged consolidation range, signaling strong bullish momentum. Price has crossed the resistance zone around ₹150–₹151 with significant volume, confirming the breakout.
Key Technical Highlights:
RSI Bullish Divergence: Notable RSI divergence spotted near February lows, which was a precursor to the ongoing reversal.
Trend Reversal Confirmation:
New High formed in March 2025
Higher High confirmed in May 2025
20 EMA (orange) is trending upward and has acted as dynamic support.
Range Breakout occurred recently, marking the start of the next bullish leg.
Upside Targets:
Target 1: ₹165 – Previous supply zone and horizontal resistance
Target 2: ₹185 – Major resistance zone and previous swing high
Indicators:
RSI: Currently at 69.95, near overbought but supports continuation in strong uptrends
Volume: Breakout accompanied by a volume spike – strong institutional activity
Support:
Immediate support at ₹143 (previous range high and breakout level)
Bias: Bullish
Timeframe: Daily
Trade Setup: Buy-on-dips or breakout retest entry
Disclaimer: Not financial advice. Please do your own research or consult a registered financial advisor.
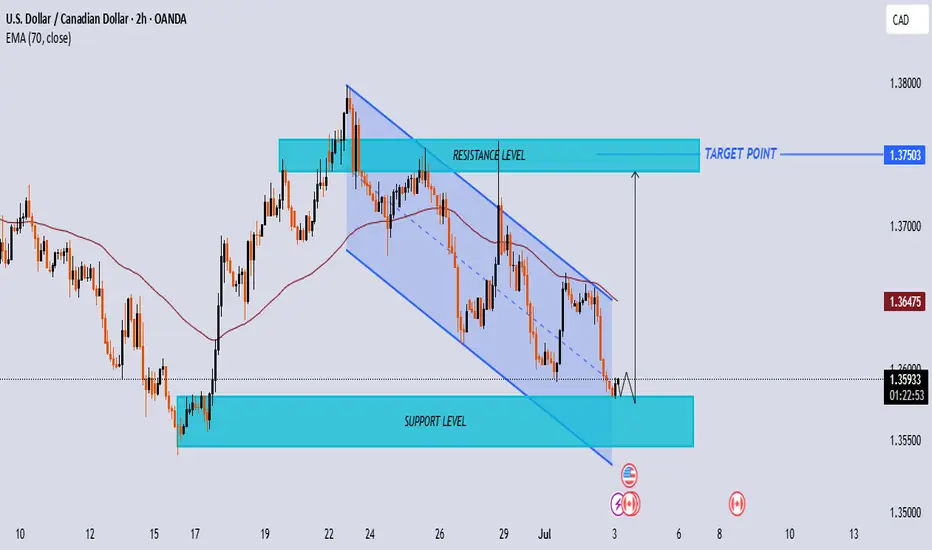
USD/CAD Potential Reversal Setup at Key Support Zoneanalysis of the USD/CAD 2-hour chart you provided:
Technical Breakdown:
📉 Downtrend Channel (Falling Wedge)
Price is moving within a descending channel structure (marked with blue lines).
The market has been making lower highs and lower lows, typical of a bearish trend.
Key Levels:
✅ Support Zone: Around 1.35500 - 1.35800
Price has reached this strong support zone.
Previous price reactions from this area suggest buying interest.
✅ Resistance Zone: Around 1.36800 - 1.37200
Identified as the next major obstacle for bullish movement.
✅ Target Point: 1.37503
Marked as the final potential bullish target if price breaks above resistance.
Indicators:
70 EMA (Exponential Moving Average) currently at 1.36475
Price is trading below the EMA, confirming the short-term bearish pressure.
A breakout above EMA may support bullish momentum.
Price Action Expectation:
⚡ Bullish Scenario:
If price holds at the support zone and breaks out of the descending channel:
Expect a reversal towards the resistance zone.
If that breaks, price may target 1.37503, completing a potential bullish reversal pattern.
⚠️ Bearish Scenario:
If price fails to hold the support zone:
A breakdown below 1.35500 could trigger further downside.
Next significant support likely around 1.35000.
Summary:
Market is at a key decision zone.
Watching for:
Rejection and breakout above the falling wedge → Bullish opportunity.
Breakdown below support → Bearish continuation.
XAU/USD 4H Technical Outlook — Bullish Breakout Anticipation XAU/USD 4H Technical Outlook — Bullish Breakout Anticipation
Instrument: Gold Spot vs. US Dollar (XAU/USD)
Timeframe: 4H (OANDA Data)
Indicators: EMA 50 (red), EMA 200 (blue)
Key Highlights:
✅ Support & Resistance:
Support Zone: Price recently bounced strongly from a well-defined support zone near the confluence of the 50 EMA and 200 EMA (~3,324–3,330).
Resistance Zone: Marked between ~3,420–3,440, capping previous swing highs.
✅ Price Structure:
The pair has recovered sharply from a significant dip, showing a bullish engulfing recovery candle near the support.
The chart shows multiple successful tests of the support zone (highlighted by the yellow circles). Each test resulted in upward moves, indicating strong demand.
✅ Moving Averages:
Price is now trading above both EMAs — a positive sign.
The 50 EMA is slightly above the 200 EMA but still flattening; a clear bullish cross or divergence could strengthen the trend confirmation.
✅ Potential Scenario:
The blue arrow projection suggests a minor pullback towards the support, retesting the breakout level, followed by a rally targeting the resistance zone.
A successful retest of ~3,330–3,324 could offer a high-probability long opportunity.
✅ Bias:
Short-Term: Bullish bias as long as price holds above the support and both EMAs.
Key Confirmation: A clear break above recent swing highs (~3,350) with strong momentum could open the path to the 3,420–3,440 resistance.
📊 Summary
Support Holds ➜ Bullish Reaction
Retest Expected ➜ Buying Opportunity
Upside Target ➜ 3,420–3,440
⚠️ Risk Note: A daily close below the support (~3,320) would invalidate the bullish setup and expose price to deeper downside.

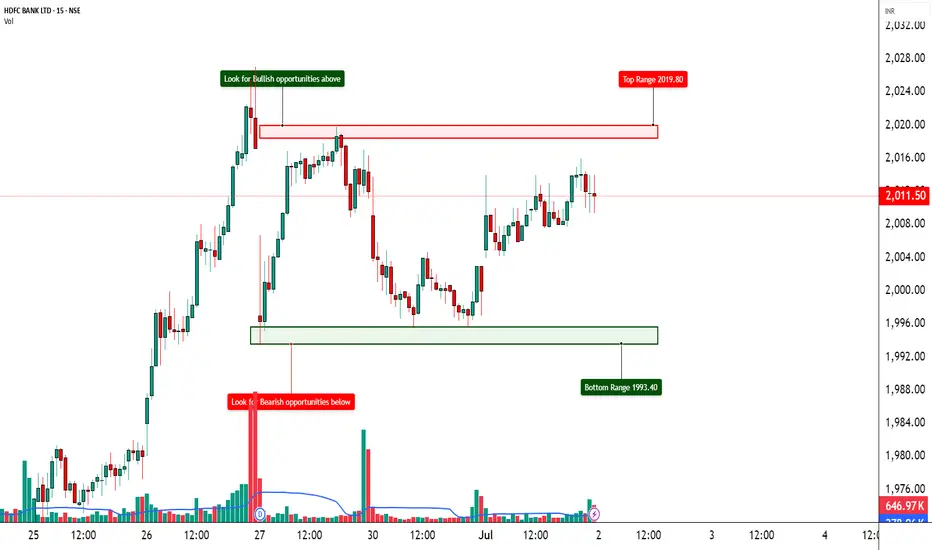
HDFCBANK – Stepping Into Bullish Territory?📈 HDFCBANK – Stepping Into Bullish Territory?
🔍 Strong Long Build-Up | Option Chain + Price Action Alignment
Chart Type: 15-min / 1H / Daily
Indicators: STWP Zones, Demand-Supply, Volume, OI Trends
🔹 What’s Catching Our Eye?
✅ Consistent Long Build-Up seen from 2000 CE to 2100 CE
✅ Massive OI Addition on 2040 CE (+6.33 lakh contracts = +50%)
✅ 2060 CE OI jumped +8.57 lakh = +82% – Serious bullish interest building up
✅ Put Writers exiting 2000 PE = Strong base forming around ₹2000
✅ Spot Price at ₹2012, sitting above psychological level
📊 What We’re Watching for:
📍 Breakout Zone: 2020–2040
📍 Targets: 2060 → 2080 → 2100
📍 Invalidation Below: 1985
📍 Momentum Confirmation: Strong close above 2040 with volume surge
📍 Option Chain Support: Heavy unwinding on 2000 PE confirms strength
📌 Trade Plan (Educational Purpose Only):
🔹 Bullish Idea: Buy above 2025 breakout with SL below 1985
🔹 Options: Look at 2040 or 2060 CE for directional exposure
🔹 BTST/Positional: If price closes above 2040 with rising OI and IV
⚠️ Disclaimer:
This post is for educational and learning purposes only.
It does not constitute buy/sell advice or investment recommendation.
Always consult your financial advisor before taking any positions.
STWP is not liable for any financial decisions based on this content.
📚 “Price is the headline, but data is the real story.”
💬 Will HDFCBANK reclaim its momentum zone, or is this just noise before the next move?
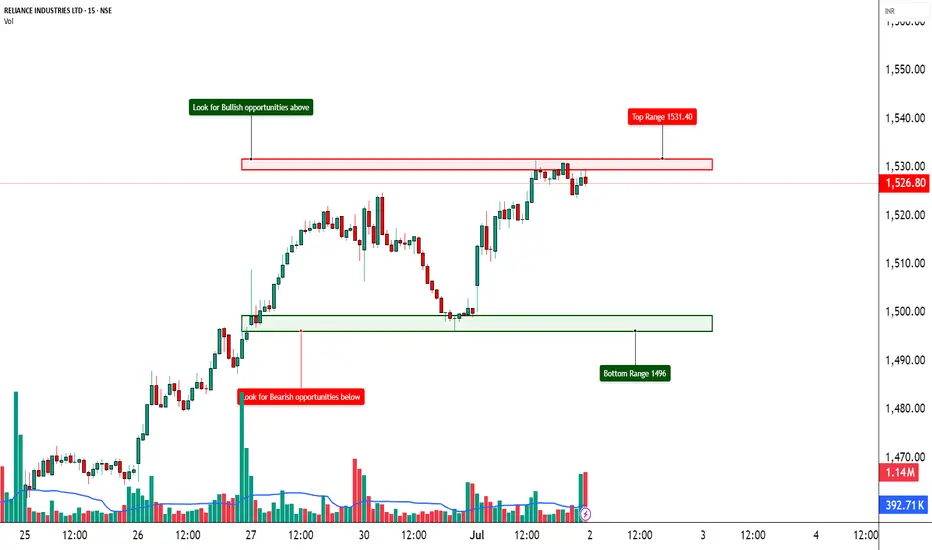
RELIANCE – Short Covering Fueling a Reversal?📈 RELIANCE – Short Covering Fueling a Reversal?
🔍 Heavy Action Across 1500–1570 CEs | Bullish Reversal on the Cards?
Chart Type: 15-min / 1H / Daily
Indicators: STWP Zones, Option Chain Activity, Volume Clusters, Demand-Supply
🔹 What’s Catching Our Eye?
✅ Aggressive Long Build-Up across multiple CEs (1550–1580)
✅ Massive Short Covering on 1500–1530 Calls – Bears exiting fast
✅ Huge OI Additions at 1550, 1560, 1570 CEs – Smart money positioning ahead?
✅ Put Writers Building Base at 1500–1520 PE → Strong support developing
✅ Spot Price at ₹1528.4 – Right at the heart of breakout zone
✅ IVs remain in control (~15.9–16.3%) = room for expansion
📊 What We’re Watching for:
📍 Breakout Zone: 1530–1540
📍 Targets: 1560 → 1580 → 1600
📍 Invalidation Below: 1490
📍 Momentum Confirmation: Price closing above 1540 with volume & OI spike
📍 Option Chain Support: 1500 PE (OI: 29.3L) + short build-up in multiple puts
📌 Trade Plan (Educational Purpose Only):
🔹 Bullish Idea: Buy above 1530–1540 with SL below 1490
🔹 Options Play: 1550 or 1560 CE suitable for short-term directional trades
🔹 Positional Angle: Momentum may sustain toward 1600 if 1540 holds
⚠️ Disclaimer:
This post is for educational and learning purposes only.
It does not constitute buy/sell advice or investment recommendation.
Always consult your financial advisor before taking any positions.
STWP is not liable for any financial decisions based on this content.
📚 “When bears cover in panic, bulls prepare their charge.”
💬 What’s your take on Reliance? Is 1600 on the radar, or is this just a squeeze?
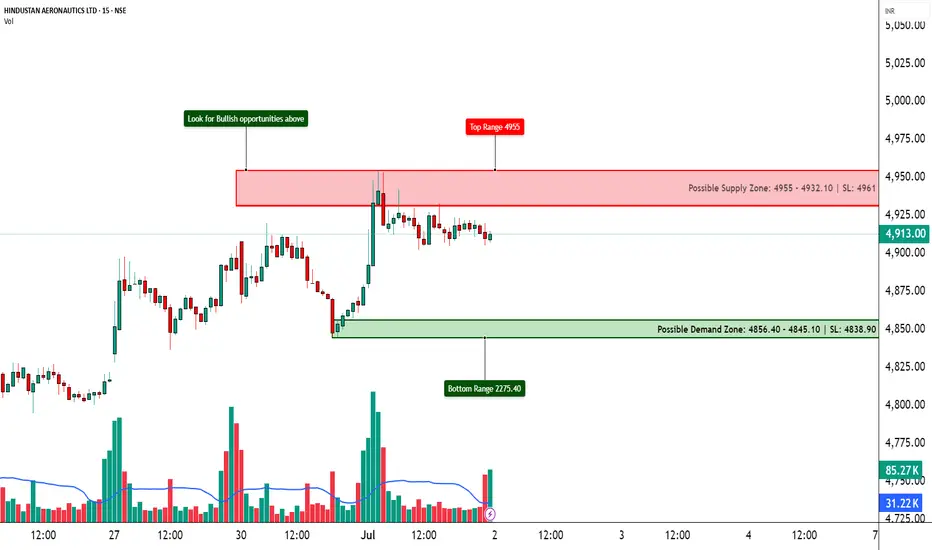
HAL – Ready for a Lift-Off?📈 HAL – Ready for a Lift-Off?
🔍 Bullish Action Heating Up | Option Chain + Price Action Analysis
Chart Type: 15-min / 1H / Daily
Indicators: STWP Zones, Volume, Demand-Supply, OI Analysis
🔹 What’s Catching Our Eye?
✅ Strong Long Build-Up at 5000, 5100 & 4950 Calls – Signs of institutional interest
✅ Short Covering at 4900 & 5200 CE – Shorts getting out = bullish continuation likely
✅ Highest OI at 5000 CE with +7.53% OI change = psychological breakout zone
✅ Spot Price at ₹4912 approaching key round-level resistance
✅ IV stable around 29.4%–29.7% → Room for volatility expansion if breakout happens
📊 What We’re Watching for:
📍 Breakout Zone: 4950–5000
📍 Targets: 5050 → 5100 → 5200
📍 Invalidation Below: 4850
📍 Momentum Confirmation: Sustained price close above 5000 with volume + OI surge
📍 Option Chain Bias: 5000 CE leading in build-up, supporting bullish sentiment
📌 Trade Plan (Educational Purpose Only):
🔹 Bullish: Buy above 4950 breakout with SL below 4850
🔹 Options: Consider 5000 or 5100 CE depending on your risk-reward
🔹 BTST/Positional Type: If price sustains above 4950–5000 with aggressive volumes
⚠️ Disclaimer:
This post is for educational and learning purposes only.
It does not constitute buy/sell advice or investment recommendation.
Always consult your financial advisor before taking any positions.
STWP is not liable for any financial decisions based on this content.
📚 “Smart money seems to be fueling the engines here.”
💬 Is HAL cleared for take-off above 5000? Or is it facing turbulence ahead?
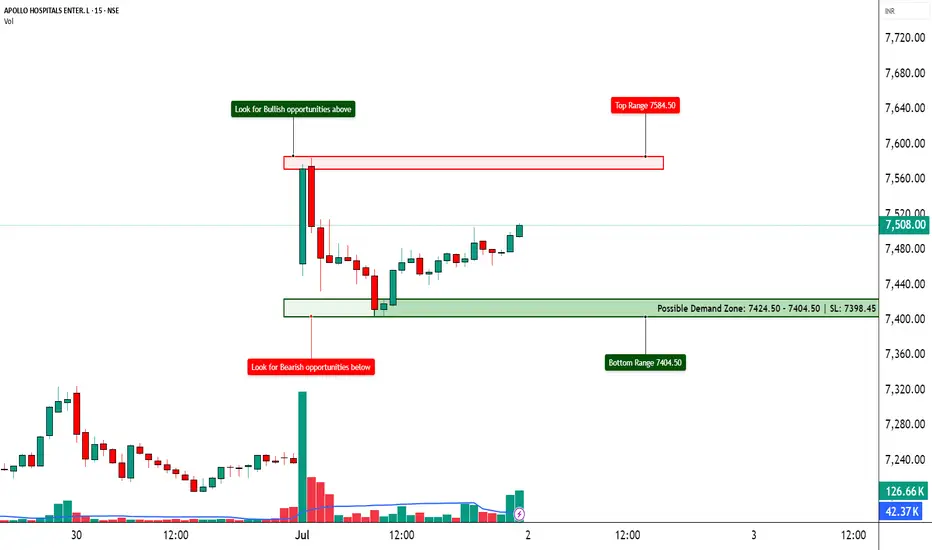
APOLLOHOSP – Preparing for the Next Breakout ?📈 APOLLOHOSP – Preparing for the Next Breakout?
🔍 Bullish Setup Unfolding | Option Chain + Price Action Analysis
Chart Type: 15-min / 1H / Daily
Indicators: STWP Zones, Volume, Demand-Supply, Price Action
🔹 What’s Catching Our Eye?
✅ Strong Long Build-Up across 7500–8000 Calls
✅ Heavy Put Writing at 7500, 7400, and even 7000
✅ Volatility Expansion + Rising OI = Possible Range Expansion Move
✅ Clean Demand Zone at 7400–7450 with a Morning Star Bounce (if visible)
✅ ATM Call (7500 CE) up 124% with +38% OI – Institutions possibly preparing for an up move!
📊 What We’re Watching for:
📍 Trigger Level: 7520–7550 Breakout
📍 Targets: 7600 → 7700 → 7800
📍 Invalidation Below: 7420
📍 Momentum Confirmation: Price closing above 7550 with volume spike
📍 Option Chain Support: 7000–7400 (Heavy PE writing)
📌 Trade Plan (Educational Purpose Only):
🔹 Bullish: Buy on breakout above 7550 with SL below 7440
🔹 Options: Consider 7600 or 7700 CE based on risk profile
🔹 BTST Type: If price holds 7500–7520 till close
⚠️ Disclaimer:
This post is for educational and learning purposes only.
It does not constitute buy/sell advice or investment recommendation.
Always consult your financial advisor before taking any positions.
STWP is not liable for any financial decisions based on this content.
📚 "Let Data Drive the Trade – Not Emotion!"
💬 What's your take on ApolloHosp? Bullish ride or trap zone?
Pnb Housing Finance Limited (PNBHOUSING)Descending Triangle Breakout:A clear breakout from a long descending triangle pattern (highlighted in cyan) occurred around March 2025, indicating the end of a consolidation phase and beginning of an uptrend.
Base Formation (Accumulation Zone):
Long rectangular base formed between ₹720 to ₹880, signaling accumulation before breakout.
Breakout occurred with a volume spike, confirming strength.
🔧 EMA Analysis:
Both EMA distances are expanding (highlighted text on chart):
This shows strong bullish momentum.The price is trading above 50 EMA (red) and 200 EMA (blue), with increasing separation.A bullish signal indicating buyers are in control.
📉 Support & Resistance Levels:
Support Zones:
₹972 (horizontal green zone) – strong demand zone.
₹939 (200 EMA) – dynamic support.
Immediate Resistance:
₹1,198 (marked red horizontal line).
Once this is crossed, next target is projected around ₹1,350–1,400 (green arrow).
📈 Volume Confirmation:
Volume is gradually rising with every bullish breakout, confirming the strength of upward moves.
📌 Bullish Continuation Pattern:
A possible bullish flag or higher low formation was formed in June, indicating a healthy correction before continuation.
✅ Conclusion (Bullish Bias):
Trend: Uptrend with strong momentum. Indicators: EMA expansion supports the rally.
Targets: ₹1,200 short-term; ₹1,350–1,400 medium-term.
Stop-Loss: Below ₹972 for positional trades.

XAU/USD Analysis Today (June 28, To 04 July 2025)XAU/USD Analysis Today (June 28, 2025)
As of June 28, 2025, the Gold Spot/US Dollar (XAU/USD) pair is trading around $3,295–$3,330, reflecting a corrective phase after recent volatility. Below is a detailed analysis of the current market dynamics, incorporating technical and fundamental factors, as well as sentiment from recent sources.
# Price and Market Overview
Current Price: Approximately $3,295–$3,330, with a slight downward bias following a recent peak near $3,450. The pair has been consolidating after a sharp decline triggered by easing geopolitical tensions.
Recent Performance: Gold fell by ~0.12%–0.42% in recent sessions, settling below the key $3,300 support level intraday, with volatility driven by U.S. economic data and Middle East developments.
Market Sentiment: The 14-day RSI is around 49.83–51.66, indicating neutral conditions, neither overbought nor oversold. Volatility over the past 30 days has been moderate at ~1.46%.
Technical Analysis
Support and Resistance Levels:
Support: Key support lies at $3,280–$3,240 (recent low and pivot point), with stronger support at $3,250 and $3,200 if selling pressure persists. A break below $3,280 could target $3,040–$3,100.
Resistance: Immediate resistance is at $3,300–$3,350, with a stronger barrier at $3,375–$3,400. A sustained break above $3,440 could signal a bullish reversal toward $3,488–$3,500.
Indicators:
Moving Averages: The 20-day EMA ($3,349.73) and 10-day EMA ($3,356.43) suggest a short-term sell signal, while the 50-day SMA ($3,323.61) and 100-day SMA ($3,162.10) indicate a buy signal, reflecting mixed trends. The 200-day SMA (~$2,919.95) supports a long-term bullish trend.
Chart Patterns: A bear flag pattern was noted on the 1-hour chart, signalling a continuation of the downtrend if $3,280 support fails. However, a potential reversal pattern is forming on the 15-minute chart near $3,313, suggesting a possible short-term bounce.
Chart for your reference
- Disclaimer --
This analysis is based on recent technical data and market sentiment from web sources. It is for informational purposes only and not financial advice. Trading involves high risks, and past performance does not guarantee future results. Always conduct your own research or consult a SEBI-registered advisor before trading.
#Boost and comment will be highly appreciated

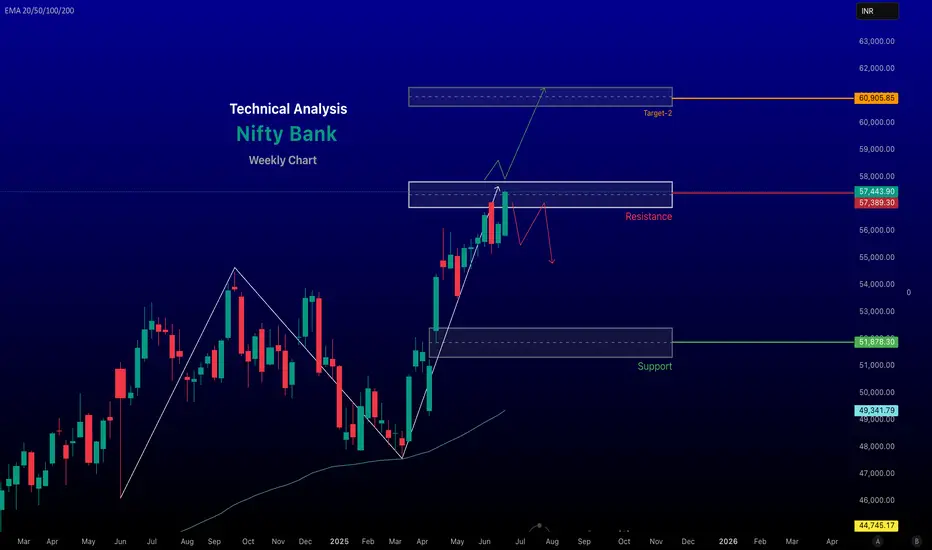
Bank Nifty Weekly Analysis for June 30, - 04, July - 2025The Bank Nifty index, as of June 28, 2025, shows a bullish outlook based on recent market data and technical analysis, though traders should remain cautious due to potential volatility and resistance levels. Here's a detailed analysis for today:
Market Performance and Sentiment
Recent Performance: The Nifty Bank index closed at 57,443.90 on June 27, 2025, with a gain of 237.20 points (+0.41%), indicating continued bullish momentum. The index has been trading near its 52-week high of 57,475.40, reflecting strong sectoral leadership. Posts on X suggest that Bank Nifty has outperformed the Nifty 50, which is 2.5% below its all-time high, with a target of 59,000.
Market Sentiment: Positive global cues, including a ceasefire between Israel and Iran, falling crude oil prices, and dovish signals from the U.S. Federal Reserve, have boosted risk appetite, supporting the banking sector's rally. Foreign Institutional Investors (FIIs) have been net buyers for four consecutive months, further fueling bullish sentiment. However, significant open interest (OI) buildup in the last two days suggests potential for abnormal volatility in the near term.
~~~ Technical Analysis ~~~
Current Levels and Trends: The index is closing at around 57,443.90, with a gain of 0.41%. The advance/decline ratio is positive at 8:4, indicating broader participation in the uptrend. The index is trading above key exponential moving averages (20-day, 50-day, and 200-day EMAs), confirming a strong upward trend on the weekly timeframe.
# Support and Resistance:
Support: Strong support is noted around 57,000, which has held well in recent sessions. A break below this could drag the index to 56,400–56,000. Additional support lies at 55,500, a critical level for maintaining bullish bias.
Resistance: Immediate resistance is at 57,500–57,800. A decisive break above 57,800 could push the index toward 58,000–58,400. Call options at 56,500 and 57,000 show significant open interest, reinforcing these as key resistance levels.
Technical Indicators: The Relative Strength Index (RSI) on the weekly timeframe is at 67.31, showing a reversal toward the upside, indicating strengthening momentum. However, a bearish divergence on the 4-hour chart remains unresolved, suggesting a potential correction toward 52,000 if the bullish structure weakens.
-- Bullish trend, next target 61,000 if we break and close above 57,800 on weekly timeframe --
Chart for reference.
- Disclaimer --
This analysis is based on recent technical data and market sentiment from web sources. It is for informational purposes only and not financial advice. Trading involves high risks, and past performance does not guarantee future results. Always conduct your own research or consult a SEBI-registered advisor before trading.
#Boost and comment will be highly appreciated
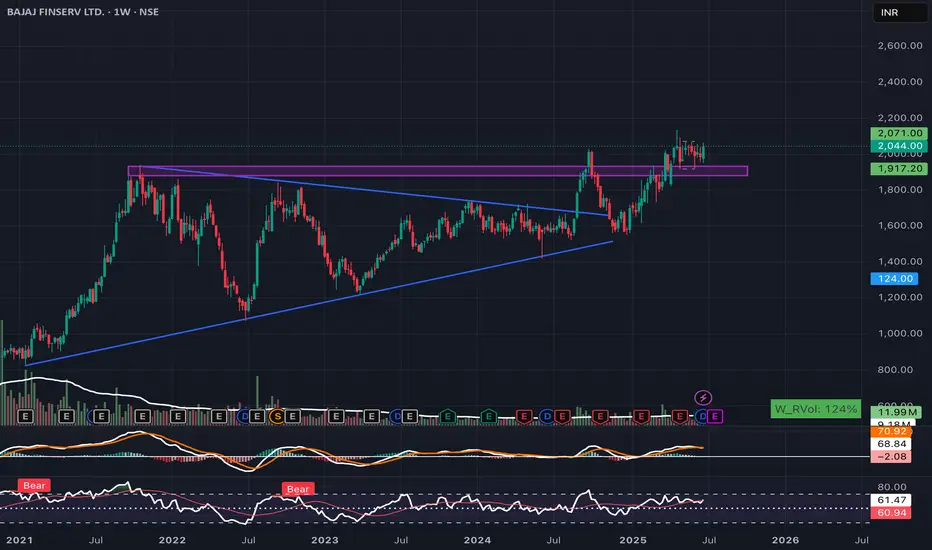
BAJAJ FINSERV – Ready for All-Time High📈BAJAJ FINSERV – Ready for All-Time High
Date: June 27, 2025 | Timeframe: Weekly | NSE
Breakout from multi-year triangle and horizontal resistance at 1917 is holding strong. Price is consolidating near 2044, building strength for the next move.
Key Levels:
* Support: 1917
* Resistance: 2071, then blue sky
* Indicators: RSI holding above 60, MACD shows strong bullish momentum
View: As long as 1917 holds, stock looks poised to reclaim and surpass all-time highs.
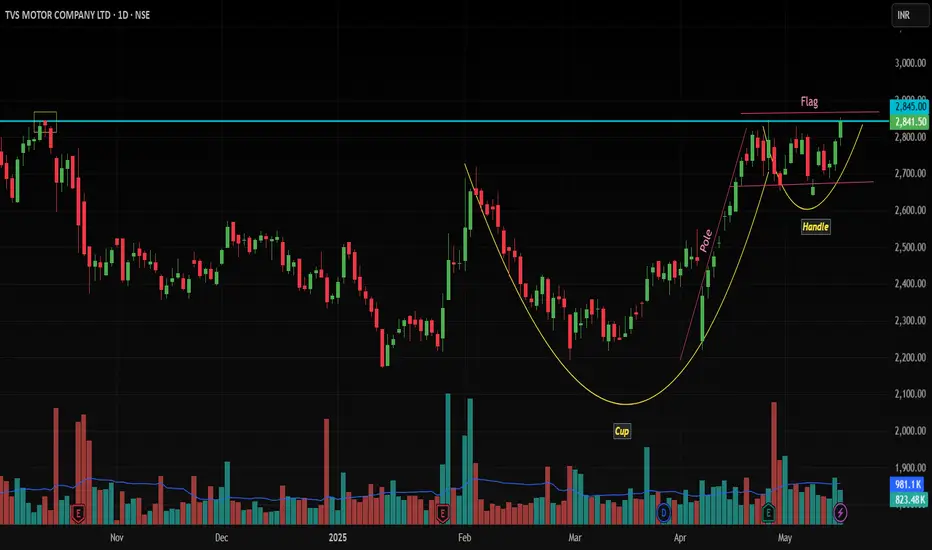
TVSMOTOR Breakout Alert: Cup & Handle Pattern Eyes ATH !Daily Timeframe Analysis:
Price Action: Sustained bullish momentum with price consolidating near the 2845 resistance (Cup & Handle pattern).
Pattern Confirmation:
Cup Formation (Multi-month): Reflecting accumulation.
Handle Consolidation: Short-term bullish flag pattern near 2845, signaling readiness for breakout.
Volume Trend: Rising volume during upward moves indicates strong buying interest.
EMA Alignment: Price comfortably trades above 20 EMA (dynamic support) and 200 EMA (long-term trend baseline).
Technical Indicators:
RSI (14): Bullish crossover above 60, confirming strengthening upward momentum.
MACD: Bullish signal line crossover.
Support/Resistance:
Key Support: 2655 (swing low, invalidation level).
Breakout Zone: 2845-2880 (critical resistance to watch).
Trade Strategy (Positional):
Entry Trigger: Breakout and close above 2845 with retest confirmation.
Stop Loss: 2655 (below handle’s swing low; protects against false moves).
Targets:
2958 (All-Time High, immediate liquidity zone).
Open Sky Above ATH (structural resistance absent beyond 2958).
Risk-Reward: 1:3+ (favorable asymmetry).
Why This Works?
Pattern Strength: The Cup & Handle is a high-probability bullish continuation pattern. A breakout above 2845 confirms the uptrend resumption.
Indicator Synergy: RSI bullish crossover + price above key EMAs aligns with institutional accumulation.
Volume Validation: Rising volume on upward legs signals conviction.
Risk Management:
Risk 1-2% of capital per trade.
Trail stop loss to breakeven at 2958. Partial profit booking advised at ATH.
Chart Notes:
A close below 2655 invalidates the setup (watch for breakdown signals).
Surge in volume on breakout adds conviction.
Final Take:
TVSMOTOR’s daily chart shows a textbook Cup & Handle pattern, supported by rising volume and bullish momentum. A breakout above 2845 opens the path to retest ATHs, with minimal resistance beyond. Trade the breakout, respect the SL, and ride the trend!
#TVSMOTOR #Breakout #CupAndHandle #TechnicalAnalysis #Bullish
Disclaimer: This is not financial advice. Always conduct your own analysis.
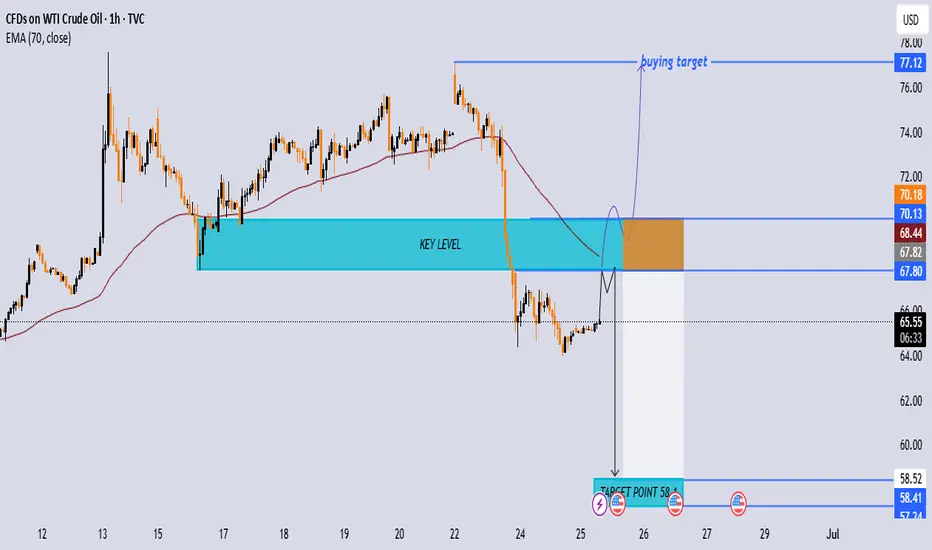
WTI Crude Oil 1H Chart — Key Rejection or Breakout SetupWTI Crude Oil (1H) Chart Analysis with Emojis:
🔵 Key Level Zone (67.80 - 70.18 USD)
👉 Major decision area — 🔥 Watch for reaction!
⚠️ Potential for price rejection here.
🔻 Primary Bearish Scenario:
🔵 Price moves up to Key Level zone (Blue Box).
🔴 Red Dot — Entry for potential Sell if rejection confirmed.
🎯 Target Point: 58.1 USD marked with a 🎯 and 🔵 Blue Dot.
💡 Historical support zone here.
Alternate Bullish Scenario:
✅ Break above 70.18 USD with strong momentum.
🟢 Green Dot — Entry confirmation above resistance.
📈 Buying Target: 77.12 USD marked and 🔵 Blue Dot.
Key Indicators:
📏 EMA 70 (68.44 USD) — Dynamic resistance, price may react here.
👀 Price hovering below — indicating bearish bias unless broken.
Trade Tips:
✔️ Wait for rejection at Key Zone for sell setup 🔻.
✔️ Break & retest above 70.18 USD for potential buy setup 🔼.
✔️ Use stop-loss to manage risk.