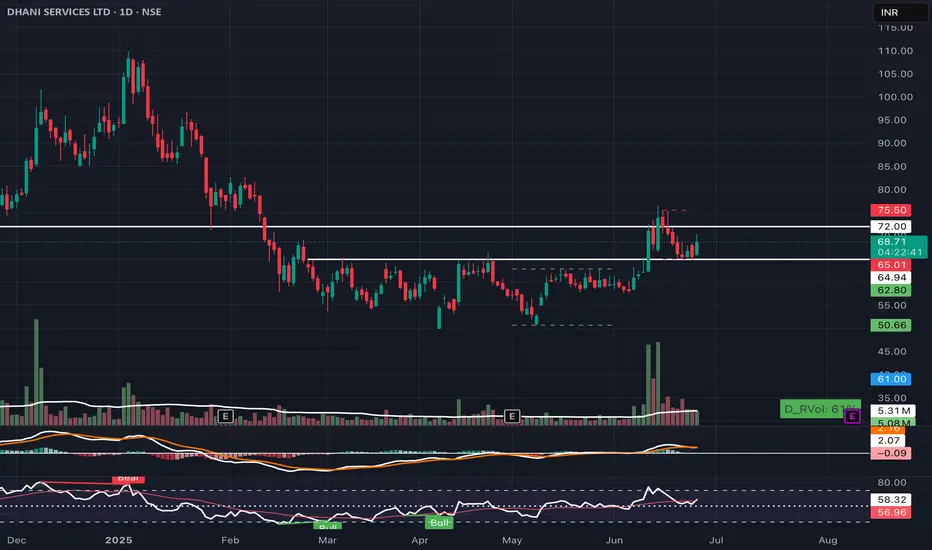
DHANI SERVICES – Retest and Rebound Setup📈 DHANI SERVICES – Retest and Rebound Setup
Date: June 25, 2025 | Exchange: NSE | Timeframe: Daily
Dhani is bouncing after a successful retest of the breakout zone near ₹64–₹65. Price has reclaimed key support with volume pickup, signaling buyer interest.
Key Levels:
* Resistance: ₹72 / ₹75.5
* Support: ₹68 / 65
* Indicators: RSI rebounding from support, MACD improving
View: Positive price action above ₹65 suggests continuation toward ₹72+. Bullish bias holds unless price breaks below ₹65
Search in ideas for "INDICATORS"
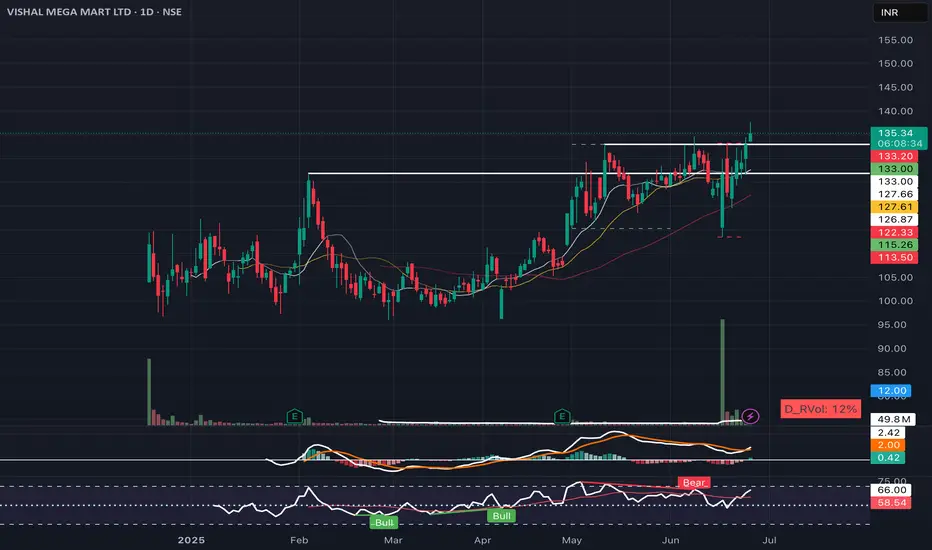
VISHAL MEGA MART – Breakout Above Resistance📈 VISHAL MEGA MART – Breakout Above Resistance
Date: June 25, 2025 | Exchange: NSE | Timeframe: Daily
Vishal Mega Mart has broken out above a key resistance at 133–134 with strong follow-through. Price is now sustaining above the prior range high, confirming a bullish structure.
Key Levels:
* Support: 133 / 127.5
* Indicators: MACD in bullish territory, RSI near breakout zone (67)
View: Bullish bias intact. Sustained move above 134 could lead to momentum continuation toward 145+ levels in the short term.
Indian Metals & Ferro Alloy: Flag & Pole BONSE:IMFA Breaks out of the Flag & Pole Pattern with Huge Volumes today.
Price Action Analysis:
- Stock experienced a significant decline from highs around 998.80 to lows near 549.80, representing approximately a 45% correction
- Recent breakout above 720 levels shows strong momentum reversal
- Current price at 772.50 (+ 7.77%) indicates bullish sentiment returning
- Higher highs and higher lows pattern emerging on the right side of the chart
Volume Spread Analysis:
- Volume spike coinciding with recent breakout confirms genuine buying interest
- Volume of 202.22K appears elevated compared to previous months
- Green volume bars during the recent rally suggest an accumulation phase
- Low volume during the consolidation phase indicates smart money positioning
Key Technical Levels:
Support Levels
- Primary Support: 720-730 (recent breakout zone)
- Secondary Support: 680-690 (previous resistance turned support)
- Major Support: 600-620 (previous consolidation zone)
Resistance Levels:
- Immediate Resistance: 800-820
- Major Resistance: 880-900
- Long-term Resistance: 950-998 (previous highs)
Base Formation:
- Cup and Handle pattern visible with base formation between 550-680 levels
- Duration of base: Approximately 4-5 months (February to June 2025)
- Handle formation in the May-June period before the breakout
- Flag & Pole Pattern Broke today
Technical Patterns Identified:
Primary Pattern: Cup and Handle
- Well-defined cup formation with rounded bottom
- Handle shows controlled pullback with lower volume
- Breakout above handle resistance confirms pattern completion
- Target projection: 950+ levels based on pattern height
Secondary Patterns:
- Descending trendline resistance tested today
- Double bottom formation around 550-580 levels
- Bullish flag formation post-breakout
Trade Setup Recommendations:
Entry Strategy:
- Aggressive Entry: Current levels 770-775 on any minor dip
- Conservative Entry: 720-730 on pullback to breakout zone
- Momentum Entry: Above 800 for trend continuation
Exit Strategy:
- Target 1: 850 (10% upside from current levels)
- Target 2: 920 (19% upside potential)
- Target 3: 980 (27% upside to retest previous highs)
Stop-Loss Levels:
- For aggressive entries: 720 (7% risk)
- For conservative entries: 680 (6% risk from 720 entry)
- Trailing stop: 8-10% below recent swing lows
Risk Management Framework:
Position Sizing:
- Risk per trade: Maximum 2% of portfolio
- Position size calculation: Portfolio value × 2% ÷ stop-loss distance
- For ₹1 lakh portfolio with 7% stop: ₹2,000 ÷ 0.07 = ₹28,571 position size
Risk Controls:
- Maximum exposure to single stock: 5% of portfolio
- Sector concentration limit: 15% in the metals sector
- Use of position sizing calculator mandatory
- Weekly portfolio review and rebalancing
Sectoral Backdrop Analysis:
Metals Sector Dynamics:
- Global steel demand recovery supporting Indian metal stocks
- Infrastructure spending by the government boosts domestic demand
- Raw material cost stabilization improves margins
- Export opportunities are increasing with global supply chain shifts
Industry Tailwinds:
- The government's focus on infrastructure development
- PLI schemes supporting the manufacturing sector
- Green energy transition requiring metal inputs
- Automotive sector recovery driving steel demand
Fundamental Considerations:
Company Specific Factors:
- Debt reduction initiatives improving balance sheet strength
- Capacity expansion plans supporting long-term growth
- Technology upgrades enhancing operational efficiency
- ESG compliance improving institutional investor interest
Macroeconomic Factors:
- Rupee stability supporting import-dependent operations
- Interest rate environment favourable for the capital-intensive sector
- Government policy support for domestic manufacturing
- Global commodity cycle showing signs of recovery
Trading Psychology Notes:
Behavioural Considerations:
- Stock showing classic accumulation after major decline
- Institutional buying is likely during the base formation period
- Retail sentiment improving with breakout confirmation
- FOMO factor may drive further momentum
Market Sentiment Indicators:
- Relative strength improving against the broader market
- Sector rotation favours cyclical stocks
- Technical breakout attracting momentum traders
- Long-term investors find value after the correction
My take:
This technical setup presents a compelling risk-reward opportunity with clearly defined entry, exit, and risk management parameters. The combination of a strong technical breakout and improving sectoral fundamentals creates a favourable environment for potential gains.
Keep in the Watchlist.
NO RECO. For Buy/Sell.
📌Thank you for exploring my idea! I hope you found it valuable.
🙏FOLLOW for more
👍BOOST if you found it useful.
✍️COMMENT below with your views.
Meanwhile, check out my other stock ideas on the right side until this trade is activated. I would love your feedback.
Disclaimer: "I am not a SEBI REGISTERED RESEARCH ANALYST AND INVESTMENT ADVISER."
This analysis is intended solely for informational and educational purposes and should not be interpreted as financial advice. It is advisable to consult a qualified financial advisor or conduct thorough research before making investment decisions.

"EUR/USD Bearish Reversal from Resistance: Targeting Key SupportTechnical analysis of EUR/USD (Euro / U.S. Dollar) on the 2-hour timeframe and outlines a bearish reversal setup after a rally into resistance.
---
🧭 Analysis Overview:
Current Bias: Bearish correction/reversal from resistance
Trend Context: Price is reacting from the upper boundary of a rising channel
Indicators:
EMA 50 (1.15305) and EMA 200 (1.14734) are in a bullish crossover, but price is rejecting near the highs.
RSI (14): At 63.42, nearing overbought territory, signaling possible weakening momentum.
---
📌 Key Technical Elements:
1. Resistance Level:
Price tested a key horizontal resistance near 1.1610 – 1.1620 and faced strong selling pressure (indicated by red arrows).
This area aligns with the upper trendline of the ascending channel, increasing the likelihood of a rejection.
2. Bearish Price Path:
The projected path shows a potential series of lower highs and lower lows, implying a correction or short-term downtrend.
The drop targets the channel support line near 1.14734 and potentially as low as the horizontal key level at 1.14578.
3. Key Support Level:
Around 1.14578, marked by historical price reactions and aligned with EMA 200, this is a logical bearish target.
4. Measured Move:
Vertical measurement suggests a -1.58% downside move, reflecting the size of the previous bullish rally that may now unwind.
---
🎯 Trading Idea:
Setup: Bearish reversal from resistance
Entry: Near 1.1600–1.1620 zone after confirmation (e.g., bearish candlestick or divergence)
Target: 1.14734 first, 1.14578 as extended target
Stop-Loss: Above resistance (1.1630+)
---
🛑 Risk Factors & Considerations:
Watch for fundamental events (indicated by icons), including economic releases, that can cause volatility.
RSI divergence or weakening volume would further confirm the bearish bias.
If price breaks above the resistance zone, this analysis would be invalidated and a bullish breakout may occur.
---
✅ Summary:
This is a bearish pullback setup following a resistance rejection near the top of a rising channel. The idea anticipates a drop toward key support levels, especially around 1.14734–1.14578. Risk is defined by the invalidation zone above resistance.
Feedback My idea like and comment's 🙏

"Gold (XAU/USD) Bearish Continuation Setup: Resistance RejectionTechnical analysis of the Gold Spot / USD (XAU/USD) on the 15-minute timeframe, and it appears to reflect a bearish outlook. Here's a breakdown of the idea being presented:
---
🧭 Analysis Overview:
Trend Direction: Downtrend (bearish channel)
Price Action: Lower highs and lower lows, confined within a downward sloping channel
Indicators:
EMA 50 & EMA 200: Price is trading below both EMAs, confirming bearish pressure.
RSI (14): RSI is below 50, around 40.78, indicating weak bullish momentum or continuation of bearish bias.
---
📌 Key Technical Elements:
1. Resistance Zone:
Marked near 3,345.482, price is expected to retest this level but fail to break above.
Rejections at this level align with previous EMA resistance and trendline resistance.
2. Descending Channel:
Price action is contained within clearly defined upper and lower trendlines.
Indicates continuation of the downtrend unless a breakout occurs.
3. Bearish Rejection Pattern:
The chart expects the price to approach the resistance level, get rejected, and continue downward.
4. Target Point:
Clearly marked at 3,302.928, which aligns with the lower boundary of the channel.
This serves as a potential short target for traders.
5. RSI:
RSI previously reached oversold (around 27), suggesting a minor pullback, but now recovering modestly (still below 50).
This indicates there's room for another move down before reaching extreme oversold conditions again.
---
🎯 Trading Idea:
Entry: Near resistance zone around 3,345 after bearish confirmation (e.g., rejection candle or bearish engulfing).
Stop-Loss: Just above resistance/EMA levels (around 3,350+).
Target: 3,302.928 (channel support / previous swing low).
---
🛑 Risk Management & Notes:
Be cautious of U.S. economic news (calendar icon shown), which can cause sudden volatility.
Confirmation from candlestick patterns or momentum divergence would strengthen the setup.
A break above the resistance zone would invalidate the short idea.
---
✅ Summary:
This is a short-biased setup within a well-defined downtrend, targeting continuation to the downside. The analyst expects a pullback to resistance followed by a drop to the lower channel support around 3,302.93.
Feedback My idea like and comment's 🙏

Insightful Dive into Gold Spot / U.S. Dollar (XAU/USD) 15-MinuteHistorical Flow: The chart tracks the Gold Spot / U.S. Dollar (XAU/USD) price action on a 15-minute timeframe from June 22 to June 24, 2025. The price climbed steadily until around 21:00 on June 23, followed by a noticeable drop, suggesting a potential shift from an upward trend to a corrective phase along a descending trendline.
Key Levels:
Stop Loss: Positioned at $3,382.374 (red line), serving as the upper threshold to exit a short position if the price reverses.
Entry: Marked at $3,370.510 (gray line), indicating the optimal entry point for a short trade near the trendline break.
Target 1: Set at $3,365.880 (green line), the initial profit-taking level below the entry.
Target 2: Aimed at $3,346.664 (green line), offering a deeper profit zone.
Target 3: Projected at $3,335.066 (green line), the furthest target for the short trade.
Support: The $3,321.57 level (green line) acts as a potential support if the downward move continues.
Recent Price Action: The price reached a high near $3,382.374 and then breached the downtrend line (highlighted with a yellow circle), signaling a shorting opportunity. As of 18:27 UTC on June 23 (11:57 PM IST, June 23, 2025), it has declined to $3,360.330, reflecting sustained bearish momentum.
Projected Movement: The downward trajectory suggests a potential drop to Target 1 at $3,365.880, with possibilities of reaching Target 2 at $3,346.664 and Target 3 at $3,335.066 if the bearish trend holds. A move above $3,382.374 could indicate a bullish reversal.
Volume and Indicators: The chart features Bollinger Bands (O3,360.030 H3,363.990 L3,359.245 C3,360.330) with a -0.240 (-0.01%) change, pointing to low volatility. The trendline break hints at increased selling pressure, though specific volume data is unavailable.
Outlook: This chart supports a shorting strategy with a defined entry and stop loss. The price is currently in a bearish phase following the trendline break, with targets at $3,365.880, $3,346.664, and $3,335.066. Watch for a break above $3,382.374, which could signal a shift to a bullish trend.

Gold XAU/USD Bullish Reversal Setup – Targeting $3,454.65Price: $3,384.41
Strategy: Buy/Long
🟦 Key Levels:
Entry Zone: Around $3,345.76
This level aligns with a previously tested support zone marked in purple.
Stop Loss: $3,331.56
Below the support zone, providing downside protection if the setup fails.
Target (TP): $3,454.65
Marked as EA TARGET POINT, suggesting a potential upside of 3.16% (~$105.83 gain).
📊 Technical Indicators:
Moving Averages:
200 EMA (blue): Near the entry level, adds strength to the support zone.
50 EMA (red): Recently crossed below price, indicating early bullish momentum.
Price Action:
Sharp bounce from support suggests buying interest.
Potential inverse head and shoulders pattern forming, which is a bullish reversal pattern.
🧠 Trade Idea:
Buy near $3,345.76,
Stop Loss at $3,331.56,
Take Profit at $3,454.65
Risk/Reward Ratio ≈ 1:3.3 — favorable setup for long positions.

Analysis of Gold Spot / U.S. Dollar (XAU/USD) 15-Minute Chart
Historical Trend: The chart displays the price movement of Gold Spot / U.S. Dollar (XAU/USD) on a 15-minute timeframe from June 21 to June 24, 2025. The price followed a downtrend, defined by a descending trendline, after peaking around $3,367.574, with a recent decline toward $3,367.255 as of 16:04 UTC on June 23.
Key Levels:
Stock Loss: Set at $3,360.820 (red line), indicating the upper limit to exit a short position if the price reverses upward.
Entry: Positioned at $3,367.574 (gray line), marking the entry point for a potential short trade near the trendline.
Target 1: $3,375.557 (green line), the first profit-taking level above the entry.
Target 2: $3,388.090 (green line), the second profit-taking level for a larger gain.
Support: The $3,390.915 level (green line) acts as a potential support zone if the downtrend continues.
Recent Price Action: The price approached the downtrend line and showed a rejection, forming a potential shorting opportunity (highlighted with a yellow circle). The price is currently testing the $3,367.255 level, suggesting continued bearish momentum after breaking below the entry zone.
Projected Movement: The downward projection suggests the price could decline toward the $3,360.820 stop loss level if the bearish trend persists. A break below this could lead to further drops, while a bounce might target the $3,375.557 or $3,388.090 resistance levels.
Volume and Indicators: The chart includes Bollinger Bands (O3,367.260 H3,367.810 L3,366.747 C3,367.255) with a -0.040 (-0.00%) change, indicating low volatility. The trendline break suggests selling pressure, though specific volume data is not detailed.
Outlook: The chart outlines a shorting strategy with a clear entry and stop loss. The price is in a bearish phase, with potential targets at $3,375.557 and $3,388.090 if the downtrend continues. Monitor for a break above $3,360.820 to reassess the trade, as it would signal a bullish reversal.

Analysis of Gold Spot / U.S. Dollar (XAU/USD) 15-Minute ChartHistorical Trend: The chart displays the Gold Spot / U.S. Dollar (XAU/USD) price movement on a 15-minute timeframe from June 22 to June 23, 2025. The price experienced a sharp decline from a peak around $3,369.447, followed by a potential reversal pattern.
Key Levels:
Stop Loss: Set at $3,369.447 (red line), indicating the upper limit to exit a short position if the price reverses upward.
Entry: Positioned at $3,362.463 (gray line), marking the entry point for a potential short trade after the peak.
Target 1: $3,353.009 (green line), the first profit-taking level.
Target 2: $3,340.915 (green line), the second profit-taking level.
Target 3: $3,323.157 (green line), the final target for the short trade.
Recent Price Action: The price peaked near $3,369.447 and began a downward move, forming a potential shorting opportunity (labeled 1-5). The chart suggests a bearish pattern with the price breaking below a support level, followed by a retest (2) and continuation downward (3, 4). The current position (5) indicates the price is approaching Target 1.
Projected Movement: The downward projection suggests the price could reach Target 1 at $3,353.009, with potential to hit Target 2 at $3,340.915 and Target 3 at $3,323.157 if the bearish momentum persists. A break above $3,369.447 would invalidate the short setup.
Volume and Indicators: The chart includes Bollinger Bands (O3,362.860 H3,363.070 L3,361.747 C3,362.295) with a -0.615 (-0.02%) change, indicating low volatility. The pattern suggests a momentum shift, though specific volume data is not detailed.
Outlook: The chart outlines a shorting strategy with clear entry and exit levels. The price is currently in a bearish phase, with potential targets at $3,353.009, $3,340.915, and $3,323.157. Monitor for a break above $3,369.447 to reassess the trade, as it would signal a bullish reversal.

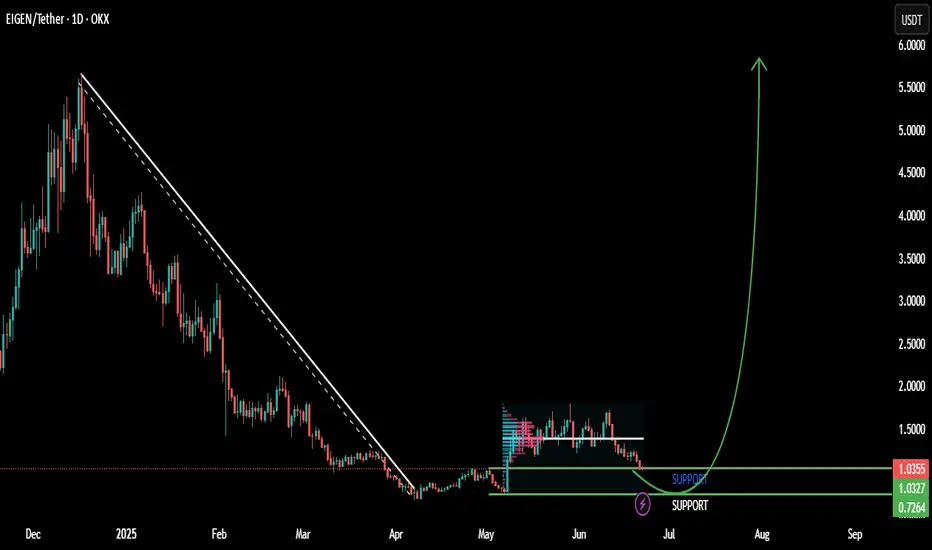
Analysis of Eigen / Tether (EIGEN/USDT) 1-Day ChartHistorical Trend: The chart shows the price movement of Eigen / Tether (EIGEN/USDT) on a 1-day timeframe from November 2024 to June 2025. The price followed a prolonged downtrend, defined by a descending trendline, from late 2024 until a recent reversal.
Key Levels:
Support: The $1.034 and $0.761 levels (green lines) have acted as significant support zones. The price recently bounced from around $0.761, indicating strong buying interest at this level.
Resistance: The upward projection (green arrow) suggests potential resistance around $6,000, though no specific resistance line is marked yet.
Recent Price Action: After hitting a low near $0.761 in mid-2025, the price broke above the downtrend line, signaling a potential trend reversal. This breakout was followed by a sharp upward move, suggesting a shift to bullish momentum.
Projected Movement: The upward projection indicates the price could target levels as high as $6,000 if the bullish trend continues. The initial support at $1.034 and $0.761 will be critical to hold to sustain this momentum.
Volume and Indicators: The chart includes Bollinger Bands (O1.0362 H1.0591 L1.014 C1.0304) with a -0.0047 (-0.45%) change, indicating low volatility at the recent low. The breakout suggests increasing buying volume, though specific volume data is not detailed.
Outlook: The trend line breakout and sharp upward move indicate a strong bullish reversal. Maintaining above $1.034 is key for the uptrend to continue. A failure to hold this level could see the price retest $0.761 support. Watch for confirmation of sustained momentum toward higher resistance levels.
Analysis of Gold Spot / U.S. Dollar (XAU/USD) 15-Minute Chart
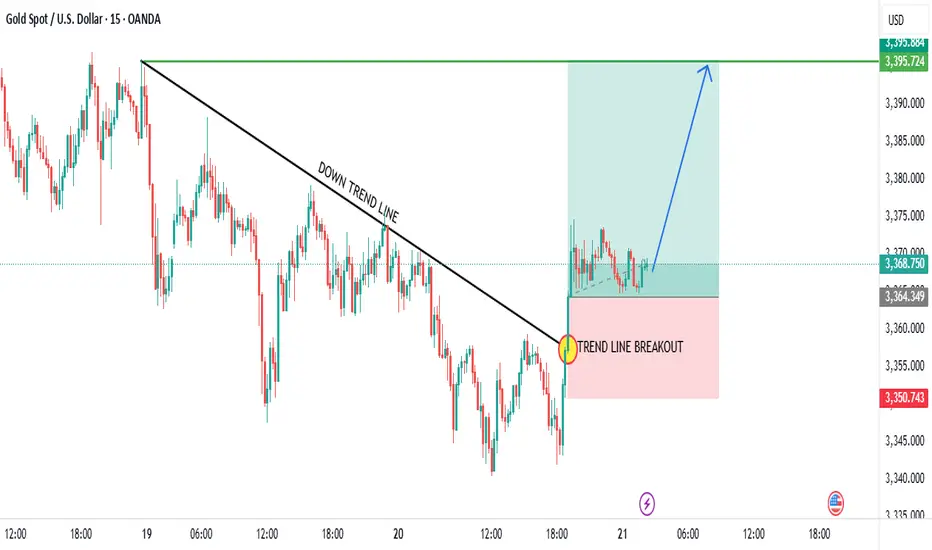
Historical Trend: The chart displays the Gold Spot / U.S. Dollar (XAU/USD) price movement on a 15-minute timeframe from June 19 to June 22, 2025. The price was in a clear downtrend, defined by a descending trendline, until a recent shift.
Key Levels:
Resistance: The $3,395.724 level (green line) has emerged as a significant resistance following the breakout. A break above this could confirm further upside.
Support: The $3,350.743 level (red line) acted as a major support during the downtrend and was recently breached upward.
Recent Price Action: The price broke above the downtrend line (highlighted with a yellow circle and labeled "TREND LINE BREAKOUT" in red), indicating a potential reversal. This breakout occurred around 12:00 on June 21, followed by a sharp upward move into a consolidation zone (light green).
Projected Movement: The upward projection (blue arrow) suggests the price could target levels around $3,380.00-$3,400.00 if the breakout momentum continues. The consolidation above $3,350.743 supports the bullish outlook.
Volume and Indicators: The chart includes Bollinger Bands (O3,368.320 H3,369.500 L3,367.660 C3,368.750) with a -0.360 (-0.01%) change, indicating low volatility. The breakout suggests increasing buying interest, though specific volume data is not detailed.
Outlook: The trend line breakout signals a potential shift from bearish to bullish momentum. Maintaining above $3,350.743 is crucial for the uptrend to continue. A failure to hold this level could see the price retest the downtrend line or lower supports. Monitor for confirmation of sustained momentum above resistance.
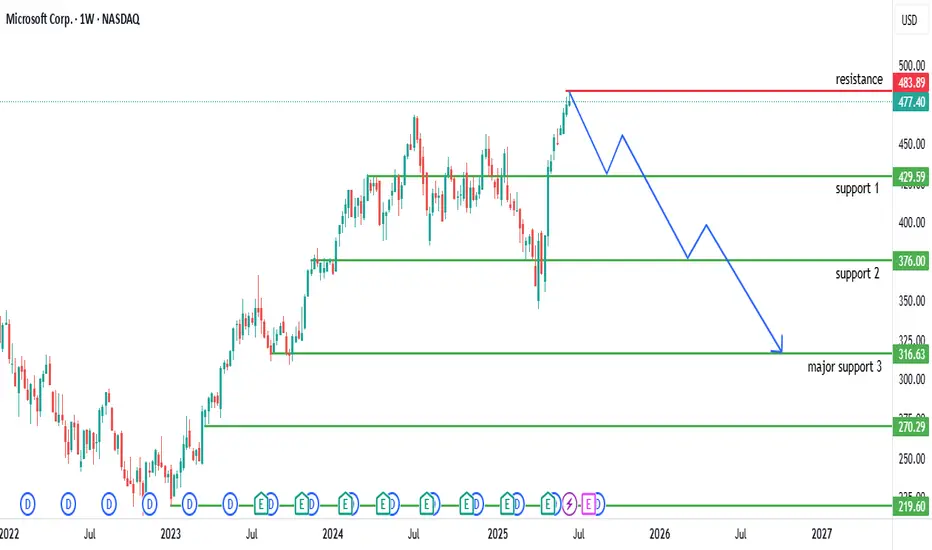
Analysis of Microsoft Corp. (MSFT) Weekly ChartHistorical Trend: The chart illustrates Microsoft Corp.'s stock price on a weekly timeframe from 2022 to mid-2025. The stock showed a steady upward trend from 2022 to early 2025, reflecting strong growth driven by its dominance in software and cloud computing.
Key Levels:
Resistance: The $483.89-$477.40 range (red line) has acted as a significant resistance level. The price recently tested this zone and appears to have faced rejection.
Support Levels:
Support 1: $425.59 (green line) served as a mid-range support during recent corrections.
Support 2: $376.00 (green line) acted as a stronger support level during prior consolidations.
Major Support 3: $316.63 (green line) represents a critical long-term support zone, tested during deeper pullbacks.
Recent Price Action: After approaching the resistance at $483.89, the stock experienced a sharp decline, forming a descending pattern (blue line). This suggests a potential bearish reversal or correction following the rejection at resistance.
Projected Movement: The downward projection indicates the stock could decline toward the $316.63 major support level if the bearish momentum continues. A break below $376.00 would confirm this trend, while a bounce from $425.59 could signal a potential recovery.
Volume and Indicators: The chart includes Bollinger Bands (O475.21 H483.46 L474.08 C477.40) with a -2.44 (-0.51%) change, indicating moderate volatility. The recent drop suggests selling pressure, though specific volume data is not detailed.
Outlook: The stock is currently in a bearish phase after failing to break above $483.89. Watch for a potential test of $425.59 or $376.00 supports. A recovery above $477.40 would indicate a resumption of the bullish trend, while a drop below $316.63 could signal a deeper correction.
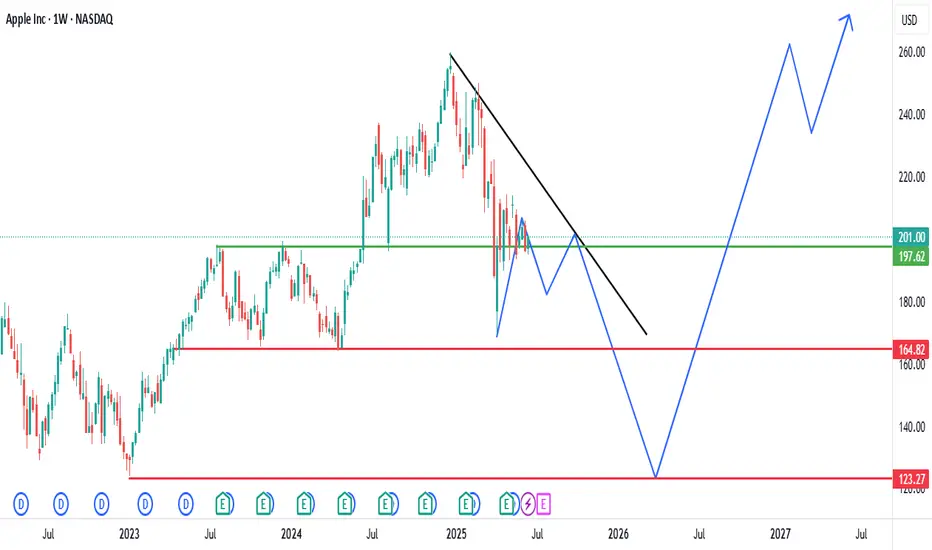
Analysis of Apple Inc. (AAPL) Weekly ChartHistorical Trend: The chart shows Apple Inc.'s stock price on a weekly timeframe from 2022 to mid-2025. The stock exhibited a strong upward trend from 2022 to early 2025, with notable growth followed by periods of consolidation and correction.
Key Levels:
Resistance: The $201.00-$197.62 range (green line) has acted as a significant resistance level. The price recently broke above this zone, suggesting potential bullish momentum.
Support: The $164.82 level (red line) has served as a major support zone. The stock tested this level during a recent decline and rebounded, indicating its strength.
Recent Price Action: After reaching a peak near $201.00, the stock entered a descending triangle pattern (black trendline). A breakout above the resistance at $201.00 is evident, accompanied by an upward projection (blue arrow), hinting at a possible continuation of the bullish trend.
Projected Movement: The upward projection suggests the stock could target levels around $240.00-$260.00 if the breakout holds. However, a failure to maintain above $201.00 might lead to a retest of the $164.82 support.
Volume and Indicators: The chart includes Bollinger Bands (O197.30 H201.70 L195.07 C201.00) with a -4.55 (-2.22%) change, indicating recent volatility. Specific volume data is not detailed, but the breakout suggests increasing buying pressure.
Outlook: The stock is currently in a bullish phase following the breakout above $201.00.
Maintaining above this level could drive further gains, while a drop below might signal a return to the $164.82 support. Close monitoring of price action around these levels is recommended.
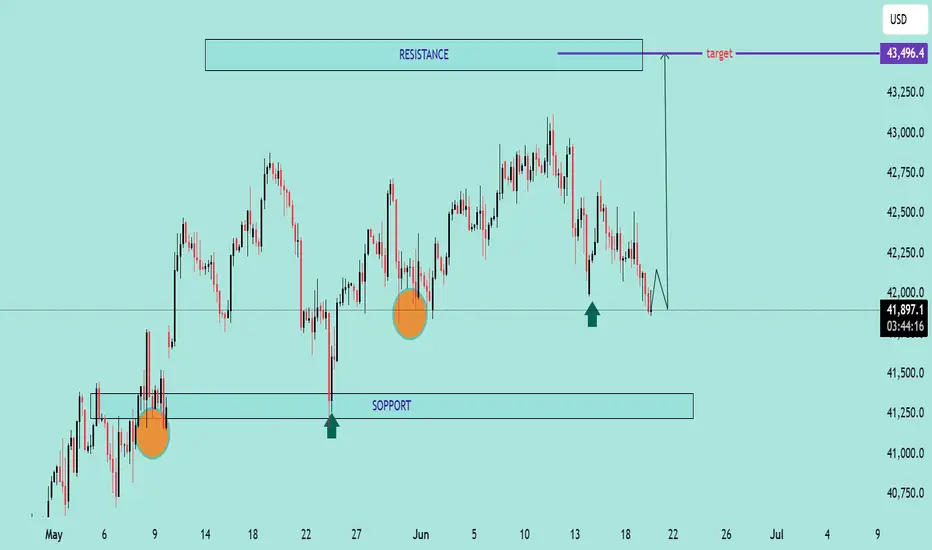
US30 Potential Rebound from Key Support ZoneUS30 Potential Rebound from Key Support Zone 🚀📊
📉 Analysis Overview:
The US30 (Dow Jones Index) is currently testing a major support zone near the 41,800–41,900 range, a level that has held firm multiple times in the past (highlighted with green arrows and orange circles). This area has acted as a demand zone, leading to strong bullish reactions previously.
🔍 Key Technical Highlights:
🔸 Support Zone: Clearly respected at ~41,800. Price is once again bouncing here.
🔸 Resistance Zone: Around 43,250–43,500. This area has acted as a ceiling, where price struggled to break through.
🟢 Reversal Indicators: Multiple successful defenses of the support zone suggest accumulation and possible bullish reversal.
📈 Target Projection: If support holds, the price may rally toward the target zone near 43,496.4, as shown by the purple arrow.
📌 Conclusion:
As long as the 41,800 support holds, US30 shows bullish potential toward the 43,500 resistance. A break below this zone would invalidate the bullish scenario and shift focus back to the lower support near 41,250.
🛑 Risk Management Tip: Watch for confirmation candles and volume before entering long positions. Always set a stop-loss below the support zone.
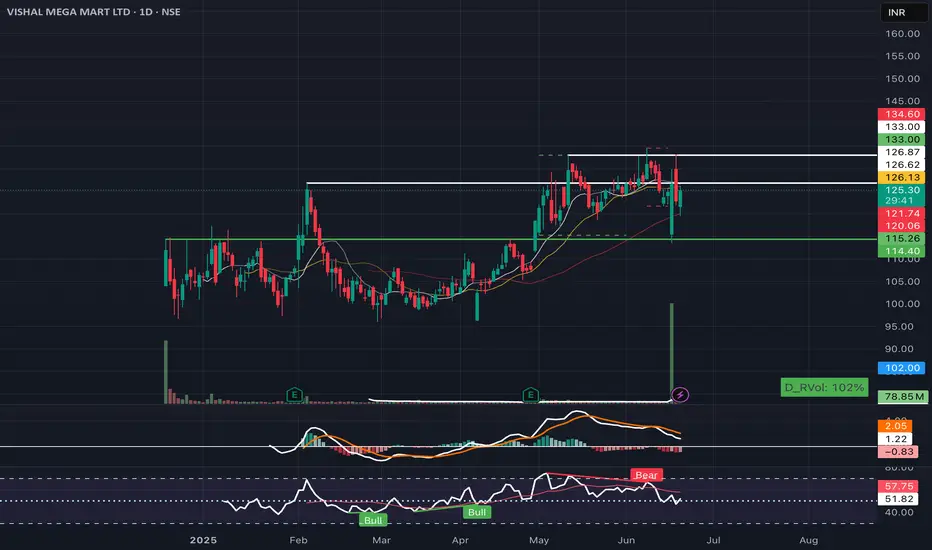
VISHAL MEGA MART – Demand Zone Bounce with Volume Surge📈 VISHAL MEGA MART – Demand Zone Bounce with Volume Surge
Date: June 19, 2025 | Exchange: NSE | Timeframe: Daily
Vishal Mega Mart rebounded sharply from the key demand zone near 114–115 with strong volumes, indicating institutional buyer interest at lower levels. Price is now reclaiming the previous consolidation zone.
Key Levels:
* Resistance: 126.6 / 133
* Support: 121.7 / 115
* Indicators: MACD near crossover, RSI rebounding from midline
View: Bullish bias as long as price holds above 121. A move above 127–128 may open path toward 140+ in the short term.
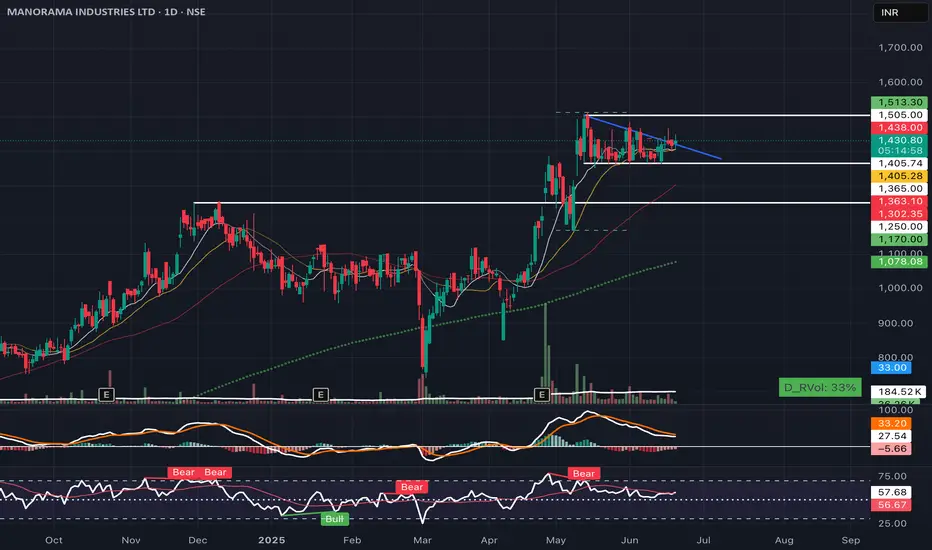
MANORAMA INDUSTRIES – Bullish Flag Setup📈 MANORAMA INDUSTRIES – Bullish Flag Setup
Date: June 19, 2025 | Exchange: NSE | Timeframe: Daily
Manorama is consolidating in a tight *bullish flag* pattern after a strong vertical rally. Price is respecting the range of 1405–1505 and is showing signs of breakout readiness.
Key Levels:
* Resistance: 1505 / 1513
* Support: 1405 / 1365
* Volume: Decreasing during consolidation, indicating healthy pause
* Indicators: MACD cooling off, RSI holding above midline
View: Bullish bias. A breakout above 1505 with volume may trigger fresh upside momentum. Keep watch for breakout confirmation.
Bullish Breakout in VIP Industries 🔍 Chart Overview:
Breakout above resistance zone at ₹420
Strong volume spike confirming buying interest
Price action broke out of a consolidation channel
Formed a bullish flag/pennant pattern before breakout
🔧 Technical Indicators:
RSI moving above 60 → bullish momentum building
MACD crossover near zero line → fresh upward signal
50 EMA support intact, stock trading above all major EMAs

XAU/USD Bullish Continuation SetupThe chart illustrates a bullish market structure for XAU/USD, with price action currently trending upwards. Key technical observations:
Support Zone:
Price has recently bounced from a support zone around 3,399.710, indicating strong buying interest.
Bullish Projection:
A bullish continuation is expected. The chart outlines a potential scenario with a minor retracement towards 3,432.835 or 3,399.710, followed by a strong upward move.
Targets:
Immediate resistance is around 3,502.669.
If broken, price may aim for 3,550.351.
Final projected target lies near 3,680.000, which aligns with a historical supply zone.
Indicators:
The green enveloping bands suggest increasing volatility, with the price respecting the upper band, supporting bullish momentum.
Conclusion:
XAU/USD appears poised for a bullish breakout continuation. A potential pullback could offer a buy opportunity, targeting higher resistance zones as long as the structure remains intact.

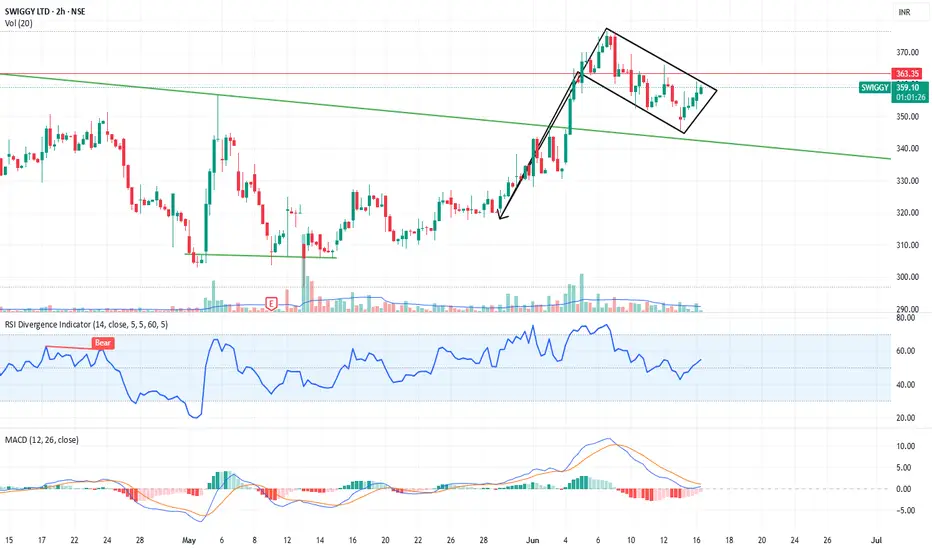
SWIGGY LTD forming a textbook bullish flag on the 2h chartChart Analysis (Study Purpose Only):
Pattern Observed: After a sharp uptrend, the stock has formed a falling channel (bullish flag) — which typically signals a continuation of the trend.
Support/Resistance:
The price is consolidating above a long-term trendline resistance, which is now acting as support.
Resistance zone is near ₹365–₹367, and support is around the ₹340–₹345 range.
Indicators:
RSI is currently at ~60, suggesting mild bullish momentum without being overbought.
MACD is in a bearish crossover but appears to be flattening, possibly preparing for a bullish crossover.
Volume: Declining volume during the pullback suggests weak selling pressure, often a bullish sign in continuation patterns.
🟢 A breakout above the upper channel with volume could confirm a bullish continuation.
WTI Crude Oil Breaks Out Toward $81 – Bullish Trend Reversal ConTechnical analysis of WTI Crude Oil chart (Daily timeframe):
---
WTI Crude Oil Bullish Breakout Setup
🛢️ Technical Overview:
Pattern: Breakout from a falling wedge/descending channel.
Key Support Level: Around $63–$65, acting as a demand zone during consolidation.
Breakout Confirmation: Price has broken the descending trendline and closed above the 50 EMA.
Target Point: Upside target projected toward the $80.99 resistance zone, which coincides with previous major highs.
📊 Indicators:
EMA 50 & EMA 200: Price has moved above both, signaling a shift to bullish momentum.
RSI (14): Currently at 77.08, indicating strong bullish momentum but also nearing overbought conditions.
📌 Trading Plan:
Entry: On a successful retest of the breakout zone (~$68–$70).
Target: $80.99
Stop Loss: Below support zone, ideally under $65.
🛡️ Risk Management Tip: Consider scaling in on a retest or lower timeframe confirmation to manage risk with RSI already stretched.
---
feedback My idea like and comment's 🙏

EUR/USD Bullish Flag Breakout Toward 1.173 TargetTechnical analysis of EUR/USD chart (1-hour timeframe):
---
Bullish Breakout Setup – EUR/USD
📈 Technical Overview:
Chart Pattern: Bullish breakout from a descending trendline.
Key Support Level: Marked around 1.15000, showing prior structure.
Current Price Action: Price is testing the trendline with a potential breakout above, marked by a bullish flag structure.
Target Point: Projected move toward 1.17317, a potential gain of +2.18% (~250.9 pips).
📊 Indicators:
EMA 50 & EMA 200: Price is above both moving averages (bullish alignment).
RSI (14): Neutral zone (~53.57), suggesting more room for upside before overbought conditions.
📌 Trading Plan:
Entry: On confirmed breakout and candle close above the descending trendline (~1.15600).
Target: 1.17317
Stop Loss: Below the support zone (~1.14950–1.15000 area).
🛡️ Risk Management: Entry should follow confirmation to avoid fakeouts. Volume spike and RSI push above 60 would strengthen the breakout case.
--
Feedback My idea like and comment's 🙏

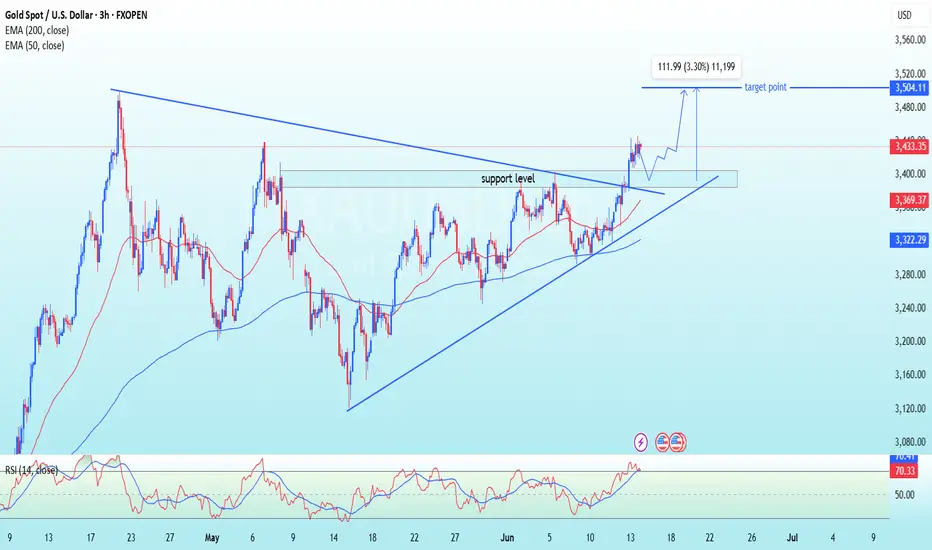
Gold (XAU/USD) Bullish Breakout Toward $3,504 TargetTechnical analysis of (XAU/USD – 3-hour timeframe):
---
Bullish Breakout Setup – Gold (XAU/USD)
📈 Technical Overview:
Chart Pattern: Ascending triangle formation.
Support Level: Strong horizontal support around $3,400.
Breakout Zone: Price is attempting a breakout above the resistance trendline.
Target Point: Projected upside target is $3,504.11, representing a potential move of +3.30% (approx. $112).
📊 Indicators:
EMA 50 & EMA 200: Price is trading above both EMAs, indicating bullish momentum.
RSI (14): Currently around 70.33, suggesting strong bullish pressure, nearing overbought territory.
📌 Trading Plan:
Entry: On confirmation of breakout and retest above the resistance zone (~$3,430).
Target: $3,504.11.
Stop Loss: Below the ascending trendline support (~$3,400).
🛡️ Risk Management: Wait for confirmation of breakout and retest before entry to avoid a false breakout scenario.
Feedback My idea like and comment's 🙏
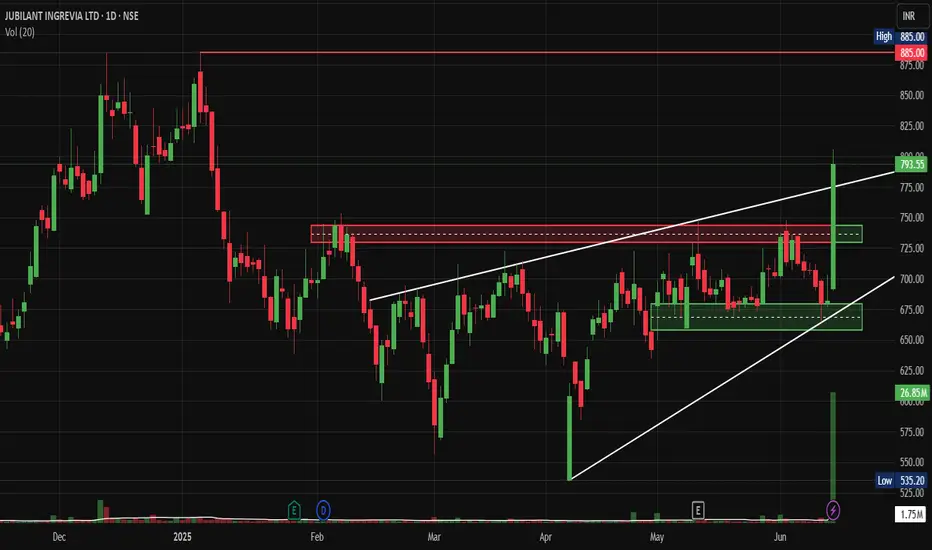
Jubilant Ingrevia: Broke Out after Stake Sell from PromotersNSE:JUBLINGREA Just Broke Out Big after Prabhudas Lilladher gave Hold Rating with a target of Rs 713 and Stake Sell from Promoters
Technical Chart Pattern:
• The stock displays a classic ascending triangle pattern formation spanning from February to June 2025
• Multiple higher lows connected by an ascending trend line (white diagonal support)
• Horizontal resistance zone around ₹735-740 levels acting as the upper boundary
• Recent breakout above the triangle pattern with strong volume confirmation
Key Support and Resistance Levels:
• Primary Support: ₹675-685 (previous resistance turned support)
• Secondary Support: ₹650-660 (trend line support)
• Major Support: ₹535-550 (swing low from March)
• Immediate Resistance: ₹800-810 (psychological level)
• Major Resistance: ₹885 (all-time high marked on chart)
Base Formation Analysis:
• Well-defined base formation between ₹650-740 levels over 4 months
• The consolidation phase showed declining volatility, indicating accumulation
• Multiple tests of resistance at ₹735-740 showing supply absorption
• Base depth of approximately 15-20% from the highs, indicating healthy correction.
Volume Spread Analysis:
Volume Characteristics:
• Significant volume spike during the recent breakout (26.85M vs average 1.75M)
• Volume expansion during upward moves and contraction during pullbacks
• Strong institutional participation is evident from the volume profile
• Volume-price correlation remains positive, supporting the uptrend
Volume Indicators:
• Above-average volume during breakout confirms genuine demand
• Recent sessions show sustained higher volumes, indicating continued interest
• No distribution patterns are visible in volume analysis
Trade Setup:
Entry Strategy:
• Primary Entry: ₹790-800 on any pullback to the breakout zone
• Aggressive Entry: Current market price around ₹799 with tight stops
• Conservative Entry: Wait for retest of ₹740-750 resistance-turned-support
• Scale-in approach recommended given the momentum
Exit Levels:
• Target 1: ₹850 (measuring the triangle height projection)
• Target 2: ₹885 (previous all-time high)
• Target 3: ₹920-950 (extended projection based on base depth)
• Trail stops above ₹850 for position management
Stop Loss Placement:
• Initial Stop Loss: ₹735 (below breakout level)
• Revised Stop Loss: ₹750 (after first target achievement)
• Final Stop Loss: ₹780 (trailing stop for remaining position)
Risk Management Framework:
Position Sizing Guidelines:
• Risk 1-2% of portfolio capital per trade
• Position size calculation: (Account Size × Risk %) ÷ (Entry Price - Stop Loss)
• Maximum position should not exceed 3-5% of the total portfolio
• Consider reducing the size given recent volatility expansion
Risk Control Measures:
• Maintain risk-reward ratio of a minimum of 1:2
• Use partial profit booking at predetermined levels
• Avoid averaging down below stop loss levels
• Monitor sector rotation and market sentiment
Fundamental and Sectoral Backdrop:
Company Overview:
• Jubilant Ingrevia operates in Speciality Chemicals, Nutrition and Health Solutions, and Chemical Intermediates segments
• Global provider serving pharmaceutical, nutrition, agrochemical, and consumer industries with a focus on quality and customization
• Serves 15 of the top 20 Global Pharma & 7 of the top 10 Global Agrochemical companies as a leading low-cost provider
Recent Financial Performance:
• Net profit jumped 153.16% year-over-year to ₹74.05 Cr in Q4 2024-2025
• Q4 2025 revenue of 1,051 cr. down from INR1,074 cr. in Q4 FY24 with EBITDA of INR148 crores showing 42% year-on-year rise
• Market capitalization of 12,664 Cr. with trailing twelve-month revenue of 4,178 Cr.
Sectoral Dynamics:
• The speciality chemicals sector is benefiting from the China+1 strategy
• Increasing demand for pharmaceutical intermediates post-COVID
• The government push for self-reliance in chemical manufacturing
• Export opportunities in agrochemical intermediates are expanding globally
Key Fundamentals:
• The company shows a low return on equity of 9.24% over the last 3 years
• Analyst average share price target of ₹735
• Strong client base with global pharmaceutical and agrochemical giants
• Diversified product portfolio, reducing concentration risk
Market Outlook and Catalysts:
Positive Catalysts:
• Expansion in speciality chemicals capacity
• New product launches in the nutrition segment
• Increasing penetration in international markets
• Potential margin expansion through product mix improvement
Risk Factors:
• Raw material price volatility
• Regulatory changes in target markets
• Currency fluctuation impact on exports
• Competition from Chinese manufacturers
My Take:
This technical setup presents a compelling opportunity with the stock breaking out of a well-defined pattern, supported by strong fundamentals and favourable sector dynamics. The risk-reward profile appears attractive for traders and investors willing to manage position size appropriately.
Keep in the Watchlist.
NO RECO. For Buy/Sell.
📌Thank you for exploring my idea! I hope you found it valuable.
🙏FOLLOW for more
👍BOOST if you found it useful.
✍️COMMENT below with your views.
Meanwhile, check out my other stock ideas on the right side until this trade is activated. I would love your feedback.
Disclaimer: "I am not a SEBI REGISTERED RESEARCH ANALYST AND INVESTMENT ADVISER."
This analysis is intended solely for informational and educational purposes and should not be interpreted as financial advice. It is advisable to consult a qualified financial advisor or conduct thorough research before making investment decisions.