Options Strategy Breakdown – For Educational Purpose Only________________________________________
📈 Options Strategy Breakdown – For Educational Purpose Only
🧠 Learn to Structure a Bull Call Spread Strategically
________________________________________
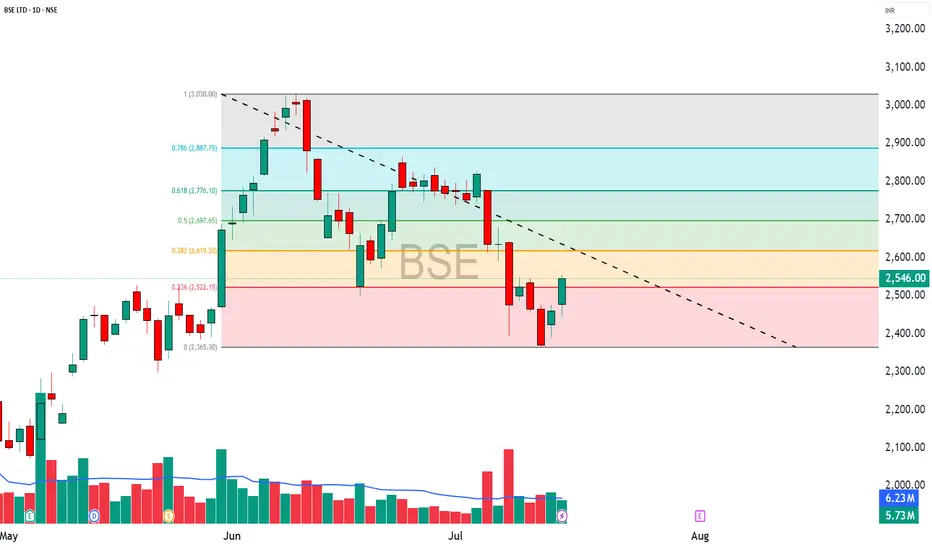
🔹 Stock Name: BSE
🔹 Spot Price: ₹2546
🔹 Lot Size: 375
🔹 Number of Lots: 1
🔹 Expiry Date: 31-July-2025
🕒 DTE (Days to Expiry): 16 Days
💡 Strategy Type: Bull Call Spread – Limited Risk | Limited Reward Option Structure
________________________________________
📘 Strategy Construction (Illustrative Example):
1️⃣ Buy Call Option – Strike: ₹2500 | Premium Paid: ₹125
2️⃣ Sell Call Option – Strike: ₹2600 | Premium Received: ₹76
🧮 Net Premium Outflow: ₹49
(₹125 - ₹76 = ₹49 * 375 = ₹18,375)
________________________________________
📊 Payoff Metrics (Illustrative & Hypothetical):
• 🔹 Breakeven Point: ₹2549.00
• 📈 Maximum Profit: ₹19,125 (When Spot ≥ ₹2600)
• ⚠️ Maximum Loss (Capital Deployed): ₹18,375 (if Spot ≤ ₹2500)
• 🔄 Real-Time PnL: Subject to market movement
• 🎯 Suggested Profit Booking Threshold: ₹18,375 (illustrative target)
• 🛑 Reversal Exit Point (Invalidation): Spot < ₹2487.75 (Support Violation)
________________________________________
📌 Why Learn This Strategy?
The Bull Call Spread is a risk-defined options strategy designed for moderately bullish views. It reduces premium cost compared to naked options and has a clearly capped loss and reward, making it suitable for learning proper risk management in derivatives trading.
________________________________________
🔍 Key Educational Takeaways:
• Helps manage premium exposure in trending markets
• Builds awareness of breakeven levels and invalidation points
• Encourages use of defined-risk structures over naked positions
• Promotes discipline and technical level-based exits
________________________________________
⚠️ Educational Disclaimer:
📢 This post is intended purely for educational and informational purposes only and does not constitute investment advice, recommendation, or solicitation to trade.
I am not a SEBI-registered investment advisor. All data shared above is illustrative and should not be considered as buy/sell advice.
Trading in derivatives involves risk. Please consult a SEBI-registered advisor before taking any financial decisions.
📘 Past performance or setup structure does not guarantee future results.
Always do your own research and use strict risk management.
________________________________________
💬 Want more educational breakdowns like this?
Drop a comment or message!
🔁 Share this with fellow learners to help them build structured option strategies.
✅ Follow @simpletradewithpatience for charts, clean setups, and educational content based on price action, zones, and risk-managed trades.
________________________________________
Search in ideas for "OPTIONS"
Options Watchlist — An Educational View of OI & Price Action________________________________________
📊 Options OI Trade Outlook — Bearish Setups Only
“This analysis is shared purely for educational purposes and market awareness — not a trading recommendation.”
(Educational Purpose | Not Financial Advice | SEBI Compliant)
Hello Traders 👋,
Here are 4 Bearish option setups based on today’s OI + Price Action + IV + Greeks study.
This is strictly for learning and educational purposes.
________________________________________
🔴 1. TCS 3200 PUT
LTP: 118.15
Sentiment: Bearish | Trend: Down | Strength: 5/5 (Strong)
IV: 17.7 | Delta: -0.63 | Theta: -0.93 | Vega: 3.5
Buildup: Long Build-up
Why?
3200 PE shows a Long Build-up with price up 40.4% and OI up 33.6%, confirming strong bearish positioning.
Volume surged +65%, showing active participation. IV eased (-5.4%), keeping premiums cheaper. Delta -0.63 signals high sensitivity to downside moves.
________________________________________
🔴 2. SBIN 820 PUT
LTP: 21.65
Sentiment: Bearish | Trend: Down | Strength: 5/5 (Strong)
IV: 14.8 | Delta: -0.56 | Theta: -0.31 | Vega: 0.95
Buildup: Long Build-up
Why?
820 PE reflects a Long Build-up with price rising 20.6% and OI also increasing — a textbook bearish confirmation.
Low IV (14.8) makes premiums attractive. Delta -0.56 shows quick reactivity to price moves.
________________________________________
🔴 3. INFY 1520 PUT
LTP: 42.80
Sentiment: Bearish | Trend: Down | Strength: 5/5 (Strong)
IV: 20.8 | Delta: -0.51 | Theta: -0.63 | Vega: 1.79
Buildup: Long Build-up
Why?
1520 PE shows heavy Long Build-up, with price up 36.5% and OI exploding 106%.
Volume spiked strongly, reflecting aggressive bearish positioning. IV is moderate (20.8), while Delta -0.51 indicates solid responsiveness to further downside.
________________________________________
🔴 4. LT 3600 PUT
LTP: 81.0
Sentiment: Bearish | Trend: Down | Strength: 2.5/5 (Moderate)
IV: 16.9 | Delta: -0.50 | Theta: -1.58 | Vega: 4.26
Buildup: Short Build-up
Why?
3600 PE shows a Short Build-up, with price falling 10.3% while OI rose 41%, pointing to fresh shorts.
Volume surged +29%, confirming activity. IV is steady at 16.9, and Delta -0.50 indicates balanced downside exposure.
________________________________________
⚠️ Disclaimer – Please Read Carefully
The information shared here is meant purely for learning and awareness.
It is not a buy or sell recommendation and should not be taken as investment advice.
📌 I am not a SEBI-registered investment advisor.
📌 All views expressed are based on personal study, chart patterns, and publicly available data.
📌 Trading — whether in stocks or options — carries risk. Markets can move unexpectedly, and losses can exceed capital.
📌 Past setups do not guarantee future outcomes.
👉 Beginners: use this to learn market behavior, practice with paper trades before risking money.
👉 Experienced traders: apply your own risk management, sizing, and strategy filters.
👉 Always consult a SEBI-registered financial advisor before real trades.
By engaging with this content, you acknowledge full responsibility for your own trading and investments.
________________________________________
💬 Found this useful?
🔼 Boost this post to help more traders learn.
✍️ Share your thoughts/setups in comments — let’s grow together.
🔁 Share with fellow traders & learners.
👉 “Follow for more clean, structured breakdowns with discipline at the core.”
🚀 Stay Calm. Stay Clean. Trade With Patience.
Trade Smart | Learn Zones | Be Self-Reliant 📊
________________________________________
Options Watchlist — An Educational View of OI & Price Action________________________________________
📊 Options OI Trade Outlook — Bullish Setups Only
“This analysis is shared purely for educational purposes and market awareness — not a trading recommendation.”
(Educational Purpose | Not Financial Advice | SEBI Compliant)
Hello Traders 👋,
Here are 5 Bullish option setups based on today’s OI + Price Action + IV + Greeks study.
This is strictly for learning and educational purposes.
________________________________________
🟢 1. MARUTI 14800 CALL
LTP: 383.95
Sentiment: Bullish | Trend: Up | Strength: 5/5 (Strong)
IV: 20.5 | Delta: 0.53 | Theta: -8.64 | Vega: 17.6
Buildup: Long Build-up
Why?
This strike shows a Long Build-up with price rising 10.1% and OI up 38.2%, a textbook bullish confirmation.
Though volume dipped (-25.7%), IV rose 8.4% supporting premium expansion. Delta 0.53 signals strong ITM probability.
________________________________________
🟢 2. MARUTI 14700 CALL
LTP: 436.15
Sentiment: Bullish | Trend: Up | Strength: 5/5 (Strong)
IV: 20.5 | Delta: 0.56 | Theta: -8.66 | Vega: 17.4
Buildup: Long Build-up
Why?
14700 CE shows a Long Build-up with price up 9.8% and OI up 15.7%, confirming bullish sentiment.
Volume is lower (-33.5%), but IV rising 9.2% supports premiums. Delta 0.56 shows strong ITM odds.
________________________________________
🟢 3. ADANIENT 2300 CALL
LTP: 70.15
Sentiment: Bullish | Trend: Up | Strength: 5/5 (Strong)
IV: 27.6 | Delta: 0.52 | Theta: -2.35 | Vega: 2.7
Buildup: Long Build-up
Why?
2300 CE has a Long Build-up with price up 4.4% and OI soaring 81%, backed by a 219% volume surge.
IV rising 5.5% confirms premium expansion. Strong participation makes this a convincing bullish setup.
________________________________________
🟢 4. TITAN 3650 CALL
LTP: 77.4
Sentiment: Bullish | Trend: Up | Strength: 5/5 (Strong)
IV: 16.6 | Delta: 0.53 | Theta: -2.13 | Vega: 4.3
Buildup: Long Build-up
Why?
3650 CE shows a Long Build-up, with price rising 22.2% and OI up 46.2%, supported by strong volume (+89%).
IV is moderate at 16.6, and Delta at 0.53 signals strong ITM chances.
________________________________________
🟢 5. POLYCAB 7200 CALL
LTP: 184
Sentiment: Bullish | Trend: Up | Strength: 5/5 (Strong)
IV: 24.3 | Delta: 0.51 | Theta: -6.32 | Vega: 8.5
Buildup: Long Build-up
Why?
7200 CE has a powerful Long Build-up, with price up 5.8% and OI surging 364%, supported by a massive 1552% volume jump.
IV at 24.3 is stable but rising, confirming strength.
________________________________________
⚠️ Disclaimer – Please Read Carefully
The information shared here is meant purely for learning and awareness.
It is not a buy or sell recommendation and should not be taken as investment advice.
📌 I am not a SEBI-registered investment advisor.
📌 All views expressed are based on personal study, chart patterns, and publicly available data.
📌 Trading — whether in stocks or options — carries risk. Markets can move unexpectedly, and losses can exceed capital.
📌 Past setups do not guarantee future outcomes.
👉 Beginners: use this to learn market behavior, practice with paper trades before risking money.
👉 Experienced traders: apply your own risk management, sizing, and strategy filters.
👉 Always consult a SEBI-registered financial advisor before real trades.
By engaging with this content, you acknowledge full responsibility for your own trading and investments.
________________________________________
💬 Found this useful?
🔼 Boost this post to help more traders learn.
✍️ Share your thoughts/setups in comments — let’s grow together.
🔁 Share with fellow traders & learners.
👉 “Follow for more clean, structured breakdowns with discipline at the core.”
🚀 Stay Calm. Stay Clean. Trade With Patience.
Trade Smart | Learn Zones | Be Self-Reliant 📊
________________________________________
JUBLFOOD | Weekly Bearish Options Setup | 27 Jan ExpiryTrade Structure (Text Format)
• Sell 515 PE
• Buy 525 PE
• Defined-risk Bear Put Spread
Why this setup works NSE:JUBLFOOD
JUBLFOOD is trading below key short-term averages with price struggling to hold above the 520 zone. Momentum remains weak, RSI is slipping below the mid-band, and every bounce is facing selling pressure.
Put-side OI is shifting lower, suggesting downside risk remains open. With decent IV, debit spreads offer controlled risk for a directional bearish view.
View
Moderately bearish — expecting JUBLFOOD to stay below 520 and drift lower or remain under pressure.
This post is for education only. It’s not financial advice or a recommendation to trade.
#WeeklyOptions #BearishSetup #BearPutSpread #OptionsTradingIndia #NSEOptions #PriceAction #OptionsStrategy #StockMarketIndia #RMInvestech

MARUTI OPTIONS TRADE SETUP📊 MARUTI OPTIONS TRADE SETUP – 12 Aug 2025
MARUTI is currently trading near ₹12,840, and the overall market mood looks bullish. We are seeing strong buying interest in call options from the 12,800 strike all the way up to 13,500, which means traders are expecting higher prices ahead. On the other hand, put option writers are active between 12,500 and 12,900, which suggests that they believe MARUTI will not fall below these levels anytime soon. The recent short covering at 12,700 CE (call option) along with fresh long positions above the spot price is adding fuel to the upside momentum. Volatility is in a low to moderate range (IV 13–17%), making it a good environment for debit strategies where you pay a premium for a defined-risk trade. For this setup, a combination of bullish directional positions (for momentum) and limited-risk spreads (to control risk) can work well, especially for traders who want to capture upside without taking unlimited exposure.
Bullish Directional Trade –13,000 CE
This trade idea is based on a clear sign of bullish momentum in the market. The 13,000 Call Option has shown a strong long build-up, with open interest (OI) increasing by 39% – meaning more traders are taking fresh long positions, expecting prices to move higher. We also see active call buying not just at 13,000 but also at the 12,900 and 13,200 strike prices, which suggests strong optimism in this price zone. The Delta value of 0.44 means the option moves moderately with the underlying index – giving good upside potential without taking extreme risk. Plus, with Implied Volatility (IV) at just 14.18%, the option is relatively cheap considering the strong upward momentum. In simple terms – the data supports a bullish view, the cost is reasonable, and the trade offers a balanced mix of profit potential and risk control.
Bullish Spread Trade
This Bull Call Spread is a smart bullish strategy that helps you participate in an upward move while keeping your cost and risk under control. In this trade, we buy the 13,000 CE at ₹98.50 and sell the 13,200 CE at ₹50.95. By selling the higher strike call, we reduce our upfront cost, bringing the net investment (net debit) down to just ₹47.55 per share, or ₹2,377.50 total for 50 lots. The maximum profit is capped at ₹7,122.50, which happens if the market closes at or above ₹13,200 on expiry. The maximum loss is limited to ₹2,377.50 — the amount we paid for the spread — making it much safer than buying a naked call. Our break-even level is ₹13,047.55, meaning we start making profits if the price goes above this level. The reason for choosing this structure is that the 13,200 CE also shows strong buying interest (long build-up), which increases the probability of the stock moving into our profitable zone. In short, it’s a low-cost, limited-risk, and favorable risk-reward setup for traders expecting a steady move upwards, without taking the full risk of outright call buying.
Aggressive Bullish Momentum
This trade is designed for situations where we expect strong upward momentum in MARUTI. We are using a Bull Call Spread, which means we buy a lower strike call option (₹12,900 CE @ ₹137) and simultaneously sell a higher strike call option (₹13,300 CE @ ₹37.60). This combination reduces the overall cost compared to buying a call outright, making the trade more affordable while still giving us good profit potential. Here, the total cost (net debit) comes to ₹99.40 per share, or ₹4,970 for 50 shares. If MARUTI moves up strongly toward the ₹13,300 level, our spread reaches its maximum profit potential of ₹15,030. The maximum we can lose is the initial ₹4,970 we invested, which is our fixed risk. The beauty of this setup is that we have a risk-to-reward ratio of about 1:3, meaning we’re risking ₹1 to potentially make ₹3. This is a strategic way to benefit from a strong bullish view while keeping risk capped — perfect for traders who want to balance aggressiveness with controlled exposure.
💡 Open Interest Insights:
From the current data, we can see that almost every At-The-Money (ATM) and Out-of-The-Money (OTM) Call Option up to the 13,500 strike is showing a Long Build-Up. This means traders are actively buying calls, which generally signals that they expect the market to move higher. At the 12,700 CE, we notice Short Covering — here, traders who had earlier sold calls are now buying them back, which usually happens when they believe the level will hold and the market may move up from there. This suggests that 12,700, which may have been a resistance earlier, could now act as a strong support. On the Put Option side, strikes between 12,500 and 12,900 are showing Short Build-Up, meaning traders are selling puts — a sign they expect these levels to hold and the market not to fall below them. Additionally, the fact that Implied Volatility (IV) is low while we are seeing a Long Build-Up means the market is showing steady bullish confidence without panic buying, which can support a sustained upward trend.
⚠️ Disclaimer – Please Read Carefully
The information shared here is meant purely for learning and awareness. It is not a buy or sell recommendation and should not be taken as investment advice. I am not a SEBI-registered investment advisor, and all views expressed are based on personal study, chart patterns, and publicly available market data.
Trading — whether in stocks or options — carries risk. Markets can move unexpectedly, and losses can sometimes be larger than the money you have invested. Past performance or past setups do not guarantee future results.
If you are a beginner, treat this as a guide to understand how the market works — practice on paper trades before risking real money. If you are an experienced trader, remember to assess your own risk, position sizing, and strategy suitability before entering any trade.
Data, prices, and analysis are based on information available as of 12 August 2025, and market conditions can change at any time. Always verify with reliable sources and consult a SEBI-registered financial advisor before making any real trading decision.
By reading, watching, or engaging with this content, you acknowledge that you take full responsibility for your own trades and investments.
💬 Found this useful?
Drop your thoughts, questions, or setups in the comments — let’s grow together!
🔁 Share this post with fellow traders and beginners to spread clean, structure-based learning.
✅ Follow simpletradewithpatience for beginner-friendly setups, price action insights, and disciplined trading content.
🚀 Stay Calm. Stay Clean. Trade With Patience.
Trade Smart | Learn Zones | Be Self-Reliant 📊

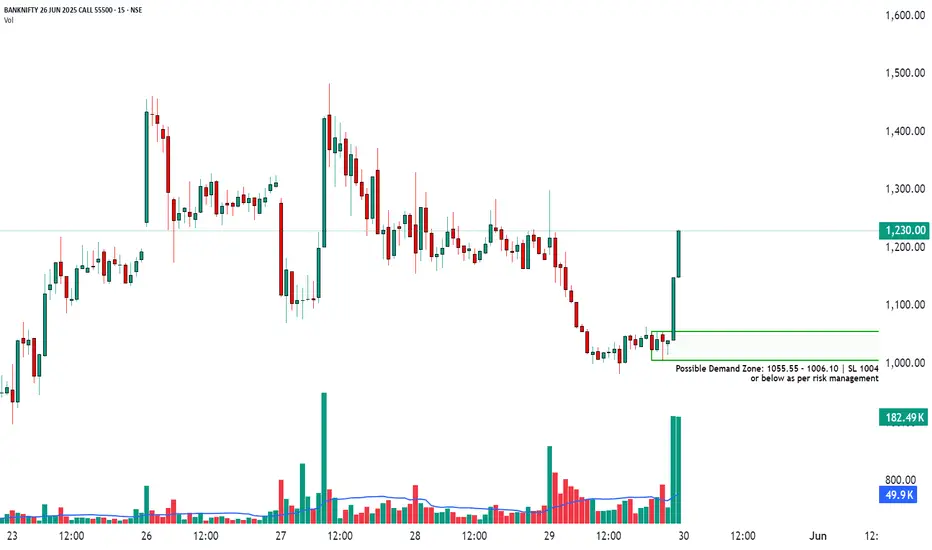
How to Trade Bank Nifty Options Using Demand Zones📈 BANKNIFTY 55500ce
📆 Date: May 29, 2025
🔍 Timeframe: 15 minute
How to Trade Bank Nifty Options Using Demand Zones
Understanding and effectively applying demand zones can significantly improve your success in trading Bank Nifty options. This approach provides a structured method to identify high-probability trades and implement disciplined risk management.
________________________________________
Why Use Demand Zones in Options Trading?
• Enables entry closer to strong support, improving reward-to-risk ratios
• Acts as a key confluence area for price action and volume
• Encourages disciplined entries based on market structure
• Helps set clear, logical stop-loss levels
________________________________________
Strategy: Two Ways to Trade Demand Zones
1. Conservative Approach – Wait for Price to Enter the Zone
Steps:
• Allow price to dip into the defined demand zone (between 1055.55 – 1006.10)
• Wait for reversal confirmation, such as:
• Bullish engulfing or a strong green candle
• Increased volume or optional bullish divergence
• Enter a Call Option (CE) position once confirmation is visible
• Place stop-loss just below the zone (e.g., ₹1004)
• Target 1: Immediate resistance or recent swing high
• Target 2: Option premium expansion based on implied volatility and price momentum
Why this works: Buying at a value zone aligns you with potential institutional demand and provides a favorable entry with limited downside.
________________________________________
2. Aggressive Approach – Trade From the Top of the Zone
Steps:
• Enter when the price first touches the top of the demand zone (around 1055.55)
• Use a tight stop-loss just below the zone (e.g., 1004)
• Consider smaller position sizing to adjust for higher entry risk
• Monitor for immediate bounce—exit quickly if no reaction follows
Why this works: Offers better reward if the demand zone holds and price reacts quickly. This is suitable for experienced traders who can act decisively.
________________________________________
Risk Management – Non-Negotiable
• Always follow stop-loss discipline based on the demand zone
• Keep position sizing conservative, risking only 1%–2% of your total capital
• Avoid overtrading; focus on high-quality, high-probability setups
• Select ATM or slightly OTM options (e.g., 55500 CE or 55600 CE) for better delta and responsiveness
________________________________________
Volume Confirmation – An Extra Edge
• Volume spikes near the demand zone strengthen the validity of the level
• If volume is absent, avoid the trade or reduce your size
• Institutional buying often reveals itself through volume near key support levels
________________________________________
Trade Entry Checklist
• Is price currently in or very near the marked demand zone?
• Is volume showing increased activity?
• Is the overall market trend favorable for calls?
• Are external/global market cues supportive (especially for intraday trades)?
• Is the risk-to-reward ratio at least 1:2?
________________________________________
Educational Recap
• Demand zones act as critical areas where strong buying interest may emerge
• Wait for price to enter the zone; avoid chasing entries
• Focus on structured risk control over trying to predict every move
• Use candlestick structure, volume analysis, and context to improve your setup quality
________________________________________
Final Thoughts
Trading Bank Nifty options with demand zones instills structure, clarity, and discipline. This approach is ideal for intraday or short-term swing traders who rely on technical precision.
The objective is not to trade frequently, but to trade at the right levels with defined risk and potential reward. Let the market come to your setup and respond with a plan—never react emotionally.
This framework reduces noise, avoids emotional trades, and helps you align with institutional buying zones with a strong edge.
⚠️ Risk Management Tip: Always trade with a clearly defined stop loss. Avoid entering positions impulsively. It is advisable to start with a smaller quantity and increase your exposure only if the price action confirms the continuation of the trend. Capital protection should always be the priority.
📢 Disclaimer
This content is created purely for educational and informational purposes. It is not intended as investment advice, stock recommendations, or trading tips. Trading and investing in the stock market involves risk. Please consult with a SEBI-registered financial advisor before making any investment decisions. The author/creator is not registered with SEBI and shall not be held responsible for any losses incurred based on this information. Always do your own research and use proper risk management.
👉 If you found this analysis helpful, don’t forget to Follow, so you never miss out on a trade-worthy setup, breakout opportunity, or valuable educational insight again. Stay updated and trade smarter! 💡📈
Nifty Intraday Options Trades for 2/8/2021Intraday Options:
A. Buy 5th Aug Nifty 15900CE Strictly above 53 SL 40 Target 90 and 100.
B. Buy 5th Aug Nifty 16000PE Strictly above 287 SL 245 Target 390 and 400
Exit before market Close Today. Do not take position for Tomorrow unless advised so.
Out of the above 2 options calls, Trade only in 1 option which ever comes first and cancel second order immediately.
All Disclaimers Apply.

ASHOKLEY | 30 Dec Expiry | Options Trade BullishA 161/159 bull put spread aligns with the current trend structure.
Price continues to push into higher highs with strong momentum, supported by firm ROC and an RSI holding in bullish territory. IVs remain steady with a mild downside skew, which makes short-premium structures efficient here.
The payoff curve benefits from the sustained breakout, and the 1 SD range sits comfortably above the short strike — a supportive backdrop for a defined-risk bullish setup.
NSE:ASHOKLEY
This is not trade advice — sharing analysis for education.
#Nifty #IndiaFNO #OptionsTrading #NSEStoc ks #PriceAction #OptionSeller #MarketsIndia

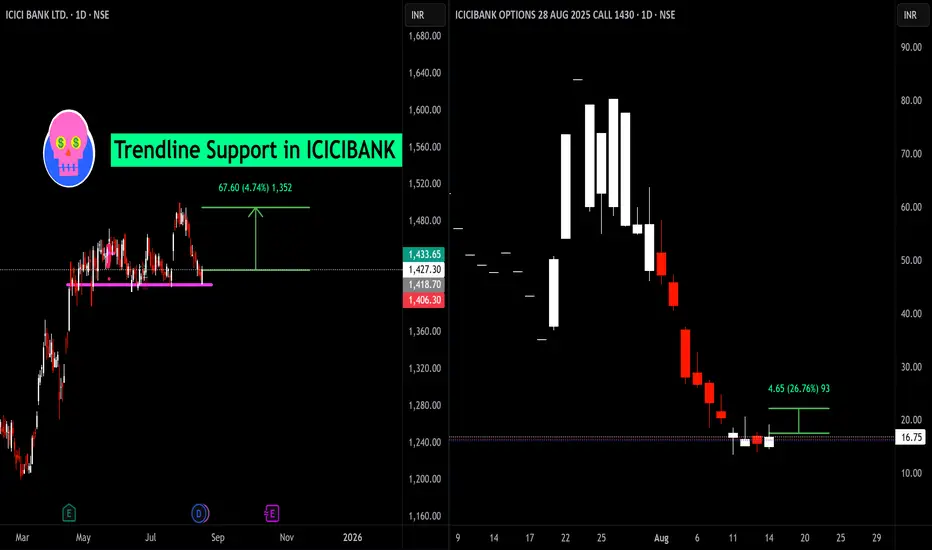
Trendline Support and Options Reaction in ICICI Bank📈 ICICI Bank at Major Support!
ICICI Bank is testing a crucial trendline support zone around ₹1,418–₹1,427 after a lengthy pullback. Historically, this level has held strong, showing multiple bounces — making it a key area for traders to watch.
Support Level: ₹1,418–₹1,427
Potential Upside: The chart highlights a recovery zone towards ₹1,433 and beyond, with a bounce of ₹67.6 (approx. 4.74%) possible if support holds firm.
🟢 Options Perspective: 1430 CE (August Expiry)
The ICICI Bank 1,430 August call option has shown significant volatility:
Current Premium: ₹16.75
Recent Change: +₹4.65 (+26.76%) on a single session!
ICICIPRULI | Weekly Bullish Options Setup | 27 Jan ExpiryTrade Structure (Text Format)
• Sell 690 PE
• Buy 680 PE
• Defined-risk Bull Put Spread
Why this setup works
NSE:ICICIPRULI
ICICIPRULI is holding above the 680 support zone with buyers stepping in on minor dips. Price is trading above the short-term averages, RSI remains in the bullish half, and put OI is building below 680, indicating strong downside protection.
With stable IV, put spreads offer efficient premium decay while keeping risk clearly defined.
View
Moderately bullish — expecting ICICIPRULI to stay above 680 and grind higher or move sideways.
This post is for education only. It’s not financial advice or a recommendation to trade.
#WeeklyOptions #BullishSetup #BullPutSpread #OptionsTradingIndia #NSEOptions #PremiumDecay #PriceActionTrading #StockMarketIndia #RMInvestech

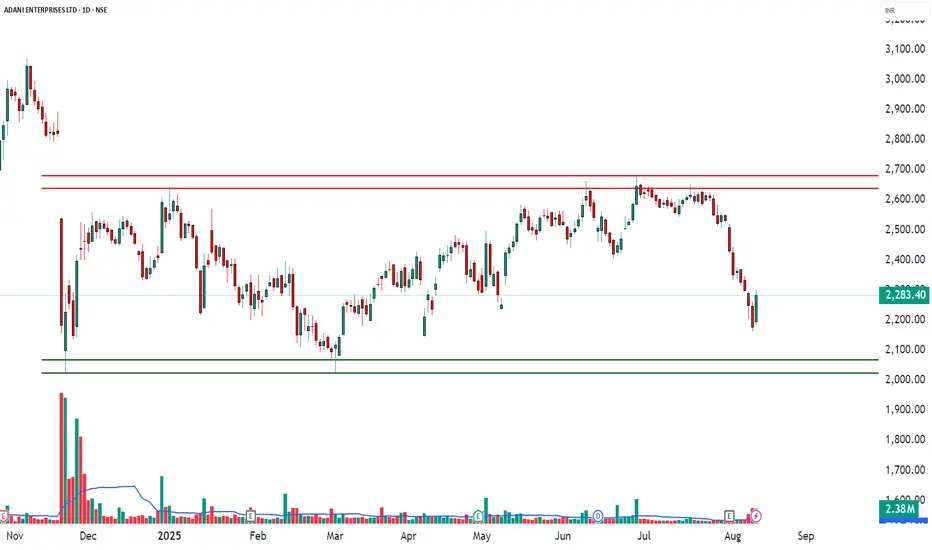
ADANIENT – Options Trade Snapshot📄 ADANIENT – Options Trade Snapshot (Educational Analysis)
Date: 12 Aug 2025
Spot Price: ₹2,283.40
Market View: Bullish bias based on option data & price structure
Overall Sentiment: Positive – multiple Call short coverings and fresh Put short build-ups
Volatility (IV): 34.5% – 51.4% (moderate–high, suggesting option premiums are relatively elevated)
Analysis Purpose: For market study & understanding of option chain signals
1️⃣ Observed Bullish Setup – 2300 Call Option
LTP: ₹64.05
Breakeven (for understanding): ₹2,364.05
Notable Data Points:
Volume spike: 22,099 contracts (166% higher than usual)
IV decreased while price increased → generally indicates aggressive buying
Delta ~0.5 → option price moves about ₹0.50 for every ₹1 in underlying
2️⃣ Observed Neutral-to-Bullish Setup – 2250 Put Option
LTP: ₹51.55
Breakeven (for understanding): ₹2,198.45
Notable Data Points:
Large open interest addition (+105,600 contracts / +47.5%)
Many traders appear to be expecting price to remain above 2250
Theta ~ -2.84/day → higher time decay benefits sellers in such positions
3️⃣ Observed Bullish Spread Structure – 2300 CE + 2400 CE
Leg 1: 2300 CE @ ₹64.05
Leg 2: 2400 CE @ ₹28.40 (short)
Net Cost (for study): ₹35.65
Maximum Risk: ₹6,238.75 (per lot)
Maximum Reward: ₹11,261.25 (per lot)
Breakeven Level: ₹2,335.65
Why:
Limits risk vs naked CE buy while keeping upside potential until 2400.
OI data supports bullish trend above 2300, resistance near 2400.
Lower IV on CE side helps spread entry.
Suitable for moderate upside with controlled risk.
📘 My Trading Setup Rules
Avoid Gap Plays
→ Check pre-open price action to avoid trades influenced by gap-ups/gap-downs.
Breakout Entry Only
→ Enter trades only if price breaks previous day’s High (for bullish trades) or Low (for bearish trades).
Watch Volume for Confirmation
→ Monitor volume closely. No volume = No trade.
Enter on Strong Candle + Volume
→ Execute the trade only if a strong candle appears with increasing volume in the direction of the trade.
Defined Risk:Reward Only
→ Take trades only if R:R is favorable (ideally ≥ 1:2).
Premium Disclaimer
→ Option premiums shown are based on EOD prices — real-time premiums may vary during execution.
Time Frame Preference
→ Trade with your preferred time frame — this strategy works across intraday or positional setups.
Disclaimer:
This analysis is for educational and informational purposes only and is not investment advice. The data presented is based on publicly available market information and represents a study of price action and option chain behaviour. Trading in securities/derivatives involves substantial risk, and past performance is not indicative of future results. Please consult your SEBI-registered investment advisor before making any investment or trading decisions.
In the Money options and STT - Educational series 7Hi All ,
======================
Context is India Market
======================
Lets see today the STT (Securities transaction tax) trap for in the money options which are not squared off before expiry. (If you don't square off its called option exercised)
First of all let's understand what is In the Money (ITM) option call /put ?
Let's say Nifty spot price 9150
Now if you buy 9100 Nifty calls , You are buying ITM call option i.e the spot price of underlying is greater than the strike price of contract.
Similary if you buy 9200 Nifty puts , You are buying ITM put option i.e the spot price of underlying is below the strike price of contract.
Now to the STT trap:
---------------------------
Normal STT charges :
STT is calcualted as 0.05% of sell side premium value , i.e while buying option you don't pay STT but while selling option you pay STT.
Example
Let say you Have 9100 Nifty call options (1lot=75) bought at 10 rs and you sell at 20 rs
while buying no STT , while selling 20x75x0.05/100 = 0.75 RS is STT charge per lot .
Now instead of squaring off before expiry you let it expiry and say nifty closes at 9120 , you naturally expect that you will get 20 RS on 9100 option.
Now the catch is this is option exercised
so STT is calculated as 0.125% of the entire contract price , I repeat " entire contract price "
Full Contract price in our case is (9120 X75 ) so on this STT will be calculated
i.e 9120x75X0.125/100= 855 RS is charge
So 0.75 Rs and 855 Rs per lot considering the ITM option value which are squared off and
exercised respectively, more the value of ITM contract more will be charges in second case.
Please note there is no STT for Buying options , So if you have shorted options you have already paid STT so even if they get exercised no problem.
Currency Market does not have STT in india currently(Please correct if i'm woring on this).
Suggestions /Correction welcome
================
Watch this space:
================
One more eye opener on Dividend and contract price of futures /options will be posting soon.

INDUSINDBK | Weekly Bullish Options Setup | 27 Jan ExpiryTrade Structure (Text Format)
• Sell 960 PE
• Buy 940 PE
• Defined-risk Bull Put Spread
NSE:INDUSINDBK
Why this setup works
INDUSINDBK is holding above the short-term support zone around 950 after a strong bounce. Price is trading above key moving averages, momentum is improving, and RSI is comfortably above the mid-zone.
Put-side OI is building near 950–960, suggesting strong downside support. With IV elevated, selling puts via a spread offers attractive risk-reward with defined downside.
View
Moderately bullish — expecting INDUSINDBK to stay above 950 and trend sideways to higher over the week.
This post is for education only. It’s not financial advice or a recommendation to trade.
#WeeklyOptions #BullishSetup #BullPutSpread #INDUSINDBK #BankNiftyStocks #NSEOptions #OptionsTradingIndia #PriceAction

CIPLA | Weekly Bearish Options Setup | 27 Jan ExpiryTrade Structure (Text Format)
• Sell 1400 CE
• Buy 1420 CE
• Defined-risk Bear Call Spread
NSE:CIPLA
Why this setup works
CIPLA is trading below the short-term trend with price failing to sustain above the 1400 zone. The recent bounce has been sold into, RSI remains weak below the mid-line, and momentum continues to fade.
Call-side OI is building around the 1400 strike, indicating strong overhead supply. With IV holding steady, call spreads offer a favourable risk-defined way to express a bearish-to-neutral view.
View
Moderately bearish — expecting CIPLA to stay below 1400 and drift sideways to lower over the week.
This post is for education only. It’s not financial advice or a recommendation to trade.
#WeeklyOptions #BearishSetup #BearCallSpread #CIPLA #NSEOptions #OptionsTradingIndia #PriceAction #StockMarketIndia #RMInvestech

INFY | Weekly Bullish Options Setup | 30 Dec ExpiryTrade Structure:
• Sell 1640 PE
• Buy 1600 PE
• Defined-risk bull put spread
Why this setup works for NSE:INFY
INFY is showing a clear recovery from the lower band with improving momentum. RSI has turned up from the mid-zone and ROC is trending higher, suggesting strength is building rather than fading.
Price holding above the 1620–1640 support zone keeps downside limited, while steady IV makes short-premium structures efficient for the week.
View
Moderately bullish — expecting INFY to hold above support and grind higher.
This video is for education only. It’s not financial advice or a recommendation to trade.
#INFY #NiftyIT #WeeklyOptions #OptionsTrading #IndiaFNO #BullPutSpread #OptionSeller #PriceAction #NSEStocks #MarketAnalysis

Futures & Options data analysis & view for 22 AprilIn our previous post we had mentioned that if Nifty has to go down, it has to break below 20 day EMA in the next 2 days.
That is what we have precisely seen. Opening scene of Day 2 – Nifty opens & stays below 20 day EMA throughout the day. We have accordingly suggested a trade in that post during market hours.
Let’s analyse the data for the day…
FIIs net sold 17.7K Contracts in Index Futures worth Rs 1070.57 Cr
Futures data analysis
- FIIs added 196 Contracts in Long position and 17.9K Contracts were shorted by them
- Retail participants added 9K Long contracts & squared off 1589 short contracts
- Pro traders added 3.5K Long contracts & squared off 2.9K short contracts
Options data analysis
Call option
- FIIs bought 5.8K Call options & 7.1K Calls were shorted by them
- Retail participants bought 1.07 Lakh Call options & 66.2 K Calls were shorted by them
- Pro traders bought 4.2K Lakh Call options & 44.3 K Calls were shorted by them
Put option
- FIIs bought 3.4K Put options & 4.8K Puts were shorted by them
- Retail participants booked profits / exited in 35.6K Puts Long contracts & exited from 26K Put Short contracts
- Pro traders added 7.47 K Put Long contracts & squared off 3K Put shorts
All in all, retail participants have gone aggressive on the Long side. They are net buyers in Futures and are net Call Long. (They were net Call buyers on 20th April too, suggesting a lot of people might have tried to average their position). FIIs are net short in Futures & keeping it light in options & Pro traders are net buyers in Futures but have balanced their position by adding Call Shorts & net buying some Put options.
Important levels on the lower side 8925 / 8868 / 8822 / 8750
Important levels on the upper side 9030 / 9061 / 9118 / 9196
Level of 8860-8874 is very important.
----------------------------------------------------------------------------------------------------------------------------------------------
A note to all my retail friends who are reading and following me
- please do not try to average positions in options
- Do not enter the trade first and then Hope for things to happen.
It's your money. You have to make things happen and YOU CAN... Just Invest some time in learning.
All the best & Take care...!!!

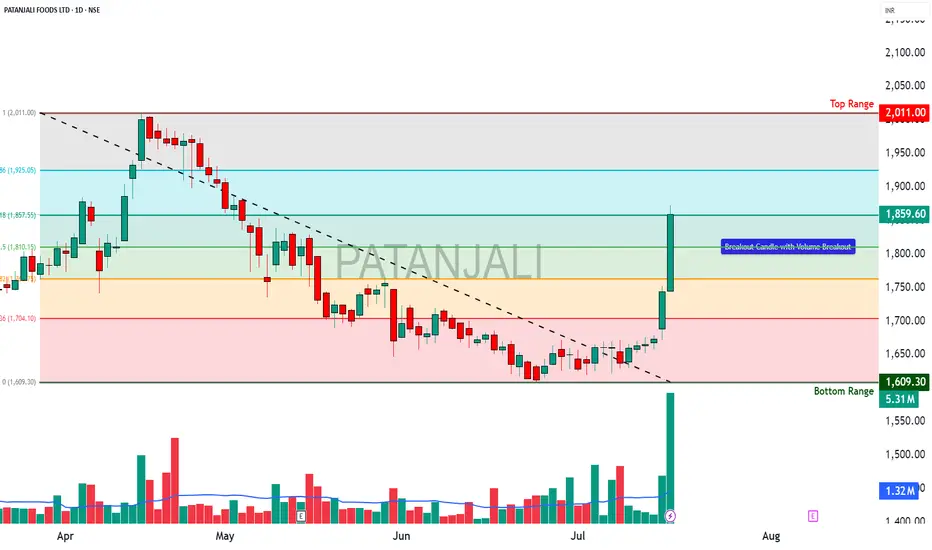
PATANJALI - OPTIONS TRADE SETUPPATANJALI OPTIONS TRADE SETUP – 17 JULY
Spot: ₹1859.6
Trend: Bullish
Volatility: Moderate IV rise (38–41%)
Lot Size: 300
________________________________________
1. Bullish Trade (Naked options as per trend)
Best CE: Buy 1860 CE @ ₹59.45
Why: Strong continuation signal with rising OI and price, heavy volume, and ideal gamma/vega mix for price moves.
________________________________________
2. Contrarian Trade (Naked options against trend)
Best PE: Buy 1800 PE @ ₹31.3
Why: Defensive Put play with unusually high activity and rising IV → could work as hedge if breakdown begins below ₹1840.
________________________________________
3. Strategy Trade (As per trend + OI data)
Strategy: Bull Call Spread → Buy 1860 CE / Sell 1920 CE
Net Debit: ₹59.45 - ₹35.5 = ₹23.95
Max Profit: ₹60 - ₹23.95 = ₹36.05
Max Loss: ₹23.95
Risk:Reward ≈ 1:1.5
Lot Size: 300
Total Risk: ₹7,185
Max Profit: ₹10,815
Why:
• Massive Long Buildup in CE chain (1820 to 1960), with 1860 CE leading in volume and OI surge
• 1860–1920 spread captures ideal move zone before resistance at 1960
• IVs rising moderately → favors debit spread entry
• PE chain showing Short Buildup, especially at 1800/1840/1880 → downside bets getting squeezed
• Balanced risk with great R:R (1:1.5) near breakout zone — clean bullish continuation setup
________________________________________
📘 My Trading Setup Rules
Avoid Gap Plays
→ Check pre-open price action to avoid trades influenced by gap-ups/gap-downs.
Breakout Entry Only
→ Enter trades only if price breaks previous day’s High (for bullish trades) or Low (for bearish trades).
Watch Volume for Confirmation
→ Monitor volume closely. No volume = No trade.
Enter on Strong Candle + Volume
→ Execute the trade only if a strong candle appears with increasing volume in the direction of the trade.
Defined Risk:Reward Only
→ Take trades only if R:R is favorable (ideally ≥ 1:2).
Premium Disclaimer
→ Option premiums shown are based on EOD prices — real-time premiums may vary during execution.
Time Frame Preference
→ Trade with your preferred time frame — this strategy works across intraday or positional setups.
________________________________________
⚠ Disclaimer (Please Read):
• These Trades are shared for educational purposes only and is not investment advice.
• I am not a SEBI-registered advisor.
• The information provided here is based on personal market observation.
• No buy/sell recommendations are being made.
• Please do your own research or consult a registered financial advisor before making any trading decisions.
• Trading involves risk. Always use proper risk management.
I am not responsible for trading decisions based on this post.
________________________________________
NIFTY Sell on Rise | Options Trade with Defined RiskNIFTY continues to respect the upper trendline resistance, indicating a bearish bias in the near term. Price action suggests a sell-on-rise opportunity as long as the index trades below this resistance zone.
📉 Index View (Spot):
Resistance Zone: 25,750
Downside Targets: 25,650 – 25,600
Rejection from this zone could trigger another leg lower toward the mentioned targets.
📌 Trade Setup (Options Strategy)
Instrument: NIFTY 25,800 CE (20th Jan Expiry)
Buy Zone: ₹125 – ₹115
Target: ₹190
Invalidation / Risk: ₹95 (closing basis)
💡 Trade Logic:
As long as ₹125 holds, momentum remains favorable for an upside move in the option premium. A pullback into the buy zone may offer a low-risk, high-reward setup, aligned with volatility expansion near resistance.
⚠️ Risk Management is Key
Use strict stop-loss discipline
Adjust position size according to your risk appetite
Avoid overtrading in volatile conditions
📌 Disclaimer
This analysis is strictly for educational purposes and not financial advice. Please consult your financial advisor and follow your own trading plan before taking any trades.
If you find this idea useful, hit the like button and share your views—your feedback helps us create better trading insights for the community.
🚀 Trade smart. Trade disciplined.
Happy Trading,
– The InvestPro Team

Why Is It Necessary to Bank Gains in Options on a regular basis?In this post, I thought of sharing with you why it is necessary to exit Long Options in certain situations and bank gains. This is based on the trades that i had actually taken and is not a backtest story that I am sharing.
HDFC BANK 1580 CE
A few days ago , I bought HDFC BANK 1580 CE when the spot was at 1567. The intent was to ride it as long as I can and preferably till it reaches 1600 psycho resistance.
The exit basis was based on the premise that I had picked up the trade using a good basis and the price at that time was in the zone.
However, man wishes and the market disposes of the plan out the window!
I soon realized that the underlying was not having enough strength and it was highly unlikely to cross even 1580, leave aside reaching closer to 1600. HDFC BANK has the tendency to quickly slip a few points and in such a case, my Option would come near cost and I would end up letting the gains evaporate.
In view of this, I exited the long in good gains in terms of ROI % which is how I measure my trades as I do not trade with a big size as I have learned those lessons the hard way in the past. I was content with the trade and was expecting that the scrip may retest the area from where it had bounced.
And something similar happened and without blinking, I went long on the same Option and interestingly, this time I could get it at a better price by 10 paise. On an HDFC BANK Option, even this small difference could well take care of all the charges so I was happy. And I waited for the price to test the earlier level from where it got rejected and as the scrip approached the level, I simply exited without thinking about a What if it goes beyond the resistance line?
My exit was justified and then the scrip rolled down.
I was happy that just by observing the price action and not really referring to any indicators, I was able to make 2 good trades. Or should I say - the market was kind enough to grant me these 2 good trades?
[n Conclusion:
The above highlights the fact that while trading in Options, observing the price of the underlying when in momentum is essential and as soon as the trade is on, the exit plan should be in place. This can be done either by placing an SL order or a target order. I keep these levels in mind and exit as and when either of these are approached.
When in a bull market, when a price retraces back to a support area, a good trading opportunity appears as in the case explained above.
Taking a re-entry at the same or around the same price level is easier when there is already a profit cushion from the earlier trades so the not only the mental state is stable and positive, but the confidence while pressing key is also at the required level.
Please let me know if this helps and if you would like me to share some of my trades with you and I will do so whenever possible. As you can see from the chart, the trades mentioned above were taken a few days ago before HDFC BANK tested lower levels.
Happy Money Making!
Umesh
18-9-21
Note - I am not a SEBI Regd analyst and the views expressed here are purely for educational and informational purposes only. Please perform Due Diligence at your end before taking any trades as only you know how to manage your money.

$Bitcoin : Options Short StrangleVer.2 - 85%APY at 10 daysAfter the price spike last week volatility fluctuations has stabilized at around 70%. The idea is all about using a period relatively a stabilized price range and receiving income through the sale of options in a short-time period.
Flash Idea:
For income receiving, we sell two types of options within the framework of the trading channel with an expected price till September 24. By selling CALL option at the price of 49 000 we receive a premium of 15 USD for the contract of 0.01BTC. In addition, we sell PUT option at the price of 45 000 with an approximate premium of 12 USD.
Thus, we form an expected channel of price movement in the range between 45 000 - 49 000 for the upcoming ten days.
The expected profitability will be around 85% annual on the capital used, including a brokerage fee.
Risks:
If at the moment of expiration the price will exit the trading channel, losses will correspond to the difference between the current price and the nearest channel border.

Nifty: Things to consider in Futures & Options tradingDear Trader,
“We all want progress, but if you're on the wrong road, progress means doing an about-turn and walking back to the right road; in that case, the man who turns back soonest is the most progressive.” – C.S. Lewis
Many a times I see retail participants buying Call and Put options based on hope. Even on 10th December 2020, Data analysis suggested retail participants were buying 13400 Puts and 13500 Calls in hope of big movement which never materialized.
Our F&O data analysis shared on 08th Dec 2020, when Nifty was at 13413 odd levels gave us an indication of a rangebound movement for Nifty index and accordingly a short strangle strategy was suggested to sell 13500 Call option and sell 13200 Put option for 10 Dec 2020 expiry.
Nifty closed at 13478 which means the strategy gave us the desired results.
One of the fundamental factors that can make a difference in your trading success depends on
Are you willing to put in efforts to do your study / home work ?
Let me put it in simple way for you to understand..
- In exams, who do you think has a higher probability to score better marks – one who has prepared well for exams or one who is giving exams based on luck
- Who has a better chance of cracking an interview for a job – one who has prepared well for it or one who goes unprepared
- at interview the interviewer asks questions and is willing to let go 10 candidates in search of that 1 Mr Right Fit candidate. Why if you are an interviewer you are willing to reject... Because the person getting selected will get salary but for Company that is an investment and we want to be sure that would be a good Return on Investment, Isn't it?
- and Why as an interviewee we prepare for the interview... Because we want to start earning, right?
If we can do this for the Company where we work or want to work, then why in trading (where we are dealing with our own hard earned money, we want ROI and want to start earning) we neglect the importance of these 2 factors...
- ignore the importance of preparation. &
- Can you let go 10 trading opportunities for that 1 opportunity that has a higher probability of success with better risk::reward ratio.
Can you not be more selective in your trading decisions...?
My Mission is to
- empower retail traders with the right information before they enter a trade in Nifty Futures / Options,
- rationalize your expectations
- help you avoid make mistakes and
- realize your true potential to be profitable by being selective and trading with knowledge…
For details you can get in touch...!!!
Follow and hit the Like button if you agree on the points above and want to improve...
Let me know your views / thoughts in the comment section below.
Take care & safe trading...!!!

RELIANCE FUTURES AND OPTIONS MOMENTUM TRADE IN MAY CONTRACT RELIANCE FUTURES AND OPTIONS MOMENTUM TRADE IN MAY CONTRACT
BUY@1490
STOP@1475
TARGET 1@1520
TARGET 2@1535
QTY=1500
!!CARRY FWD!!
!!please note trade with caution!!
!!manage your risk!!
!!trade-wise!!
!!please adjust for future rates!!
!!intra-day ideas series everday at between 9:30 to 10:30!!
OPTIONS TRADE IN RELIANCE
1540 CALL OPTION
BUY@49.5
STOP@39.5
TARGET@75
QTY=2500
!!CARRY FWD!!

30 Dec 2021 How to apply Ninja Scalping to OptionsHow to apply Ninja Scalping (Pull back method) to Options
Bank Nifty intraday ninja scalping technique #Banknifty, #Charts, #market, #trading
Disclaimer : Views, Videos and Presentations or any information shared in this channel are only for EDUCATIONAL PURPOSES and are not intended as any investment advice. Accuracy cannot be guaranteed on any information/data/facts provided. While taking any trade please do your own research and trade with your own risk management and responsibility. Please invest your money under the guidance of SEBI Registered Financial Analysts only. We are not not responsible for any decisions taken by you and subsequently leading to any profit or loss incurred by you.
