Bitcoin Dominance Bias Update + Altcoins Rally - Bitcoin Dominance is currently trading at 57.58%
- Altcoins will only trigger a rally when we see BTC Dom triggering a sell-off and bearish trend
- Bitcoin Dom has shown a very minimal slowdown and retracement that's leading to altcoins jumping
- I will be more interested to see BTC Dom breaking down and changing its Market Structure and that's where you will see Altcoins jumping more harder.
- Wait for a structure shift beneath 54% and claim back to 55 and then again a drop that's where we will see huge expansionary moves in Alts
- Q4 has been very bullish in the past expecting the same this year as well.
Search in ideas for "bitcoin"

BITCOIN: Bearish - Double TOP + Rising WedgeBITCOIN: Bearish – Double TOP + Rising Wedge
The market could go back down to around $58 000.
In addition, detection of a possible double top on Bitcoin which would bring the price down to around $48 000
Watch for the 50 and 200 exponential moving averages, as well as the Ichimoku levels, and RSI.
be careful

bitcoin is breaking outbitcoin is showing breakout of ascending triangle, recent resistance is surpassed now, ready for a good upswing till 66000.
Only for education purpose

Bitcoin Dominance & Altcoins Crash/Pump Analysis Correlation- Bitcoin Dom has broken out of its long weekly consolidation supply
- Bitcoin Dominance is now making all the Altcoins bleed
- Bitcoin Dom signifies that the money is flowing more into Bitcoin and getting pulled out from other cryptos to Bitcoin
- The current situation only looks Bearish for Altcoins and Bullish for Bitcoin
- However to see an ultimate rally in Altcoins we will have to see a strong rejection in BTC DOm and USDT Dominance
- Prepare yourselves and your Fiat accordingly

BITCOIN: Double top possible + NAVARRO 200 : Watch out!!
BITCOIN: Double top possible: Watch out for 48,000 + NAVARRO 2000 bullish = 2 opposing patterns.
The Wolf of Zurich detected a possible double top on bitcoin
As expected, the 56,400 was reached perfectly thanks to my analysis.
The next levels are:
On the decline :
56,425 (again)
48,000
40,770
On the rise:
NAVAROO 200 bullish detected, and the price could reach $72,000 then $80,000
In addition, Be careful because there is a bullish divergence with the ROC!!
To watch the EMA 50 and 200, and the ICHIMOKU and Fibonacci levels

Bitcoin Dominance Altcoins Update - Bitcoin Dominance is currently looking bullish on a daily timeframe
- Bitcoin Dominance bearish is a green signal for Altcoins holders
- Once you see Bitcoin Dominance getting rejected from the 56-57% level altcoins will recover the partial dump they all made recently
- Altcoins bags exposure will be right once you see dominance trading at supply
- Buying altcoins when Bitcoin dominance is trading at demand is always a bad choice

Bitcoin Dominance Analysis- Bitcoin Dominance is currently at a stage where it can either
1) Take a small pullback and let Altcoins breathe
2) Move up more from here and we might only see a reaction around 55
- Bitcoin Dominance is very underrated when it comes to following this as an Index
- I think this should be considered as a preliminary when it comes to Trading Cryptos
3) Do not take many confluences before Trading as well

BITCOIN still in Bearish Zone#BITCOIN 1-hr. Chart Analysis
As per present cycle of Descending Broadening Wedge Pattern of CRYPTOCAP:BTC , soon it takes a little pump up to $25.5k to $25.7k but as per complete cycle of Bearish Pennant Pattern it will be declined for uptrend cycle and goes towards $24.5k to $23.5k soon with another Dump into market and may be it will happening into next 2-3 days.
Always #DYOR before investing in #Crypto and Trade wisely by using of #StopLoss
&
Must LIKE, SHARE & Comments on it...

Bitcoin at a key pivot level on the daily chart Bitcoin took support at the neckline of the head and shoulder pattern and now is back to the former resistance levels from where it fell. This is a key pivot level and any break above this will open up a substantial upside for the crypto currency. We have also been getting a good rally in the equities and is there now a case when the riskier assets are being favored? There is the powell testimony today and that will move the counter for sure. But for now and from a technical perspective this rally on the daily chart means the uptrend is intact and that we are more likely to get a breakout than get a breakdown from here on. So wait for any break above the level and then go long.

Bitcoin retested key demand zone Bitcoin if it holds demand zone marked, price could be heading back up towards 31,400.

Bitcoin (BTC) is Ready for Next DeclineBitcoin (BTC) is indicating decline below 37500 based on 38% Retracement Breakout Trading Strategy.
Selling Range is 39060-38420 and Stop loss is 39581.

Bitcoin casual price forecastBitcoin casual price forecast based on Trend and Time based Fib extensions.
Future price projection is based on last cycle Top and bottom assuming similar trend may occur again which might not be the case.
It is a casual analysis just to get an idea, not to be considered for actual trading.

Bitcoin Price Forecast - BTC Price PredictionBitcoin Price Forecast - BTC Price Prediction and Technical Analysis. You need to watch both the trend lines for btc next move.
if btc break the lower trend line then btc can come to $39600 and if it break the upper trend line then btc can goes upto $70,000

Bitcoin's Next Move? Bitcoin is right now at a crucial level. Likely to go in consolidation for the next few days. If it sustains 42k to 44k zone (retests) then we can see a good rally. It may go to 52k soon and retest at 52k levels for a strong bull run towards 65k . However if it breaks the current level and fails to sustain then we may see a dump to 40k levels. Keep a watch as It looks quite weak right now. It's better not to take a trade in choppy market rather let it be in a trend first, indecision is always bad for trading. Let's hope for the best :)

Bitcoin movement July , August Bitcoin Movement August month
From 37K to 50K
(13K Up Movement 50-37=13)
Bitcoin Movement July Month
From 29K to 40K
(13K Up Movement 40-29=13)
Expected movement for September month
Bitcon can reach at 58K to 60K
This chart is only for educational purpose.
If you like my chart give like or comment.
Bitcoin donation address.
13cDaWYHa5G4ckjYyXTBEH4ecg5ogSLYg6

Bitcoin - Looking BullishBitcoin looking bullish near 34000-34200, Target will be 36000 & 40000 USD. SL will be 32500


Bitcoin 4hr analysis 1-17-2021Well good morning again ladies and gentlemen and welcome back to my daily blab about Bitcoin and Bitcoin accessories. (King of the Hill reference) Today I have the 4hr time frame pulled up... I know its a huge surprise. I like the 4hr though guys. It is just my speed. I know every trader is different and I guess I will toss in another time frame sooner or later. But I just feel the 4hr is quite telling at this point in time and more helpful than most other time frames for my trading style. Anyways enough about me. We are here to talk about Bitcoin so lets chat about the charts.
I drew the "ricochets" the candles have been experiencing over the ATH and subsequent consolidation after the ATH (ATH stands for all time high (whichis nearly 42k) for all you noobs reading this) This pattern is all too common in crypto and most other investment opportunities. Identifying patterns like this early allows you to earn more from trading them. If you simply bought when the bottom support of said pattern was touched and sold only when we touched the top you would be making a killing. You could literally buy a lambo just trading a pattern like this.
Patterns like this are fleeting folks. That is why identifying them early is crucial. Otherwise you will make much less. I know its not rocket science what I am trying to explain and many of you vets reading this are rolling your eyes but I speak with noobs every single day and this info will help them a lot. You can also see many instances within the giant triangle pattern I have drawn on the charts. Instances where we bounced without necessarily making it all the way to the bottom of the pattern. That happens. There are numerous indicators within this triangle that can provide support or resistance depending on where the candles are located. With that in mind we can bounce off these indicators within the pattern itself as well and traders that take advantage of most bounces will make the most money (if they play their cards right that is)
Catching each and every bounce requires unlimited patience and unlimited time to sit in front of a cpu all day. Every day. I dont like doing that. Dont get me wrong... I love Bitcoin. I love trading. I love writing theses analysis' I write every day for you guys and gals. But I also love to do other stuff as well. Life is about being happy and I use trading to supplement my income. Im not rich. I hope to be one day. Right now Im just like most of you. Still learning. But I have learned a lot since I began. I remember when I had no clue what an MA was. Now I have a trading course with quite a few clients and I have been #1 Bitcoin analyst on Tradingview numerous times. Not too shabby for someone that has been doing this for less than 2 years.
The way the pattern on the chart looks and the way the weekend tends to have a dip in volume (when compared to weekly volume levels) we may see more dump today folks. I hate to say it. There is bad news and good news though. The bad news is the weekend isnt over tomorrow in the US. Its Martin Luther King Jr day tomorrow so Im certain the CME will be closed and likely we will not see the gap til tuesday. So I guess there is no good news yet. The bad news is I think I see a head and shoulders on the chart. We havent seen the dip so I very well could be wrong. The way I see it is it does no good to argue about such things. Instead of debating the legitamacy of the H&S (head and shoulders) I always say prepare for the worst and hope for the best. Set a stop loss and that will be your back up parachute in case the trade doesnt go your way. Let the market decide. If the majority of traders see a H&S they will react to it and we will see a dip. If the majority disagree with this they wont play it and the dip will be minimal at best. Ive seen clear H&S not play out in terms of a dip after the fact so not every h&s are created equal folks.
We are still holding onto 30k+ and in my book that is a win. The way I see it we will consolidate for most of January and towards the end of the month we should see the result of this big triangle I keep bringing up. The US is discussing stimulus money very soon and that could cause a rise in volume while the mass printing of USD will ultimately cause inflation causing BTC to go up in terms of USD. Because people are buying BTC with the disposable income along with the fact the very currency BTC is tied to (not 100% of the time but there is no denying the US is a big part of the financial eco system of this planet and Bitcoin) These are issues that are not necessarily on the chart but they are still something any and every analyst needs to take notice of. Inflation of the USD will cause BTC to rise. I am confident that this is the start. If printing continues we could see 6 figure BTC sooner than people think.
Im not a financial expert folks. This analysis is my opinion and you can take it or leave it. You should not make any financial moves based on my opinions alone and do some research and learn how to make your own financial decisions. It is much more rewarding to make your own moves based on your own ideas. But I will always make these analysis for those that dont trade and those that just like to read it. I know it gets long at times but I have a big mouth so I have to let it out somewhere. I hope you all have a great Sunday and make good choice my friends. And always remember WTFDIK?????
TLDR: Bouncing around inside this triangle. Right now the 4r cloud is holding the candles but the candles are getting heavy. We may test the bottom of that big triangle before the weekly close in 10 hours.

bitcoin may up 30000 and above bitcoin may up 30000 and above
my view Fibonacci extensions calculate 31600 aprox with in one year

Bitcoin hanging on trend lineBitcoin is currently hanging on a trend a break downwards could bring it to 8400. In case of a bounce back it could continue going upwards.


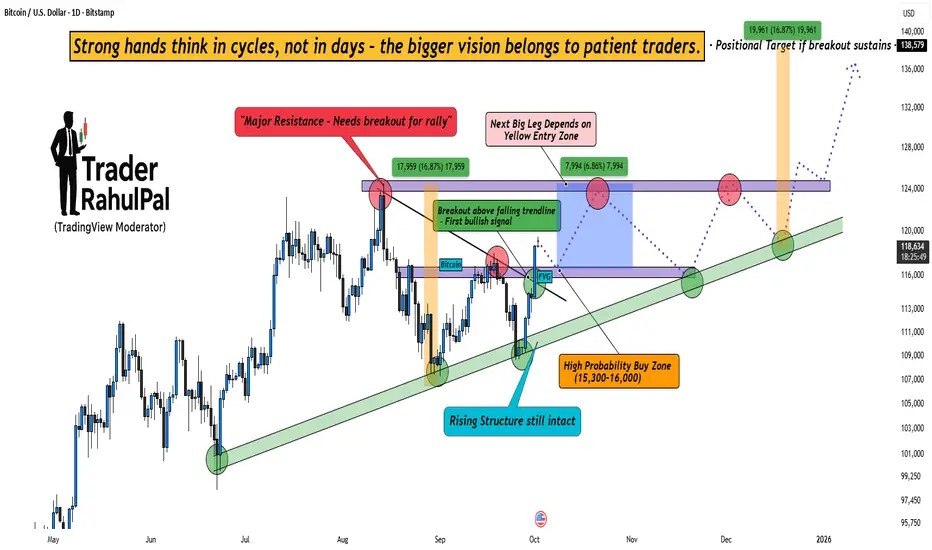
Bitcoin Cycle Play – The Setup That Could Change the Game!Bitcoin is currently showing clear bullish intent , but the real game lies in patience. The chart highlights a decisive breakout above the falling trendline , which is the first bullish signal after weeks of uncertainty.
At the same time, the rising structure is still intact , reminding us that the bigger trend remains strong. Smart money never chases candles – instead, it waits for the high probability zones . In this case, the 15,300–16,000 range could become the golden buying zone for long-term players.
However, one key hurdle remains – the major resistance overhead . Only if Bitcoin breaks and sustains above this zone, the door opens for the positional target near 138,000+ .
The psychology is simple : weak hands focus on short-term noise, but strong hands think in cycles and structures . Every dip tests conviction, but those who hold the bigger vision are the ones who capture the massive moves.
Rahul’s Tip : Don’t rush behind every breakout. Wait for zones where probability aligns with psychology . That’s where the wealth-building trades lie.
Disclaimer: This analysis is for educational purposes only and should not be taken as financial advice. Please do your own research or consult your financial advisor before investing.
Analysis By @TraderRahulPal (TradingView Moderator) | More analysis & educational content on my profile
👉 If you found this helpful, don’t forget to like and follow for regular updates.