Crude, a new positional downtrend...Looks like crude remains in the downward trending channel... and is ready for a positional downside, view negated on closing above 83 (DcB)
Search in ideas for "dcb"

Weak Stock!! Exit/Short.🔴HDFCBank trading below 200/50/20 DMA. Last support @1500
🔴Stock has given sell signal @1522 on VSA Momentum indicator.
🔴Till 1560 is protected on DCB it can see 1476/1416/1355/1289

Sbi Life Triangle BreakoutBuy Sbi Life At Cmp - 1003.15
Strict SL - 949 (DCB)
Target - 1130/1300/1500

boughtbought DCB bank at 127.50 SL 120 daily closing basi,
Disc : It's not a buy and sell recommendation.


Nifty, is this a bottom?Looks like the Nifty forming an Island reversal after the Crude crashed by 6% yesterday. As long as the $$ doesnt go soaring to new highs, it seems like we might see the Index stabilise here...
Fresh rally above 19750, view negated below 19420 (DCB)

MCX AT WEEKLY BEARISH HARMONICSMCX
cmp 2096
closing below 2070 (DCB)
We can short for 1925 / 1830 / 1760
CBSL 2200
Trade Setup-
1) Bearish Shark Pattern
2) Weekly Supply Zone
Regards..
Keshav...
28/09/2023
Disclaimer. I am not a SEBI registered advisor. All views shared on this channel and group are my personal opinions shared for educational purposes .. Good Luck 😉

Nifty! Seems like support takenBuying interest has come in from 19550 levels on the Nifty. As long as 19550/600 levels are held on DCB, the upside can continue

Copper Correction?Seems like the FOMC decision has triggered trouble for Copper & Equities alike.
A test of lower levels 3.6/3.5 is possible soon...
View negated if closes above 3.73 (on DCB as well as WCB)

BANK NIFTY TRG 46000 BN levels mentioned on chart. Also note Trend change time 11.15am 15th sept .
SL 45250 DCB


GMMPfaudler- Big move on the cards?GMMPfaudler was on my watchlist from past couple of months because of its beautiful consolidation after a fall.
Recently, the company has announced good Q1 results due to which a breakout was seen in the stock. It was followed by some profit booking.
On friday, the stock gave a gap down opening due to news(GMM selling stake in the stock) followed by a huge buying momentum.
It seems like the gap down was a SL hunting move for the breakout buyers.
The chart is looking very strong at CMP for minimum target of 1750 and 1970. SL can be below 1400 DCB which is a strong demand zone.
However, since its a news based stock, the risk associated is higher.
Please note that I am sharing this idea only for educational purposes.
One can study and observe the chart as it could be a very beautiful example of how a big move is always preceded by SL hunting.

Hindustan Unilever WeakHind Unilever Larger View :
FMCG index has turned BIG RED.
Hyper Inflation will lead to less demand.
Sell At Cmp 2565.85
Sell On Rise To 2627-2630
SL - 2680 ( DCB )
Target - 2400
Below 2400 Vertical Fall To 1900


Rajesh ExportsPut Sl at 435 DCB and ride till 700-800. Posted a very good result but trying to retest 440 on monthly timeframe.

Genus Power Daily Flag BreakoutA Flag and Pole Breakout structure is visible on the daily chart of NSE:GENUSPOWER with very good voulme. Expecting it countnue its uptrend and may reach my target in very short span of time(my be within two weeks) Risk reward ration is also favourable. RSI on Daily and Weekly chart both are bullish.
------------------Entry@172
Exit@157(DCB)
---------------------------------Target1@187
----------------------------------------------------------Target2@202
------------------------------------------------------------------------------------Target3@217
xit the position if the stop loss triggered on DCB.
DO YOU WANT ALL MY RESEARCH FOR FREE THEN DON'T FORGET TO FOLLOW ME.
I AM EAGERLY WAITING FOR YOU COMMENTS ON THE STUDY...
Disclaimer: Content shared is for information and education purposes only and should not be treated as investment or trading advice. Please do your own analysis or take independent professional financial advice before making any investments based on your own personal circumstances. Investment in securities are subject to market risks, please carry out your due diligence before investing. And last but not the least, past performance is not indicative of future returns.


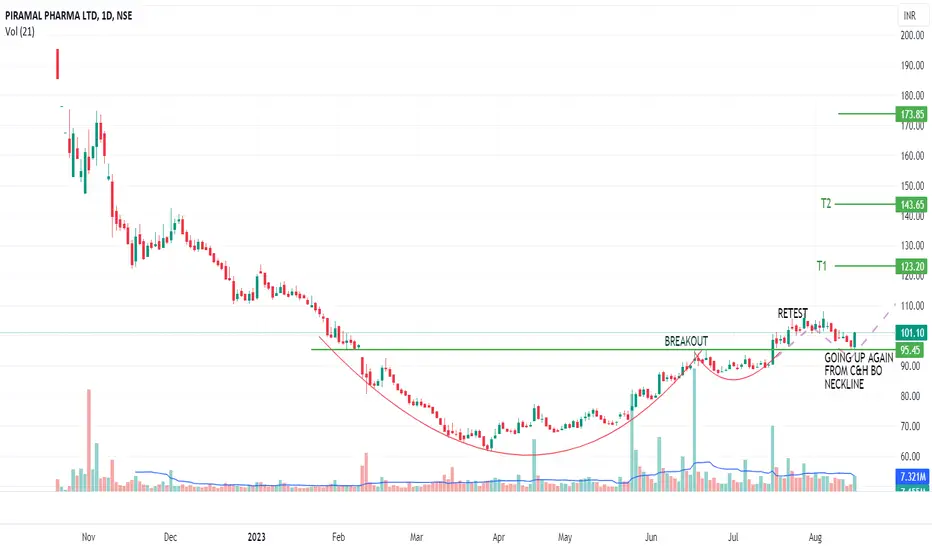
C&H Breakout + Retest Done in PPLPHARMAOverall Rounding Bottom Formation with cup and handle breakout in near term, followed by a retest and bounce back from neckline gives a conviction in this trade setup. Volume should starting coming soon. Can once again touch ATH which was at listing.
Targets - 123, 145, 175 and then 200+
SL - 81 DCB (Below rights issue Price)
Any other views, do comment! Thanks
BIOCON: Paralell Channel BOYesterday Nifty was almost flat, traded in tight range and closed at around 19570, down by almost 26 points. One sector in this market is still shining even after a good rally in the past and that is NSE:CNXPHARMA
NSE:BIOCON One of the contituent of Pharma index with market cap of INR 32794 Crore and it also holds the weightage of 2.36% in Pharma Index, rallied to INR 273.15 or 4.50% yesterday and given a parellel channel Breakout. As the Parma index is also trading near all time high, so i am expecting the bullishness to continue in the pharma sector.
Now, going ahead one can can create a bullish postion at cmp of 273.15 or below with stop loss of 272 on DCB for the tragets of 280/288.
Exit the position if the stop loss is triggered on DCB.
If you agree with the idea then hit the airplane icon and don't forget to follow me to get all the latest updates.
Post your comments and queries.
Disclaimer: Content shared is for information and education purposes only and should not be treated as investment or trading advice. Please do your own analysis or take independent professional financial advice before making any investments based on your own personal circumstances. Investment in securities are subject to market risks, please carry out your due diligence before investing. And last but not the least, past performance is not indicative of future returns.

POLYMED Swing Trade1. Excellent Chart formation. Making Higher highs and Higher Lows.
2. Breakout after 2 years consolidation.
3. Resistance turned into support.
4. Stop below 1075 DCB (daily closing basis)
5. Target about 1500 which turns out to be 1:4 Risk Reward.
Not a recommendation.

Bullish Flag & Pole B/o in UTIAMCGood Morning Friends,
A bullish flag and pole pattern emerged on the hourly chart of NSE:UTIAMC the bullish view will be negated if the stock closed below 756 on DCB. So as per the current probablity one take the trade at 786 or below with stoploss of 756 on DCB basis for the 1st target of 816 then 2nd target of 846 and the final target of 876.
Exit the position if the stop loss triggered on daily closing basis.
The risk reward ratio for the trade is 1:3
DO YOU WANT ALL MY RESEARCH FOR FREE THEN DON'T FORGET TO FOLLOW ME.
i AM EAGERLY WAITING FOR YOU COMMENTS ON THE STUDY...
Disclaimer: Content shared is for information and education purposes only and should not be treated as investment or trading advice. Please do your own analysis or take independent professional financial advice before making any investments based on your own personal circumstances. Investment in securities are subject to market risks, please carry out your due diligence before investing. And last but not the least, past performance is not indicative of future returns.

Making HH-HL ON DTMFMINDA CORP
Making HH-HL ON DTMF, today formed a good Bullish candle with good volume, rsi & adx going up.
Buy above 309.50 (best buy on dcb) or
Wait for retracement near 302-303
Sl 292
Tgt 320-330-340-350-380
As per your holding period.
