INFY ON HOURLY CHARTINFY on hourly chart is sustain above 200 EMA indicating that stock is still in uptrend. Also observing closely we saw that 200 EMA and Fibonacci 61.8% acted as a very strong support for the stocks. Now talking about oscillator, MACD is giving a really good Divergence between price and momentum. Macd divergence with reversal from levels with good volume is indicating that we can look for long setup. Intraday targets are given on chart. Trade at your own risk. Play safe. Strongly maintain your stoploss .
Search in ideas for "macd"

#LETSTALKABOUTMARKET - NIFTYA top is made and one can enter into a short trade with 9525 sl for target of 9400-9350.
Technical indicators:
RSI - rsi is falling after making a high which showcases that nifty is losing it's steam.
MACD divergence- MACD cross has taken place which supports our theory.
Keep strict sl- 9530.
*It is my opinion and i am not sebi registered*
Comment if you agree or share your idea if you disagree.

SOUTHBANK Heads NORTH : Breakout PlaySOUTHBANK breaks out of a daily consolidation with support from volumes. MACD indicator supports well with a positive cross as well as rising MACD Histogram. That means both trend and momentum are in favour of this move up. On the upside, immediate target comes in at 35-36 zone.

Sigachi’s Technical Surge: Next Resistance in SightOver the past month, Sigachi traded within a well-defined consolidation range, reflecting a period of equilibrium between buyers and sellers. However, in the most recent week, the stock decisively broke out above this consolidation zone on increased trading volume a classic signal of renewed bullish momentum and heightened market interest.
From a trend perspective, the stock has managed to close above all key daily EMAs. Notably, a bullish crossover between the 20-day and 50-day EMAs has emerged, which is often interpreted by technical analysts as a sign of strengthening upward momentum.
Momentum indicators further reinforce this view. The RSI is currently above 75, placing the stock firmly in the overbought territory. While such elevated RSI levels can sometimes precede short-term corrections, they also reflect strong underlying demand during robust uptrends. This bullish sentiment is further supported by a MACD crossover on the weekly chart, which typically signals a continuation of upward price action.
At present, the stock is encountering a minor supply zone (as marked on the chart), which may serve as a near-term resistance. Should the price retrace and find support at the previously identified demand zone, the next potential resistance level is observed around ₹56 .
Disclaimer: This analysis is intended solely for educational and informational purposes. It does not constitute investment advice or a recommendation to buy, sell, or hold any financial instrument. Market conditions are dynamic, and trading decisions should be made based on individual research, risk tolerance, and consultation with a licensed financial advisor.

#GODREJIND - VCP Set up Breakout in Daily Time Frame.📊 Script: GODREJIND
Key highlights: 💡⚡
📈 VCP Set up Breakout in Daily Time Frame.
📈 Price consolidating near Resistance, then Breakout.
📈 Volume spike seen during Breakout.
📈 MACD Cross
📈 Can go for a swing trade
⚠️ Important: Always Exit the trade before any Event.
⚠️ Important: Always maintain your Risk:Reward Ratio as 1:2, with this RR, you only need a 33% win rate to Breakeven.
✅Like and follow to never miss a new idea!✅
Disclaimer: I am not SEBI Registered Advisor. My posts are purely for training and educational purposes.
Eat🍜 Sleep😴 TradingView📈 Repeat 🔁

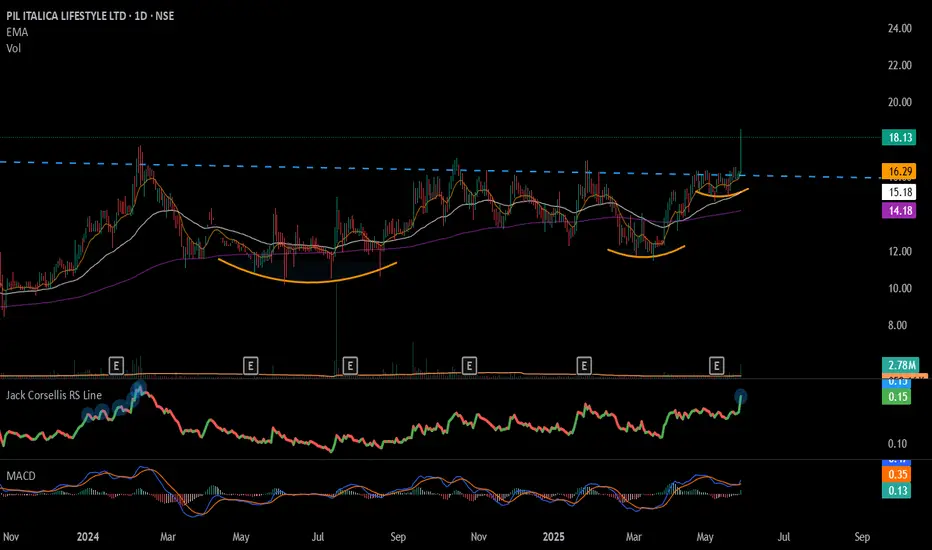
#PILITA - Multi Year BreakOut 📊 Script: PILITA
Key highlights: 💡⚡
📈 8 Year BreakOut in Daily Time Frame.
📈 Price consolidating near Resistance.
📈 Volume spike during Breakout
📈 MACD Bullish
📈 Can go for a swing trade
⚠️ Important: It’s a Penny Stock Trade with extreme caution
BUY ONLY ABOVE 17.50 DCB
⏱️ C.M.P 📑💰- 17.45
🟢 Target 🎯🏆 – NA%
⚠️ Stoploss ☠️🚫 – NA%
⚠️ Important: Market conditions are Okish, Position size 50% per Trade. Protect Capital Always
⚠️ Important: Always Exit the trade before any Event.
⚠️ Important: Always maintain your Risk:Reward Ratio as 1:2, with this RR, you only need a 33% win rate to Breakeven.
✅Like and follow to never miss a new idea!✅
Disclaimer: I am not SEBI Registered Advisor. My posts are purely for training and educational purposes.
Eat🍜 Sleep😴 TradingView📈 Repeat 🔁
Happy learning with MMT. Cheers!🥂
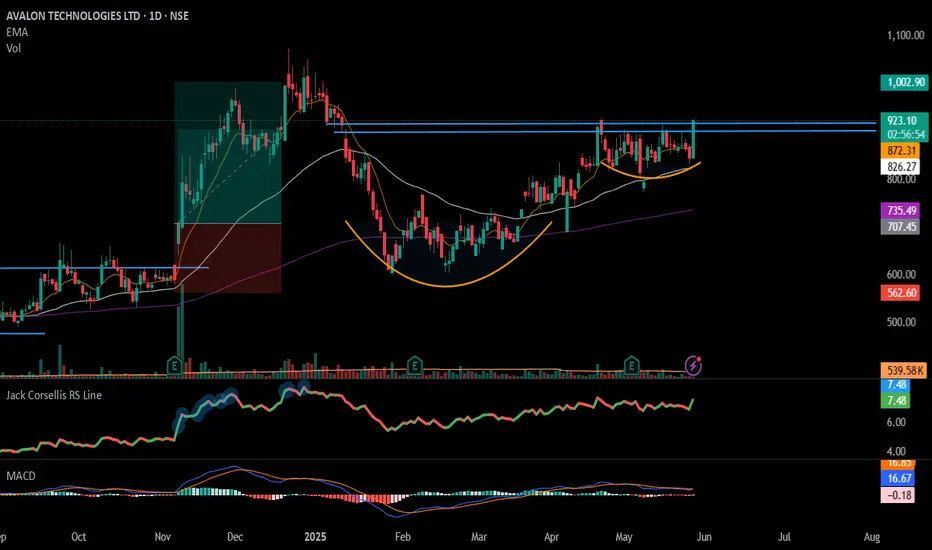
#AVALON - Cup & Handel Potential BreakOut / Keep In WatchList📊 Script: AVALON
Key highlights: 💡⚡
📈 Cup & Handel Potential BreakOut in Daily Time Frame.
📈 Price consolidating near Resistance.
📈 Wait for Volume spike during Breakout
📈 MACD Bullish
📈 Can go for a swing trade
BUY ONLY ABOVE 930 DCB
⏱️ C.M.P 📑💰- 915
🟢 Target 🎯🏆 – NA%
⚠️ Stoploss ☠️🚫 – NA%
⚠️ Important: Market conditions are Okish, Position size 50% per Trade. Protect Capital Always
⚠️ Important: Always Exit the trade before any Event.
⚠️ Important: Always maintain your Risk:Reward Ratio as 1:2, with this RR, you only need a 33% win rate to Breakeven.
✅Like and follow to never miss a new idea!✅
Disclaimer: I am not SEBI Registered Advisor. My posts are purely for training and educational purposes.
Eat🍜 Sleep😴 TradingView📈 Repeat 🔁
Happy learning with MMT. Cheers!🥂
#HCG - VCP Break Out in Daily Time Frame📊 Script: HCG
Key highlights: 💡⚡
📈 VCP Break Out in Daily Time Frame.
📈 Okish Price consolidation near Resistance.
📈 BO with Volume spike.
📈 MACD Bounce
📈 RS making 52WH
📈 One can go for Swing Trade.
BUY ONLY ABOVE 570 DCB
⏱️ C.M.P 📑💰- 574
🟢 Target 🎯🏆 – NA%
⚠️ Stoploss ☠️🚫 – NA%
️⚠️ Important: Market conditions are bad, Position size 20% per Trade. Protect Capital Always
⚠️ Important: Always Exit the trade before any Event.
⚠️ Important: Always maintain your Risk:Reward Ratio as 1:2, with this RR, you only need a 33% win rate to Breakeven.
✅Like and follow to never miss a new idea!✅
Disclaimer: I am not SEBI Registered Advisor. My posts are purely for training and educational purposes.
Eat🍜 Sleep😴 TradingView📈 Repeat 🔁
Happy learning with MMT. Cheers!🥂

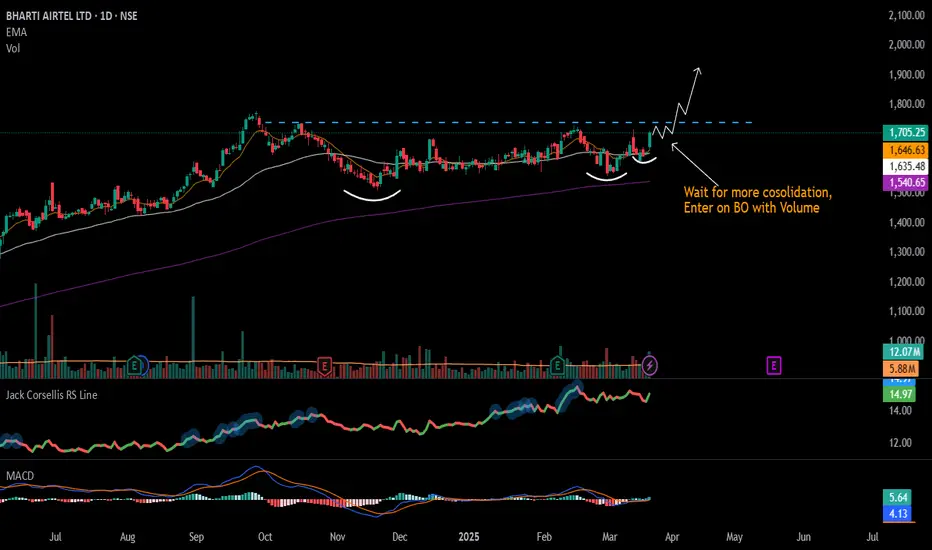
#BHARTIARTL - Potential Breakout Stock / Keep in WL 📊 Script: BHARTIARTL
Key highlights: 💡⚡
📈 VCP formation in Daily chart.
📈 Wait for consolidation
📈 Enter Breakout on Volume spike
📈 MACD Bounce
📈 RS is bullish
📈 One can go for Swing Trade.
BUY ONLY ABOVE 1772 DCB
⏱️ C.M.P 📑💰- 1705
🟢 Target 🎯🏆 – NA%
⚠️ Stoploss ☠️🚫 – NA%
️⚠️ Important: Market conditions are getting better, Position size 50% per Trade. Protect Capital Always
⚠️ Important: Always Exit the trade before any Event.
⚠️ Important: Always maintain your Risk:Reward Ratio as 1:2, with this RR, you only need a 33% win rate to Breakeven.
✅Like and follow to never miss a new idea!✅
Disclaimer: I am not SEBI Registered Advisor. My posts are purely for training and educational purposes.
Eat🍜 Sleep😴 TradingView📈 Repeat 🔁
Happy learning with MMT. Cheers!🥂
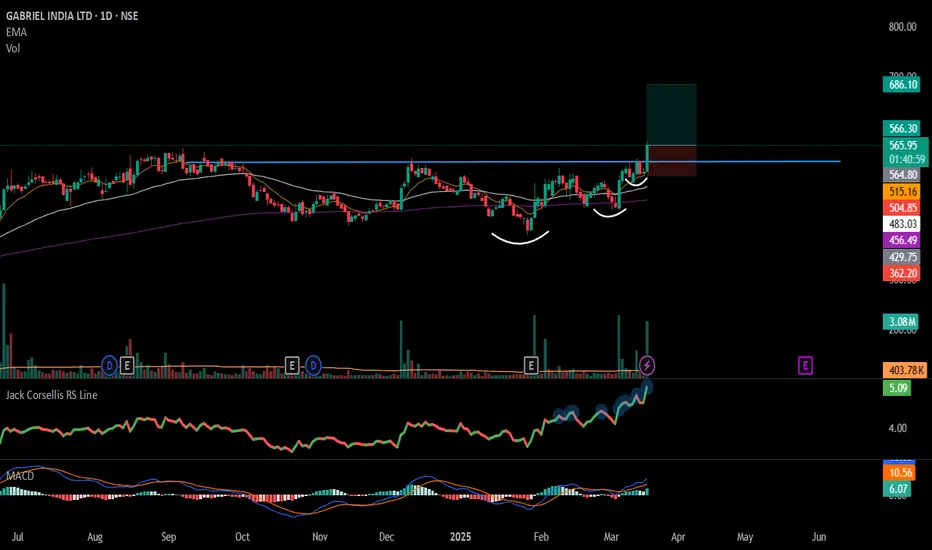
#GABRIEL - VCP Break Out in Daily chart with Volume Spike📊 Script: GABRIEL
Key highlights: 💡⚡
📈 VCP formation in Daily chart.
📈 Price gave a good up move and consolidated.
📈 Volume spike on Breakout
📈 MACD Bounce
📈 RS is making 52WH
📈 One can go for Swing Trade.
BUY ONLY ABOVE 565DCB
⏱️ C.M.P 📑💰- 561
🟢 Target 🎯🏆 – 21%
⚠️ Stoploss ☠️🚫 – 11%
️⚠️ Important: Market conditions are getting better, Position size 25% per Trade. Protect Capital Always
⚠️ Important: Always Exit the trade before any Event.
⚠️ Important: Always maintain your Risk:Reward Ratio as 1:2, with this RR, you only need a 33% win rate to Breakeven.
✅Like and follow to never miss a new idea!✅
Disclaimer: I am not SEBI Registered Advisor. My posts are purely for training and educational purposes.
Eat🍜 Sleep😴 TradingView📈 Repeat 🔁
Happy learning with MMT. Cheers!🥂
Trend Reversal in Aarti DrugsNSE:AARTIDRUGS is showing signs of Trend Reversal Although Still below 100 DSMA and Key Levels if it closes above it and Sustains Those Levels We can see New Highs Quickly, as it broke a Major Trendline with MACD Showing Buy Signal.
Today it increased by 12% on the back of US FDA Clearance of its API Facility at Tarapur.
📌Thank you for exploring my idea! I hope you found it valuable.
🙏FLLOW for more
👍BOOST if useful
✍️COMMENT Below your views.
Meanwhile, check out my other stock ideas below until this trade is activated. I would love your feedback.
Disclaimer: This analysis is intended solely for informational and educational purposes and should not be interpreted as financial advice. It is advisable to consult a qualified financial advisor or conduct thorough research before making investment decisions.

Universal Cables Breaking Out With Good Volumes.NSE:UNIVCABLES today made a king candle hitting the upper circuit of 20% throughout the day with a huge Volume Candle. It took support from a Major Demand Zone With MACD Showing a Buy Signal, until 20 DSMA or Demand Zone is not Breached the up move will Continue further.
NSE:UNIVCABLES is predominantly engaged in the business of manufacturing a large range of power cables from 1.1kV to 400kV & capacitors, Turnkey Projects and other types of wires and cables, conductors, etc.
📌Thank you for exploring my idea! I hope you found it valuable.
🙏FLLOW for more
👍BOOST if useful
✍️COMMENT Below your views.
Meanwhile, check out my other stock ideas below until this trade is activated. I would love your feedback.
Disclaimer: This analysis is intended solely for informational and educational purposes and should not be interpreted as financial advice. It is advisable to consult a qualified financial advisor or conduct thorough research before making investment decisions.

ITI Showing StrengthNSE:ITI is showing strength from 200DSMA and with big volume candles after the breakout a few days earlier. MACD is showing a buy signal, a close above swing high, as shown in the charts, which will have a further quick upswing.
🙋♀️🙋♂️If you have any questions about this stock, feel free to reach out to me.
📌Thank you for exploring my idea! I hope you found it valuable.
🙏FLLOW for more
👍BOOST if useful
✍️COMMENT Below your views.
Meanwhile, check out my other stock ideas below until this trade is activated. I would love your feedback.
Disclaimer: This analysis is intended solely for informational and educational purposes and should not be interpreted as financial advice. It is advisable to consult a qualified financial advisor or conduct thorough research before making investment decisions.

MAPMYINDIA SHOWING STRENGTHNSE:MAPMYINDIA is Showing Strength with Good Volumes, ADX above 30, and MACD shows signs of Reversal Swing trade. A close above 100 DSMA is Important
📌Thank you for exploring my idea! I hope you found it valuable.
🙏FLLOW for more
👍BOOST if useful
✍️COMMENT Below your views.
Meanwhile, check out my other stock ideas below until this trade is activated. I would love your feedback.
Disclaimer: This analysis is intended solely for informational and educational purposes and should not be interpreted as financial advice. It is advisable to consult a qualified financial advisor or conduct thorough research before making investment decisions.

Exploring a Potential Bullish Outlook on VISAKAVisaka Industries Ltd has demonstrated a significant bullish trend as it has successfully closed above both the 20-day and 200-day EMAs. The trading volume during this period reached 2.31M shares, markedly higher than the 20-day average volume of approximately 336K shares, indicating strong investor interest.
Upon examining the stock's chart, it is evident that Visaka Industries has repeatedly found support at the trendline, bouncing back multiple times from a identified demand zone. This pattern is a positive indicator, suggesting a robust buying interest in this price area.
Both the RSI and the MACD indicators are currently situated within the oversold territory on both daily and weekly timeframes. This positioning typically suggests that the stock may be poised for a potential upward move as momentum begins to shift.
The next anticipated supply zone is identified around the price level of 124 . Investors may consider accumulating shares at the current market price CMP , which presents an estimated potential upside of approximately 15%. It is advisable to place a stop-loss order slightly below the demand zone at around 99 to manage risk effectively.
Disclaimer: The information contained in this analysis is intended solely for educational and informational purposes and should not be considered financial advice. Investors are encouraged to perform their own due diligence and/or consult with a qualified financial advisor prior to making any investment decisions.

Adani Power - Perfect Fibonacci Trade SetupAdani Power Trade Setup
The fibonacci setup is giving a very good trade setup for this stock.
the MACD trend lines are about to move up showcasing the end of downward cycle and it's perfectly setting on the fibonacci setup.
Wait for a day or two for the movement in the upward direction and take an entry in the stock with a price target of 895.
the trade is having a ratio of 1:3.6

Swing Trade - GODREJIND📊 Script: GODREJIND
📊 Sector: Chemicals
📊 Industry: Chemicals
Key highlights: 💡⚡
📈 Script is trading at upper band of BB.
📈 MACD is giving crossover .
📈 Double Moving Averages are giving crossover.
📈 Right now RSI is around 64.
📈 One can go for Swing Trade.
⏱️ C.M.P 📑💰- 941
🟢 Target 🎯🏆 - 1000
⚠️ Stoploss ☠️🚫 - 908
⚠️ Important: Always maintain your Risk & Reward Ratio.
✅Like and follow to never miss a new idea!✅
Disclaimer: I am not SEBI Registered Advisor. My posts are purely for training and educational purposes.
Eat🍜 Sleep😴 TradingView📈 Repeat 🔁
Happy learning with trading. Cheers!🥂

Swing Trade - SUNTECK📊 Script: SUNTECK
📊 Sector: Realty
📊 Industry: Construction
Key highlights: 💡⚡
📈 Script is trading at upper band of BB.
📈 MACD is giving crossover .
📈 Double Moving Averages are giving crossover.
📈 Right now RSI is around 65.
📈 One can go for Swing Trade.
⏱️ C.M.P 📑💰- 627
🟢 Target 🎯🏆 - 695
⚠️ Stoploss ☠️🚫 - 599
⚠️ Important: Always maintain your Risk & Reward Ratio.
✅Like and follow to never miss a new idea!✅
Disclaimer: I am not SEBI Registered Advisor. My posts are purely for training and educational purposes.
Eat🍜 Sleep😴 TradingView📈 Repeat 🔁
Happy learning with trading. Cheers!🥂

Swing Trade - HINDPETRO📊 Script: HINDPETRO
📊 Sector: Refineries
📊 Industry: Refineries
Key highlights: 💡⚡
📈 Script is trading at upper band of BB.
📈 MACD is giving crossover .
📈 Double Moving Averages are giving crossover.
📈 Right now RSI is around 68.
📈 One can go for Swing Trade.
⏱️ C.M.P 📑💰- 407
🟢 Target 🎯🏆 - 432
⚠️ Stoploss ☠️🚫 - 393
⚠️ Important: Always maintain your Risk & Reward Ratio.
✅Like and follow to never miss a new idea!✅
Disclaimer: I am not SEBI Registered Advisor. My posts are purely for training and educational purposes.
Eat🍜 Sleep😴 TradingView📈 Repeat 🔁
Happy learning with trading. Cheers!🥂

POONAWALLA reversed from a strong demand zoneApprox. 340-355 is a strong demand zone and from there the price took a reversal. Also MACD has given a positive crossover.
T1- 450, T2- 500 and T3- 568. Sl- 340 and trail as price goes up.
Safe traders can book profit on hitting T1 or T2 as per your risk appetite. Risk takers can go till T3 at max.
Note:- This is only for educational purpose and not a recommendation.

Double Bottom Breakout - Crossover - ANURAS📊 Script: ANURAS
📊 Sector: Chemicals
📊 Industry: Chemicals
Key highlights: 💡⚡
📈 Script is trading at upper band of BB.
📈 MACD and Double Moving Averages are giving crossover .
📈 Right now RSI is around 66.
📈 Script is giving Double Bottom Breakout on daily chart.
📈 One can go for Swing Trade.
⏱️ C.M.P 📑💰- 797
🟢 Target 🎯🏆 - 858
⚠️ Stoploss ☠️🚫 - 767
⚠️ Important: Always maintain your Risk & Reward Ratio.
✅Like and follow to never miss a new idea!✅
Disclaimer: I am not SEBI Registered Advisor. My posts are purely for training and educational purposes.
Eat🍜 Sleep😴 TradingView📈 Repeat 🔁
Happy learning with trading. Cheers!🥂

Crossover - JKCEMENT📊 Script: JKCEMENT
📊 Sector: Cement
📊 Industry: Cement
Key highlights: 💡⚡
📈 Script is trading at upper band of BB.
📈 MACD and Double Moving Averages are giving crossover .
📈 Right now RSI is around 60.
📈 One can go for Swing Trade.
⏱️ C.M.P 📑💰- 4480
🟢 Target 🎯🏆 - 4715
⚠️ Stoploss ☠️🚫 - 4387
⚠️ Important: Always maintain your Risk & Reward Ratio.
✅Like and follow to never miss a new idea!✅
Disclaimer: I am not SEBI Registered Advisor. My posts are purely for training and educational purposes.
Eat🍜 Sleep😴 TradingView📈 Repeat 🔁
Happy learning with trading. Cheers!🥂

Multiple Indicator - TRIVENI📊 Script: TRIVENI
📊 Sector: Sugar
📊 Industry: Sugar
Key highlights: 💡⚡
📈 Script is trading at upper band of BB and giving breakout of it.
📈 MACD is giving crossover .
📈 Double Moving Averages are giving crossover.
📈 Right now RSI is around 71.
📈 One can go for Swing Trade.
⏱️ C.M.P 📑💰- 426
🟢 Target 🎯🏆 - 451
⚠️ Stoploss ☠️🚫 - 416
⚠️ Important: Always maintain your Risk & Reward Ratio.
✅Like and follow to never miss a new idea!✅
Disclaimer: I am not SEBI Registered Advisor. My posts are purely for training and educational purposes.
Eat🍜 Sleep😴 TradingView📈 Repeat 🔁
Happy learning with trading. Cheers!🥂
