Manaksla (D) - Surges 11%, Challenges All-Time High ResistanceManaksla Coated Metals & Ind is showing significant strength, with a powerful surge today pushing it directly against its all-time high resistance. While the underlying trend is bullish, a confirmed breakout is still needed to signal the next leg up.
The Context: Uptrend and Consolidation
The stock has been in a healthy uptrend, which recently culminated in the formation of a new All-Time High (ATH). Following this peak, the stock entered a sideways consolidation phase over the past few weeks, a common and often constructive pattern as it absorbs previous gains before its next potential move.
Today's Powerful Move
Today's session (Monday, October 13, 2025) saw a significant increase in buying pressure:
- Strong Price Gain: The stock surged by +11.05% .
- High Volume: This move was supported by a robust volume of 25.95 million shares .
Crucially, despite this strong surge, the stock closed the day still within its consolidation range , right at the doorstep of the ATH resistance. This sets up a critical test for the days ahead.
This bullish intent is backed by strong technical indicators. The short-term Exponential Moving Averages (EMAs) and the Relative Strength Index (RSI) are both in a bullish state across the Monthly, Weekly, and Daily timeframes.
Outlook and Key Levels to Watch
The immediate future of the stock hinges on its ability to overcome the ATH resistance.
- Bullish Breakout Trigger: A decisive close above the All-Time High on strong volume would confirm a breakout. This would signal a continuation of the primary uptrend, with a potential next target of ₹210 .
- Potential Pullback Scenario: If the stock is rejected from this resistance and fails to break out, it may pull back towards the lower end of its consolidation range. The key support level to watch is ₹128 , which, as you noted, could present a favorable buying opportunity for those looking to enter on a dip.
In conclusion, Manaksla is at a critical juncture. The battle at the all-time high resistance is the key event to monitor. A breakout would affirm the bulls are in control, while a rejection would suggest a longer period of consolidation.
Search in ideas for "oscillator"

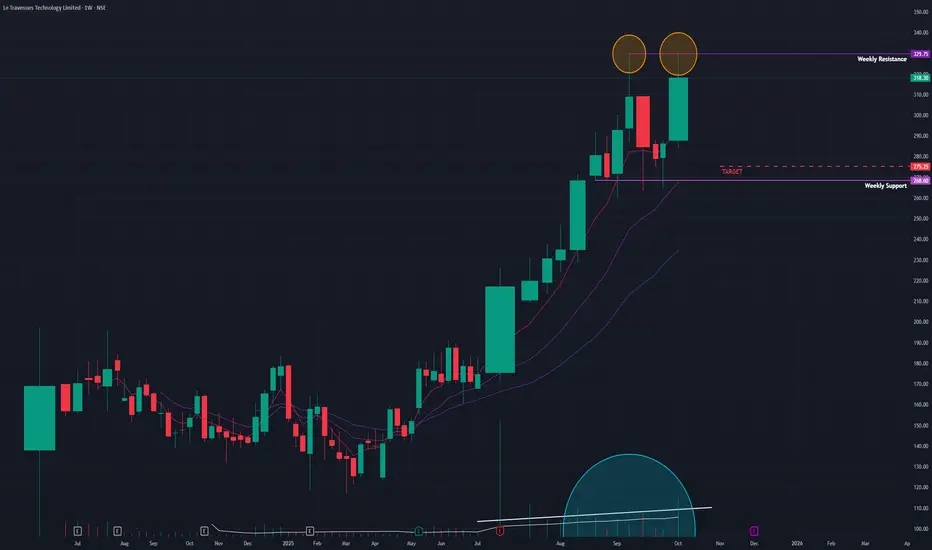
Ixigo (W) - At a Crossroad: Bullish Trend vs. Bearish PatternAfter a spectacular run-up, Ixigo (Le Travenues Technology Ltd) has entered a sideways consolidation phase. The current price action presents conflicting technical signals, placing the stock at a critical inflection point where it could either be pausing before another surge or forming a major top.
The Powerful Backdrop
Since April 2025, Ixigo has been in a powerful bull market, delivering an extraordinary gain of approximately 166% in just a few months. Following this rapid ascent, the stock's strong momentum has paused since August 2025, with the price now trading within a well-defined horizontal range.
The Current Dilemma: Two Competing Scenarios
The technical picture offers two distinct and competing interpretations:
1. The Bullish Case (A Healthy Consolidation):
This perspective views the current phase as a normal and healthy pause, where the stock is building energy for its next advance. This argument is supported by:
- Strong Underlying Momentum: Key indicators like the short-term Exponential Moving Averages (EMAs) remain in a bullish positive crossover state, and the Relative Strength Index (RSI) is still rising, suggesting the primary uptrend remains intact.
2. The Bearish Warning (A Potential Reversal):
Conversely, there are clear warning signs that the rally could be losing steam:
- Potential Double-Top: A Double-Top pattern , a classic bearish reversal signal, appears to be forming at the upper boundary of the trading range.
- Elevated Volume: Typically in a bullish consolidation, volume tends to decrease. However, volume has remained relatively high during this phase, which at a potential peak, can be a sign of distribution (selling) rather than accumulation.
Conclusion and Key Triggers to Watch
Ixigo is currently in a state of equilibrium, and a breakout from the current range is required for confirmation of the next directional move.
- Bullish Trigger: A decisive close above the range's resistance would invalidate the Double-Top pattern and signal a continuation of the uptrend. This would open a path towards the ₹380 level.
- Bearish Trigger: A decisive close below the range's support would confirm the Double-Top pattern, suggesting the bullish momentum has faded and a correction towards the ₹275 level could be imminent.
Until either of these levels is breached, patience is warranted. The direction of the break from this consolidation will be the key to identifying the stock's next major trend.
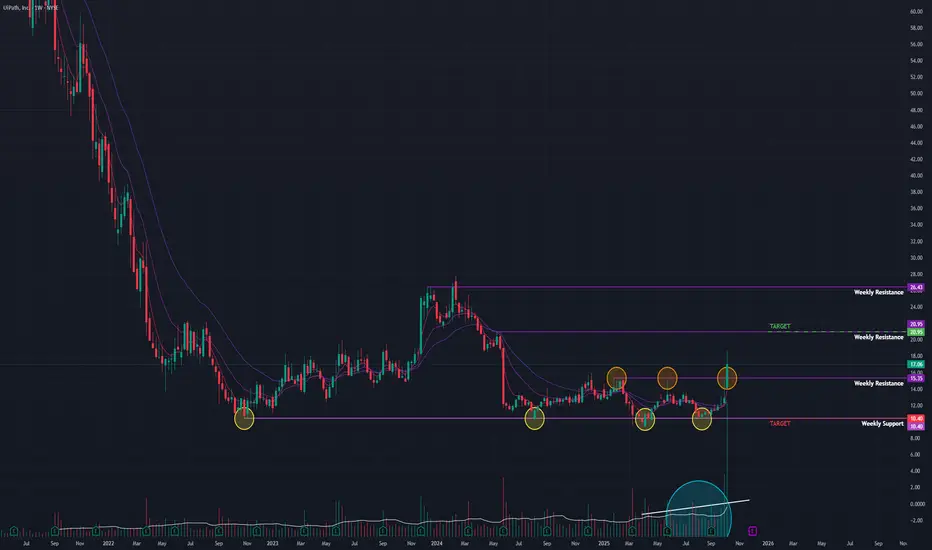
UI Path (W) - A Massive 32% Surge Signals Major Trend ReversalAfter being locked in a severe bear market since its 2021 IPO, UI Path (PATH) has just delivered its most significant bullish signal to date. An explosive, high-volume breakout this past week suggests its multi-year basing phase may be complete and a new major uptrend is beginning.
The Long-Term Bottoming Process
Following its IPO in April 2021, UI Path entered a protracted downtrend. The stock finally stopped making new lows in October 2022, transitioning into a multi-year sideways consolidation range. This long basing period is often where accumulation occurs, setting the stage for a potential trend reversal.
This Week's Explosive Breakout
The week ending Friday, October 10, 2025, marked a dramatic shift in character for the stock:
- Monumental Weekly Gain: The stock skyrocketed by an incredible +32.21% .
- Enormous Volume: This move was validated by a massive trading volume of 366.81 million shares , indicating powerful institutional buying.
- Major Resistance Breach: The surge shattered a key resistance level that had capped prices for the duration of its multi-year consolidation.
This powerful price action has flipped the short-term Exponential Moving Averages (EMAs) into a bullish positive crossover. Concurrently, the Relative Strength Index (RSI) is now strongly rising on both the Monthly and Weekly charts, confirming a significant shift in long-term momentum.
Outlook and Key Levels
The breakout from a multi-year base is a technically powerful event that could define the stock's direction for months to come.
- Bullish Target: If this newfound momentum is sustained, the next major area of resistance and potential target is the $21 level.
- Critical Support: In case of a pullback, the breakout zone around the $10 level is now the most critical new support. A failure to hold this level would invalidate the bullish signal.
This week's action represents a significant technical turning point for UI Path. The key now is to watch for follow-through buying or a successful retest of the $15.35 breakout level to confirm the start of a new, sustained uptrend.
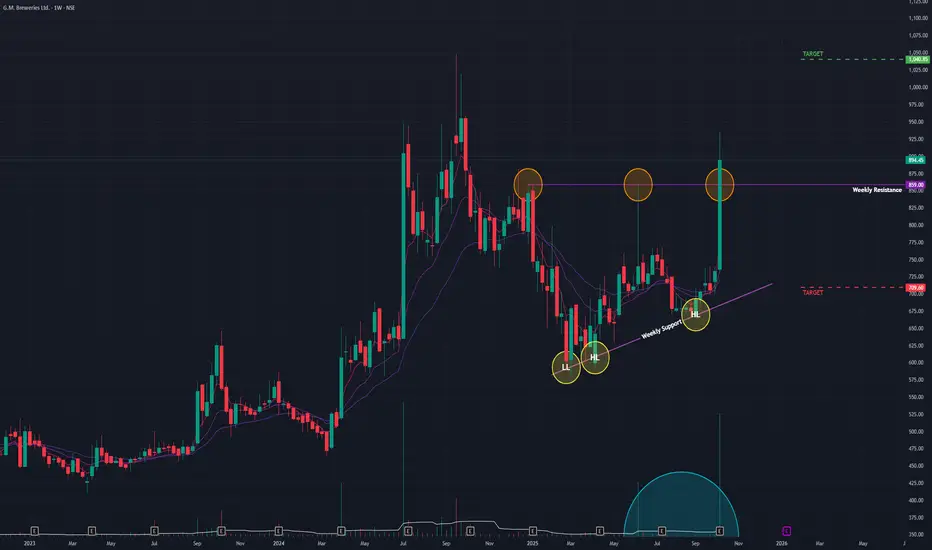
GM Breweries (W) - An Explosive 22% Breakout Signals New UptrendAfter a corrective downtrend from its September 2024 all-time high, GM Breweries has executed a powerful, high-volume breakout, signaling that its consolidation phase is over and a new uptrend is likely underway.
The Bullish Setup
Following its reversal from a low in March 2025, the stock began constructing a solid base. It formed a clear pattern of Higher Lows , indicating a gradual absorption of supply and a shift in control from sellers to buyers. This constructive price action set the stage for a potential upward move.
This Week's Decisive Breakout
The past week's trading session was exceptionally strong, confirming the bullish bias with authority:
- Massive Weekly Gain: The stock surged by an impressive +22% .
- Exceptional Volume: The move was fueled by a massive volume of 11.88 million shares , signifying strong participation and conviction behind the rally.
- Key Resistance Breach: This surge resulted in a decisive breakout and close above a critical horizontal resistance level that had been in place since December 2024.
This bullish price action is further supported by momentum indicators. The short-term Exponential Moving Averages (EMAs) are in a positive crossover state, and the Relative Strength Index (RSI) is rising on both the Monthly and Weekly timeframes.
Outlook and Key Levels
The powerful, volume-backed breakout has cleared a path for potential further upside.
- Bullish Target: If this strong momentum is sustained, the next logical resistance and potential target is the ₹1,040 level.
- Key Support: In the event of short-term profit-booking or a pullback, the recently broken resistance level around ₹710 is now expected to act as the new floor of support.
The key confirmation to watch for in the coming days is whether the price can hold above this crucial **₹859** breakout zone. A successful defense of this level would strongly validate the new uptrend.
SIB (W) - A Powerful Breakout After a Bullish ReversalAfter a brief downtrend from its January 2024 all-time high (ATH), South Indian Bank has signaled a strong bullish reversal, culminating in a decisive, high-volume breakout this past week.
The Reversal and Consolidation
The stock's downtrend was halted by the formation of a Double Bottom , a classic bullish reversal pattern, which kicked off a new uptrend in April 2025. Following this, the stock entered a consolidation phase, trading sideways as it approached a descending resistance trendline from its ATH. During this period, trading volume noticeably dried up, often a precursor to a significant move.
This Week's Decisive Breakout
The stock broke out of its consolidation this week with exceptional force:
- Massive Price & Volume Surge: The stock gained +15.04% , supported by an enormous volume of 180.45 million shares.
- Dual Resistance Breach: The breakout was technically significant as the price closed decisively above two key resistance levels: the primary descending trendline and a short-term horizontal resistance.
This powerful move is strongly supported by momentum indicators. The short-term Exponential Moving Averages (EMAs) show a positive crossover, and the Relative Strength Index (RSI) is rising on both the Monthly and Weekly charts, indicating strong underlying momentum.
Outlook and Key Levels
The breakout suggests a clear upward path, but key levels should be monitored.
- Bullish Target: If the momentum continues, the next major target is the ₹45 level. This would require the stock to break through its previous ATH, which will now act as a significant resistance zone.
- Key Support: If the breakout fails to sustain, the primary support area is likely to be around the ₹27 level.
The key now is to watch for follow-through buying in the upcoming week or a potential retest of the broken trendline as support, which would further confirm the strength of this new uptrend.

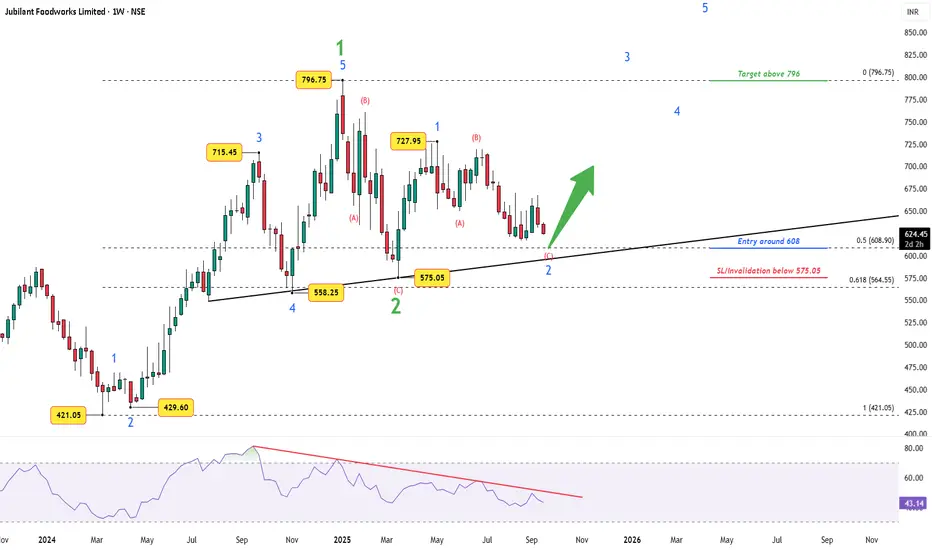
Jubilant Foodworks: Wave 2 Near End?After peaking at ₹796.75, Jubilant Foodworks entered a corrective A–B–C decline, completing Wave 2 near ₹575 — right at the 0.618 retracement of Wave 1. Price has since held above this key support, suggesting the corrective phase may be complete.
The setup is now simple:
Entry Zone: Around ₹608 (0.5 retracement)
Stop-Loss / Invalidation: Below ₹575
Target: Initial confirmation above ₹796, with Wave 3 potential extending higher
Momentum check: RSI correctly flagged the earlier bearish divergence between Wave 3 and Wave 5, leading to the current correction. At present, RSI sits near 43, capped by a falling trendline. A decisive breakout in RSI above 50 would provide the green light for Wave 3’s bullish acceleration.
If the trendline support holds and momentum follows through, Wave 3 could push well beyond the prior peak at ₹796, opening the door to fresh highs.
Disclaimer: This analysis is for educational purposes only and does not constitute investment advice. Please do your own research (DYOR) before making any trading decisions.
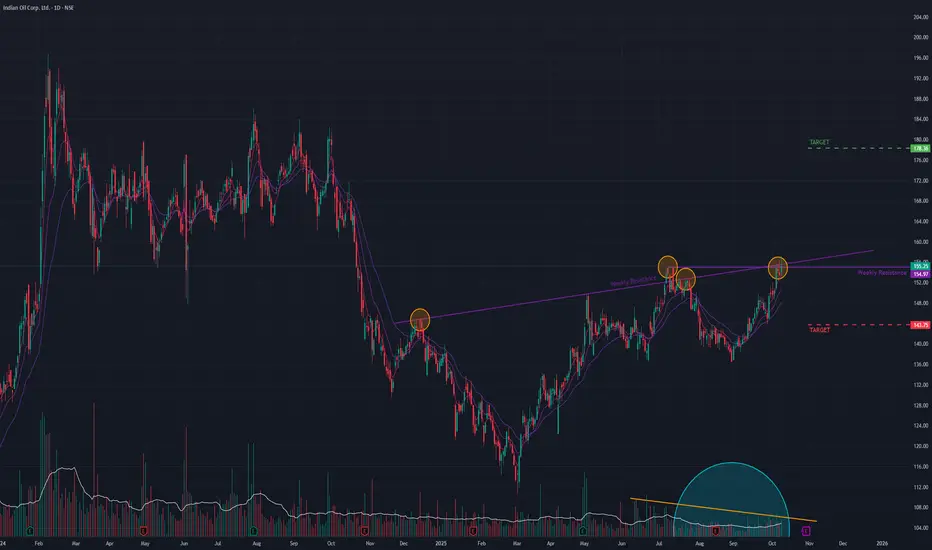
IOC (D) - Tussling with a Critical Resistance ZoneIndian Oil Corp (IOC) is showing a strong bullish structure, but it has arrived at a critical juncture where two significant resistance levels are converging. The price action suggests a battle between buyers and sellers is underway, and a decisive move is imminent.
The Bullish Foundation
After a year-long downtrend that ended in February 2025, the stock has carved out a clear new uptrend , consistently forming higher highs and higher lows. This upward momentum is well-supported by multiple technical indicators:
- Golden Crossover: A long-term bullish "Golden Crossover" of the Simple Moving Averages (SMAs) occurred a few months ago.
- Indicator Strength: The short-term Exponential Moving Averages (EMAs) and the Relative Strength Index (RSI) are in a bullish state across the Monthly, Weekly, and Daily timeframes.
The Resistance Test: A Mixed Signal
The primary challenge for IOC is a confluence of two resistance trendlines: a long-term angular resistance and a short-term horizontal resistance .
Today's trading session was a clear attempt to breach this zone, which resulted in a mixed signal:
- Partial Success: The stock managed to close above the short-term horizontal trendline , a minor positive.
- Key Rejection: However, while it did trade above the more critical long-term angular trendline intraday, it failed to hold these gains and closed below it .
This failure to close above the long-term resistance, combined with consolidating (non-expanding) volume, suggests that sellers are still active and buyers currently lack the conviction to force a decisive breakout.
Outlook and Key Levels
The next few trading sessions are crucial and will provide clarity.
- Bullish Scenario: A convincing daily close above the long-term angular trendline , especially if accompanied by an increase in volume, would confirm the breakout and signal a move towards the ₹178 level.
- Bearish Scenario: Continued rejection from this trendline could lead to a pullback, with the stock likely to find support around the ₹141 level.
The current price action warrants close monitoring. A breakout is clearly being attempted, but confirmation is required before a new directional trend can be established.
Sky Gold (D) - A Golden Breakout from the Downtrend?After being in a corrective downtrend since its all-time high in December 2024, Sky Gold has just executed a technically significant breakout. This move suggests that the period of selling pressure may be concluding and a new uptrend could be underway.
The Breakout Signal
The stock has been constrained by a descending (angular) resistance trendline that formed from its peak. Today's price action decisively broke this barrier:
- Trendline Breach: The stock successfully broke out of the downtrend trendline.
- Massive Volume Confirmation: The breakout occurred on the back of huge trading volume , lending strong credibility to the move.
- Preceding Accumulation: Notably, trading volume has been steadily increasing over the past three days, indicating growing buyer interest leading up to the breakout.
This bullish price action is well-supported by technical indicators. Across the Monthly, Weekly, and Daily timeframes, the short-term Exponential Moving Averages (EMAs) are in a positive crossover, and the Relative Strength Index (RSI) is rising, confirming a build-up in positive momentum.
Outlook and Key Price Levels
The primary challenge now is for the stock to sustain this newfound momentum.
- Bullish Target: If the breakout holds with continued strong volume, the next logical resistance and potential target is the ₹400 level.
- Key Support: If this proves to be a false breakout and the price fails to hold above the trendline, a retreat to the support level around ₹260 is possible.
The immediate future is critical. Traders should now watch for follow-through buying or a successful retest of the broken trendline, which would now be expected to act as support, to confirm the validity of this breakout.

BANK OF INDIA | 1D | Premium Zone ReactionPrice has aggressively tapped into a higher timeframe premium zone after an extended bullish leg. Liquidity above June swing high has been swept clean, followed by a sharp rejection — indicating potential distribution and a short-term correction setup.
🔹 Key Notes:
– Liquidity grab above previous high ✅
– Premium zone mitigation ✅
– Early signs of market structure shift ✅
– Targeting discount reprice near 116–118 zone
Looking for price to retrace into the discount range before any fresh accumulation phase begins.

McLeod Russel (D) - A Decade-Long Downtrend Reversal?After being in a severe downtrend for over ten years since its all-time high in February 2013, McLeod Russel is now showing compelling signs of a major trend reversal. A multi-year consolidation phase appears to have ended with a powerful, momentum-driven breakout.
The Breakout: A Shift in Momentum
The stock was locked in a sideways consolidation range since August 2020. However, recent price action signals a decisive shift in control from sellers to buyers:
- Building Strength: Over the past few weeks, the stock began forming a pattern of Higher Lows , an early indication that selling pressure was diminishing and buyers were stepping in at higher prices.
- Resistance Breach: On Friday, October 6th, the stock decisively broke out of a major, multi-year resistance level.
- Explosive Follow-Through: The breakout was followed by extremely bullish action this week, with the stock gapping up at the open and immediately hitting the upper circuit limit each day. This indicates intense buying interest with a complete absence of sellers.
This powerful move is confirmed by key technical indicators. The short-term Exponential Moving Averages (EMAs) are in a positive crossover, and the Relative Strength Index (RSI) is firmly in bullish territory across the Monthly, Weekly, and Daily timeframes.
Outlook and Key Levels
The current momentum suggests a significant new uptrend is underway.
- Bullish Target: If this strong momentum continues, the next logical resistance and potential target for the stock is the ₹85 level.
- Support Level: Should the momentum pause or a pullback occur, the breakout level around ₹35 is expected to act as a strong support zone.
Given the rapid, vertical ascent, traders should watch the price action closely in the coming days for signs of either continuation or short-term exhaustion.

Indraprastha Medical (D) - Bullish Breakout or Bearish Reversal?Indraprastha Medical Co. is at a critical juncture, presenting conflicting signals that warrant close attention. While the long-term trend remains bullish, emerging patterns suggest a potential reversal.
The Bullish Case: Strong Momentum
The stock has been in a consistent uptrend since July 2023, followed by a period of sideways consolidation that began in October 2024. Today's session was notably strong:
- New All-Time High: The stock registered a new all-time high, with the closing price being the same as the high of the day. This indicates intense buying pressure and an absence of selling at the peak.
- Massive Volume: The breakout was supported by exceptionally high trading volume, adding conviction to the upward move.
- Indicator Alignment: Key momentum indicators are bullish across multiple timeframes (Monthly, Weekly, and Daily). The short-term Exponential Moving Averages (EMAs) are in a positive crossover state, and the Relative Strength Index (RSI) is rising, confirming the underlying strength.
If this bullish momentum is sustained and the stock decisively breaks out from the current resistance zone, the next potential target is the ₹760 level.
The Bearish Counterargument: Divergence and Reversal Pattern
Despite the bullish price action, there are significant warning signs:
- Potential Double-Top: Today's new high has formed a potential Double-Top pattern on the Monthly, Weekly, and Daily charts. This is a classic bearish reversal pattern that can signal a market peak.
- Bearish Divergence: Crucially, this pattern is accompanied by a bearish divergence in the RSI. While the price made a new high, the RSI failed to do so, suggesting that the momentum behind the rally is weakening.
If the breakout fails and this bearish pattern plays out, the stock could see a significant correction, with a potential downside support level at ₹385 .
Conclusion and Outlook
The current technical landscape is ambiguous. We have a powerful breakout candle on high volume conflicting with a classic bearish reversal pattern and weakening momentum.
The immediate price action in the upcoming days is critical. Traders should wait for confirmation . A sustained move above today's high would validate the bullish case, while a failure to hold these levels and a subsequent breakdown would give credence to the bearish scenario.

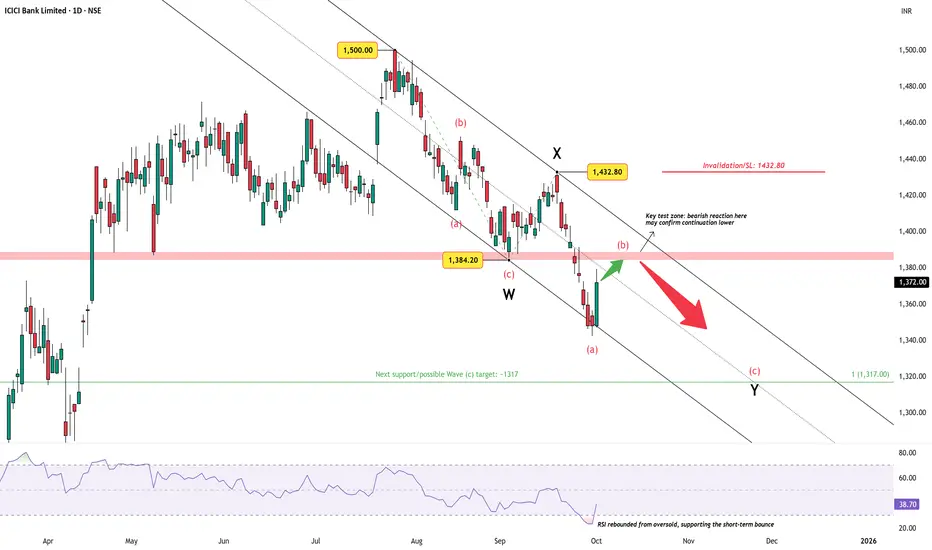
ICICI Bank – Relief Rally into ResistanceAfter topping at ₹1500 , ICICI Bank has corrected over 10% into late September, carving out a clear W–X–Y corrective structure. The recent bounce from oversold RSI levels was expected, but price is now heading straight into the crucial resistance band near ₹1384 .
A bearish reaction here would validate the ongoing correction, opening the path toward the next support / Wave (c) target at ~₹1317 .
However, any sustained move above ₹1432.80 would invalidate the bearish view and suggest a different structure in play.
Overall, the setup currently favors caution on rallies, with focus on whether sellers defend the resistance band.
Disclaimer: This analysis is for educational purposes only and does not constitute investment advice. Please do your own research (DYOR) before making any trading decisions.
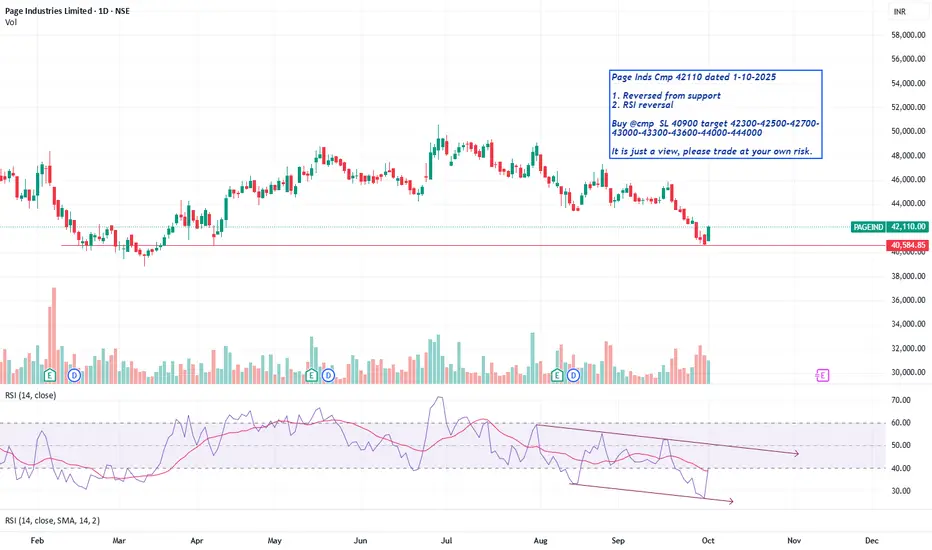
Page Inds Cmp 42110 Reversed from supportPage Inds Cmp 42110 dated 1-10-2025
1. Reversed from support
2. RSI reversal
Buy @cmp SL 40900 target 42300-42500-42700-
43000-43300-43600-44000-444000
It is just a view, please trade at your own risk.
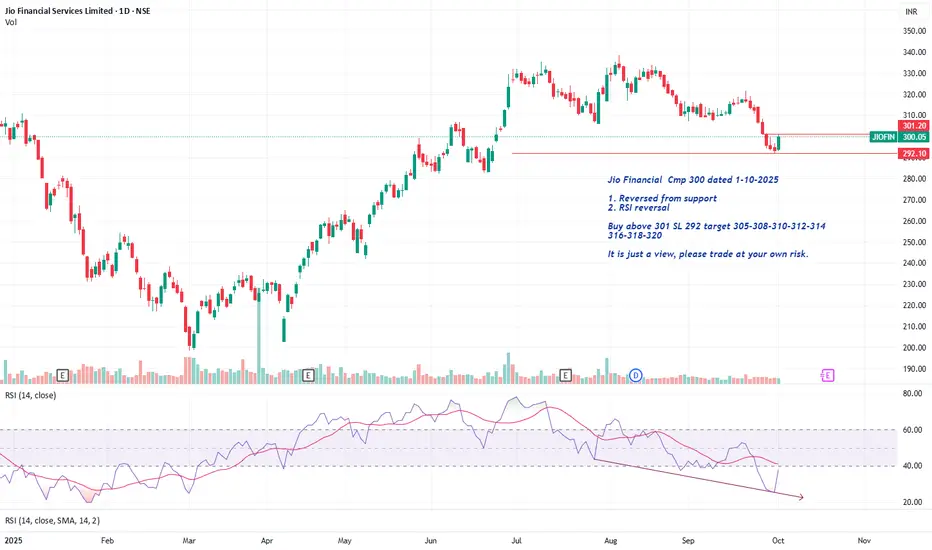
Jio Financial Cmp 300 Reversed from supportJio Financial Cmp 300 dated 1-10-2025
1. Reversed from support
2. RSI reversal
Buy above 301 SL 292 target 305-308-310-312-314
316-318-320
It is just a view, please trade at your own risk.
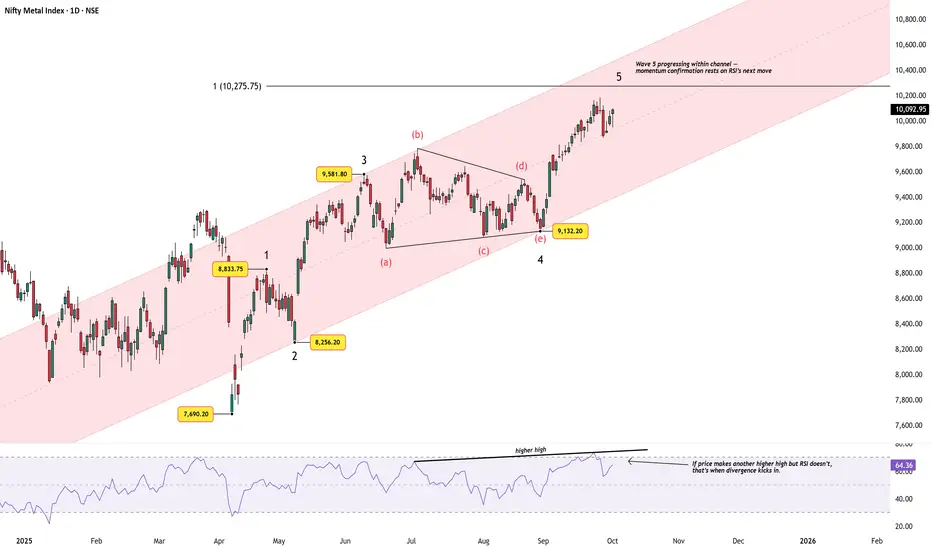
Nifty Metal Index – Fifth Wave Progression Within ChannelChart Structure:
The Nifty Metal Index continues to respect its rising channel, now advancing in Wave 5 after a clean contracting triangle in Wave 4. The impulse structure remains intact, with price steadily hugging the channel’s midline and now stretching toward the upper half.
Elliott Wave View:
Wave 1 topped near 8,833.75, after a strong rally from 7,690.20.
Wave 2 retraced into 8,256.20, holding close to the 0.382 retracement of Wave 1.
Wave 3 extended sharply to 9,581.80.
Wave 4 unfolded as a clean contracting triangle (a–b–c–d–e), ending at 9,132.20.
Wave 5 is currently progressing within the channel, with price advancing to 10,275.75, towards the 1.0x Fib extension level of Wave 1 projected from Wave 2.
Momentum Check:
RSI has confirmed the latest higher high, keeping momentum aligned with price. The key to watch now: If price makes another higher high but RSI fails to do so, that’s when bearish divergence would emerge.
Summary:
The index maintains a constructive Elliott Wave structure, but we are in late-wave territory. The channel provides a natural guide — holding the midline favors further upside, while a sustained breach of the lower channel would warn that Wave 5 has matured.
Disclaimer: This analysis is for educational purposes only and does not constitute investment advice. Please do your own research (DYOR) before making any trading decisions.
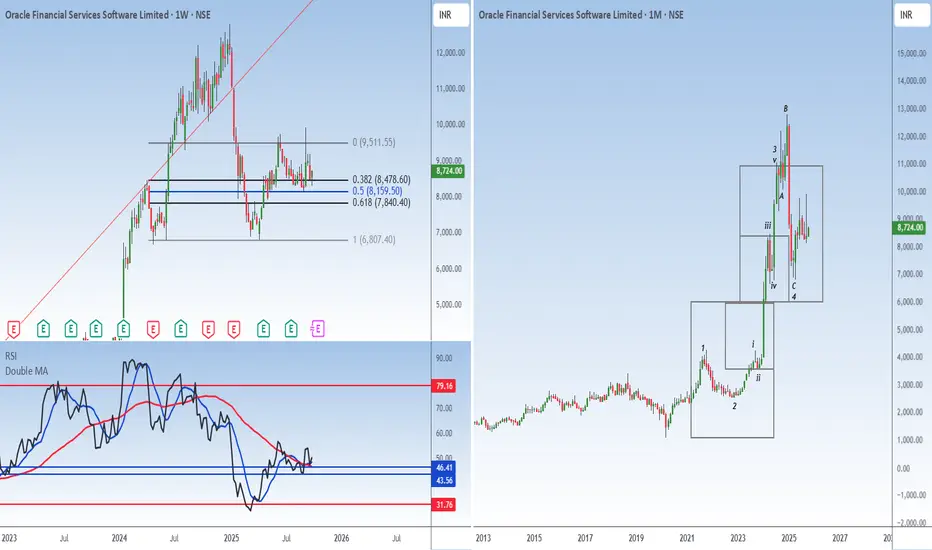
This IT stock is all ready to shootOFSS CMP 8724
Elliott - yet another example of how 4th waves tend to cluster together. This is the 5th wave and the last of the impulse waves. Hence expect a strong move from here.
Fib - the dip has halted at 50% of the rally which is strength.
RSI - the oscillator below the MA cross and above the bull zone is telling me its ready to take off.
Conclusion - this stock is a clear indication to me that the fall in IT is over. Every other stock that I follow is showing that it is ready to propel.
Use this dip to buyBankNifty CMP 54460
Fib- the dip to 53700 is 38.2% of the rally. This is an indication of strength.
Elliott- The corrective pattern is a zig zag where A is equal to C. So the halt at 53700 is confirmed with Elliot wave too. To me this will be the start of iii of 3 which is generally the strongest of the waves.
RSI- the oscillator taking support above the bull zone is confirming the strength.
Conclusion- Use this dip to buy.

Zydus LifeScience Cmp 1037 Dark Cloud Cover @ topZydus LifeScience Cmp 1037 dated 19-9-2025
1. Dark Cloud Cover @ top
2. RSI breakdown
Sell below 1034 SL 1060 target 1030-1025-1015-1005-1000-990-980
It is just a view, please trade at your own risk.

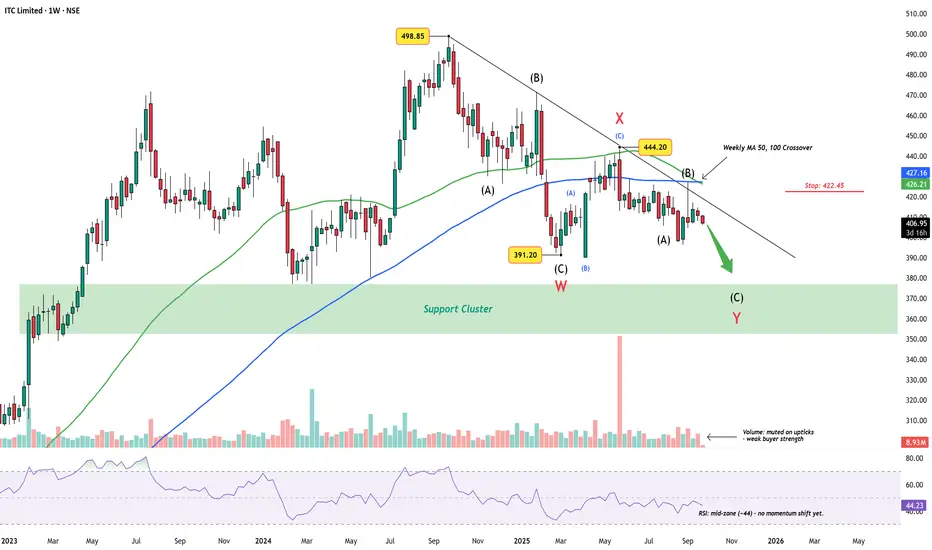
ITC Limited Weekly Chart – Wave Y Targets Support ClusterITC has been trending lower since the ₹498.85 peak, carving out what appears to be a complex W-X-Y correction. The first leg (W) found support near ₹391.20, followed by a corrective bounce into X at ₹444.20. The decline since then has kept price under a descending trendline, respecting the larger corrective rhythm.
Wave Count
Wave W: Completed into the ₹391.20 low.
Wave X: Counter-trend rally capped at 444.20.
Wave Y: Now unfolding, with sub-wave (C) still incomplete.
The broader structure hints that ITC may continue toward the support cluster (₹350–375) before this correction runs its course.
Indicators
Volume : Muted on upticks – rallies lack buying strength.
RSI (~44) : Mid-zone, leaving space for further downside before oversold conditions.
Weekly 50/100 MA crossover : Adds weight to the ongoing corrective bias.
Invalidation
A decisive break above ₹422.45 and sustained strength beyond 427 would question this bearish view, hinting at a possible shift back to bullish sequences.
Summary
Unless ITC reclaims higher ground above 422.45, the bias stays toward a Wave Y completion in the support cluster zone.
Disclaimer: This analysis is for educational purposes only and does not constitute investment advice. Please do your own research (DYOR) before making any trading decisions.
CIEINDIAParameters :
1. Ichimaku support
2. RSI near 50
3. Price correct from all time high almost 40%
4. Strong Fundamentals
Stoploss : 330(22%)
Target : 1] 700(66%) 2] 900(113%) 3] 1060(150%)

signs of trend reversalBandhan Bank Technical Analysis (CMP: 168)
Fibonacci Analysis: After a strong rally from 132 to 190 (over 40%), the correction halted at the 38.2% retracement level, indicating underlying strength.
RSI: The oscillator finding support above the bull zone suggests a potential trend change.
Moving Averages: The convergence of all MAs indicates the stock is poised for a directional move.
Trendline: A break above the falling trendline will further confirm the positive outlook.
Conclusion: Given these signs, if you hold the stock, it's advisable to hold on, as the potential for a trend reversal is building.

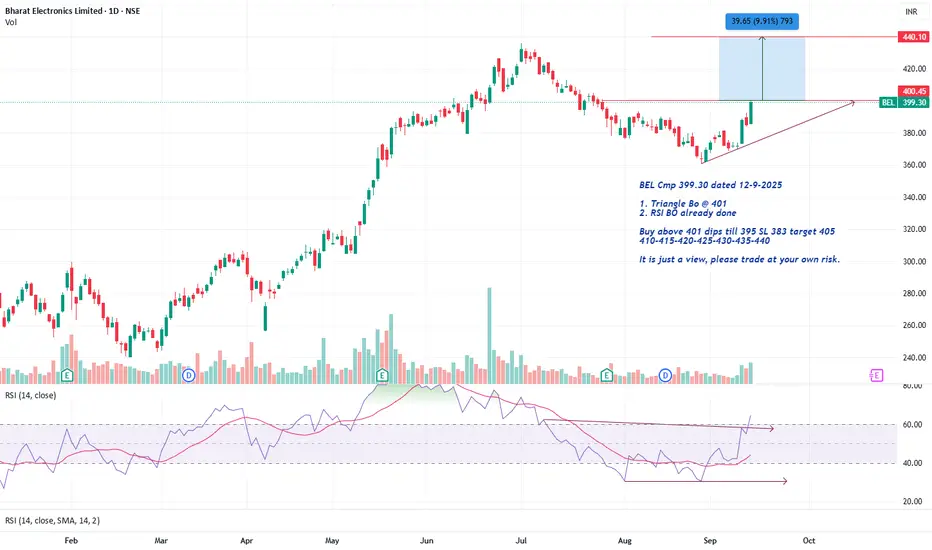
BEL Cmp 399.30 Triangle BOBEL Cmp 399.30 dated 12-9-2025
1. Triangle Bo @ 401
2. RSI BO already done
Buy above 401 dips till 395 SL 383 target 405
410-415-420-425-430-435-440
It is just a view, please trade at your own risk.
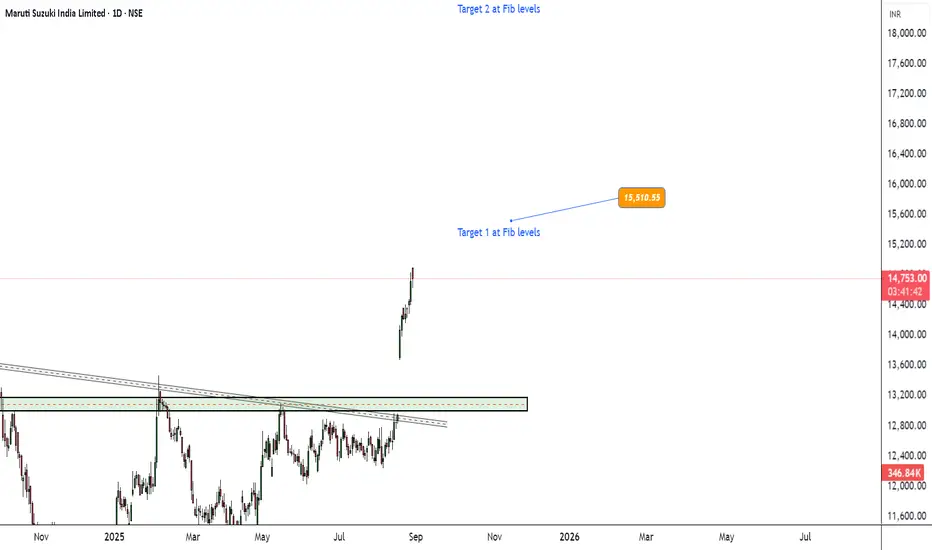
Maruti Suzuki: Strong Breakout and Key Support Levels – Sept 25The Maruti Suzuki India Limited chart displays a strong upward trend with recent price action indicating a potential consolidation or pullback after a significant rally.
Technical indicators highlight important support and resistance levels, overall momentum.
Price Action & Trend
1.The price has recently surged from around ₹13,200 to a high of ₹14,754, reflecting a robust bullish move over the observed period.
2. Candlestick patterns show a sequence of higher highs and higher lows, typical of a sustained uptrend.
3. The current price is ₹14,749, slightly below the recent high, suggesting short-term profit booking or consolidation after an aggressive rally.
Volume & Signals
1.Volume has spiked during breakout points, providing confirmation for the bullish run. A recent decline in volume may suggest waning momentum or a period of consolidation.
2.The Stochastic or RSI-like oscillator is currently at 16.82, which is in the oversold territory. This could hint at an imminent reversal or a bounce if buyers regain control.
Buying Levels -
Above all time high and targets could be placed around 15,500 and 18,000.
#swingtrading
#volumeburst
#autosectorstocks
This is just a analysis and not to be considered as buy or sell. Do your analysis before taking any positions.
Happy trading.