Search in ideas for "oscillator"


Axis - Oversold and good risk reward for longsIf Axis doesn't close below 680 over the next few days, there is a strong possibility of it testing the kijun line at 715.

ASIANPAINT level for 04-03-2020(Intraday)It closed near Fib level and strong bullish candle at BB lower channel with support of trendline , with stoch below 30.
Break out of Fib level with stoch trendline expected Bullish ,breakout the major support expected bearish
Above 1815 Bullish for 1825, 1845,1900
Below 1785 Bearish for 1775,1755,1710


#Bergerpaint is forming bearish divergence.Find your opportunity#Bergerpaint is forming bearish divergence. Find your opportunity

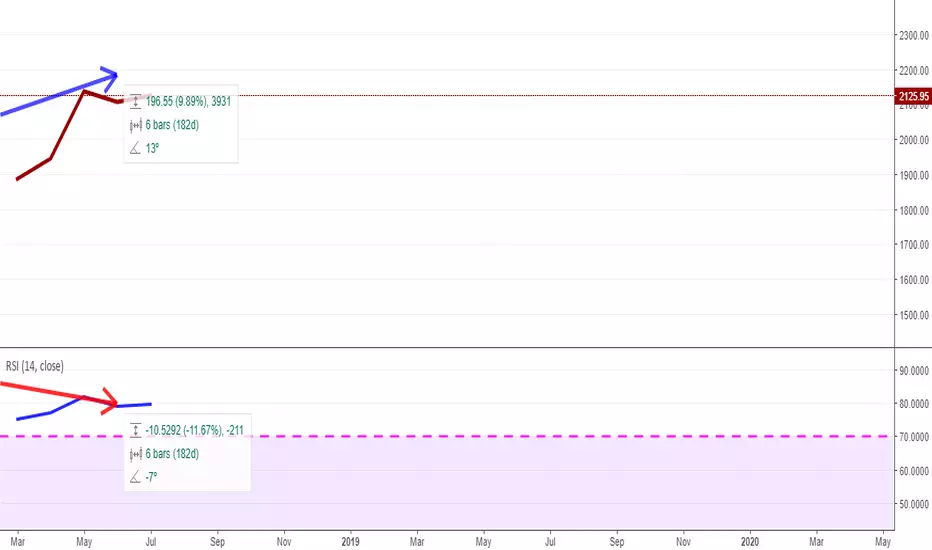
Nifty will fall in coming monthsMarkets will fall in coming months, RSI is showing a clear Negative Divergence on the monthly chart. 10 yr long Bull Run needs to end before we start the next phase of our markets.

Positional setup 4 HUL positional sell setup for hul with sl around 1720/25 zone with targets around 1550/1500/1395/1284

shorthidden bearish divergence on hourly and possible head and shoulders pattern on daily makes it an ideal shorting candidate.short once price breaks doen 50 ma on 15 min tf

BULLISH AT CURRENT LEVELS ON 31/12/2018 @ 1107.85LONG WITH UPSIDE TARGETS OF 1200 & 1268 WITH SL OF 990 AS PER MOMENTUM & FIBONACCI!


hidden bearish divergence This counter rally is running into a hidden bearish divergence. Volume is declining. The trendline breakout didnt bring in a lot of buyers. I expect the stock market to go down, trying to continue it's downtrend.
Going straight back to the all time high without looking back would be very surprising.


Titan Bearish Divergence on 4h ChartTitan Chart shows Bearish Divergence on RSI, Stoch RSI and Momentum too.
A pull Back is possible but overall Stock looks bullish for longer term.
Bearish Divergence + Price approaching Resistance may bring the Price Down.
If setup fails and breaks 910, Wait and buy the retest of 900 areas in next couple of days.


Bank Nifty mildly bearishIt seems profit booking may drag NIFTY B to 27500 in 3-4 sessions. Three indicators are confirming these:
1. Renko Daily chart (Brick size = 38)
2. RSI (14) hitting the upper threshold.
3. Aroon Down (Red) crossing Aroon Up (Green).
Once can take a position to gain 600-650 bank nifty points.

DALMIABHA for Swing TradingDALMIABHA can be bought for swing trading.
Price crossed above EMA 50 which shows the trend is up.
Also after giving breakout of EMA 50 it is in pullback mode and it has formed inside bar after pin bar.
MACD also confirms an up trend and facing up and also above zero line.
Risk Reward 1:2.

VEDL to observeRSI divergence.
Don't know about fundamentals and profits but
probably a good setup near earnings date.

Clear RSI Divergence in HDFC Bank Monthly
1: HDFC Bank Monthly, Price making Higher high
2: RSI Making Higher low
3: Safe until stock breaks 8 EMA (Not in this pic) on Monthly closing basis. Short term investors can tighten their trailing stops NSE:HDFCBANK
TATA GLOBAL - Long PositionRetraced to almost 61.8% of the rise from 16th May to 15th June
- Targets= 278/284/289/295/303 (futures prices July contract)
- SL below 252 closing basis (futures prices July contract)
