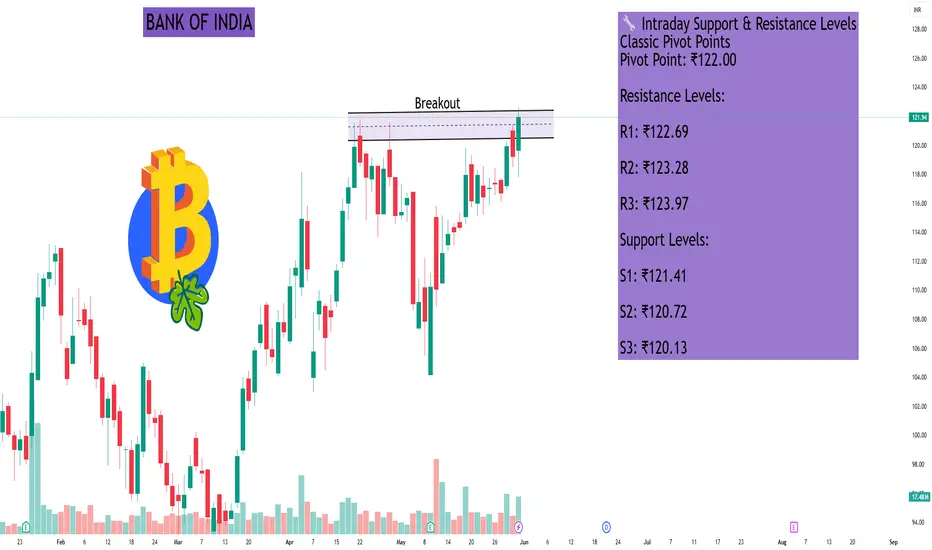
BANK OF INDIAHere are the intraday (1-day) support and resistance levels for Bank of India (NSE: BANKINDIA) as of the latest available data:
📊 Price Snapshot (as of May 30, 2025)
Last Traded Price: ₹121.94
Day’s Range: ₹117.80 – ₹122.61
52-Week Range: ₹90.05 – ₹137.45
Volume: 17,477,465 shares
VWAP: ₹121.03
Market Capitalization: ₹55,515 crore
Beta: 1.21
Dividend Yield: 2.30%
Book Value per Share: ₹162.55
Upper Circuit Limit: ₹131.13
Lower Circuit Limit: ₹107.28
🔧 Intraday Support & Resistance Levels
Classic Pivot Points
Pivot Point: ₹122.00
Resistance Levels:
R1: ₹122.69
R2: ₹123.28
R3: ₹123.97
Support Levels:
S1: ₹121.41
S2: ₹120.72
S3: ₹120.13
Fibonacci Pivot Points
Pivot Point: ₹122.00
Resistance Levels:
R1: ₹122.49
R2: ₹122.79
R3: ₹123.28
Support Levels:
S1: ₹121.51
S2: ₹121.21
S3: ₹120.72
Camarilla Pivot Points
Pivot Point: ₹122.00
Resistance Levels:
R1: ₹122.22
R2: ₹122.33
R3: ₹122.45
Support Levels:
S1: ₹121.98
S2: ₹121.87
S3: ₹121.75
📈 Technical Indicators Summary
Relative Strength Index (RSI): 70.99 (Buy)
MACD (12,26): 0.93 (Buy)
ADX (14): 32.69 (Buy)
Stochastic RSI (14): 92.60 (Overbought)
CCI (14): 191.58 (Buy)
ATR (14): 1.05 (High Volatility)
Williams %R: -13.78 (Overbought)
🧭 Trading Outlook
Trend: Strong Bullish
Recommendation: The stock exhibits a strong bullish trend with multiple technical indicators signaling a 'Buy'. However, the Stochastic RSI and Williams %R indicate overbought conditions, suggesting caution for new entries. Traders should monitor for potential pullbacks or consolidation before initiating new positions.
Search in ideas for "stochastic"
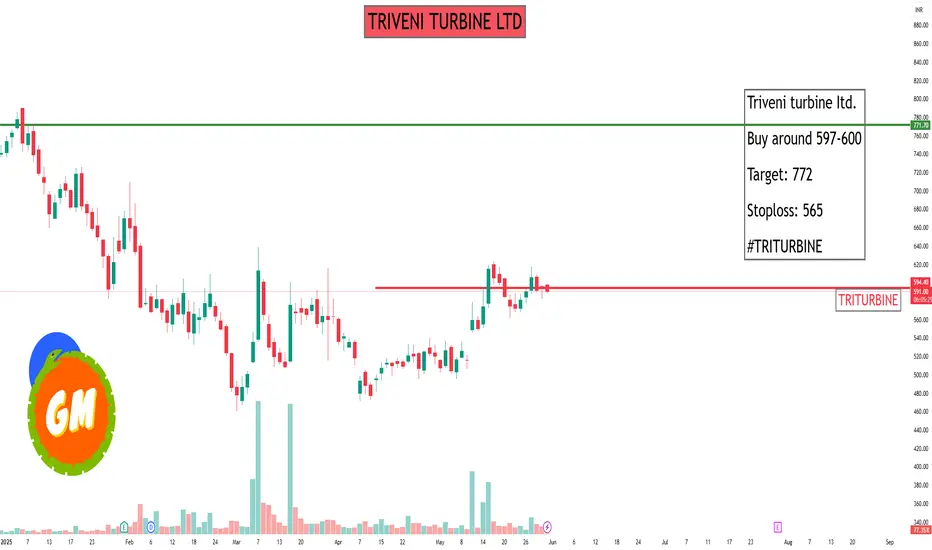
TRIVENI TURBINE LTDAs of May 30, 2025, Triveni Turbine Ltd. (NSE: TRITURBINE) is trading at approximately ₹595.40 . Based on the latest technical data, here are the intraday support and resistance levels:
🔹 Intraday Support & Resistance Levels
Standard Pivot Points:
Support Levels:
S1: ₹597.12
S2: ₹584.98
S3: ₹577.87
Resistance Levels:
R1: ₹616.37
R2: ₹623.48
Fibonacci Pivot Points:
Support Levels:
S1: ₹597.12
S2: ₹589.76
S3: ₹585.22
Resistance Levels:
R1: ₹604.47
R2: ₹609.01
R3: ₹616.37
Camarilla Pivot Points:
Support Levels:
S1: ₹590.34
S2: ₹588.57
S3: ₹586.81
Resistance Levels:
R1: ₹593.86
R2: ₹595.63
R3: ₹597.39
Note: These levels are derived from pivot point calculations and can vary based on market conditions.
🔹 Technical Indicators
Relative Strength Index (RSI): The RSI is currently between 45 and 55, indicating a neutral condition.
Stochastic Oscillator: The Stochastic Oscillator is in the bullish range, suggesting potential upward momentum.
🔹 Recent Price Action
Triveni Turbine's stock has experienced significant volatility recently. After reaching a high of ₹885.00 on November 26, 2024, the stock declined to a low of ₹460.30 on March 3, 2025. Since then, it has rebounded, trading around ₹595.40 as of May 30, 2025.
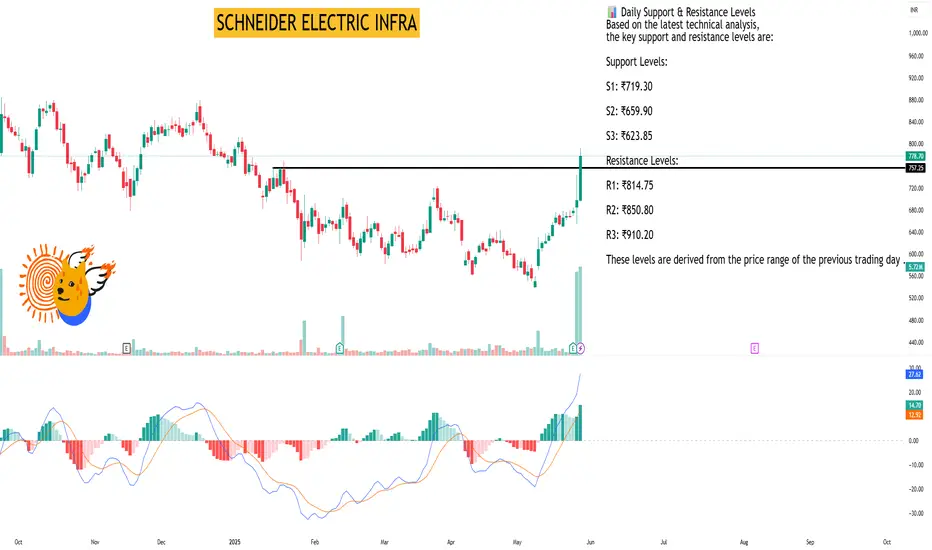
SCHNEIDER ELECTRIC INFRAAs of May 29, 2025, Schneider Electric Infrastructure Ltd. (NSE: SCHNEIDER) is trading at ₹778.70, reflecting an 11.57% increase over the past 24 hours .
📊 Daily Support & Resistance Levels
Based on the latest technical analysis, the key support and resistance levels are:
Support Levels:
S1: ₹719.30
S2: ₹659.90
S3: ₹623.85
Resistance Levels:
R1: ₹814.75
R2: ₹850.80
R3: ₹910.20
These levels are derived from the price range of the previous trading day .
🔍 Technical Indicators Overview
Relative Strength Index (RSI): 79.38 – Indicates overbought conditions.
MACD (12,26): 27.62 – Suggests bullish momentum.
ADX: 28.53 – Points to a strong trend.
Stochastic Oscillator: 90.63 – Suggests overbought territory.
Rate of Change (ROC): 25.57 – Indicates strong upward momentum.
Supertrend: 634.53 – Below current price, indicating bullish trend.
Parabolic SAR (PSAR): 646.47 – Below current price, supporting bullish sentiment.
These indicators collectively suggest a strong bullish trend for Schneider Electric Infrastructure Ltd. .
📈 Market Sentiment
The technical indicators collectively suggest a strong bullish sentiment for Schneider Electric Infrastructure Ltd. However, the RSI and Stochastic Oscillator indicate that the stock is in overbought territory, which may lead to a short-term correction. Investors should monitor the support and resistance levels closely for potential breakout or pullback scenarios.
Please note that stock market investments are subject to market risks, and it's essential to conduct thorough research or consult with a financial advisor before making investment decisions.
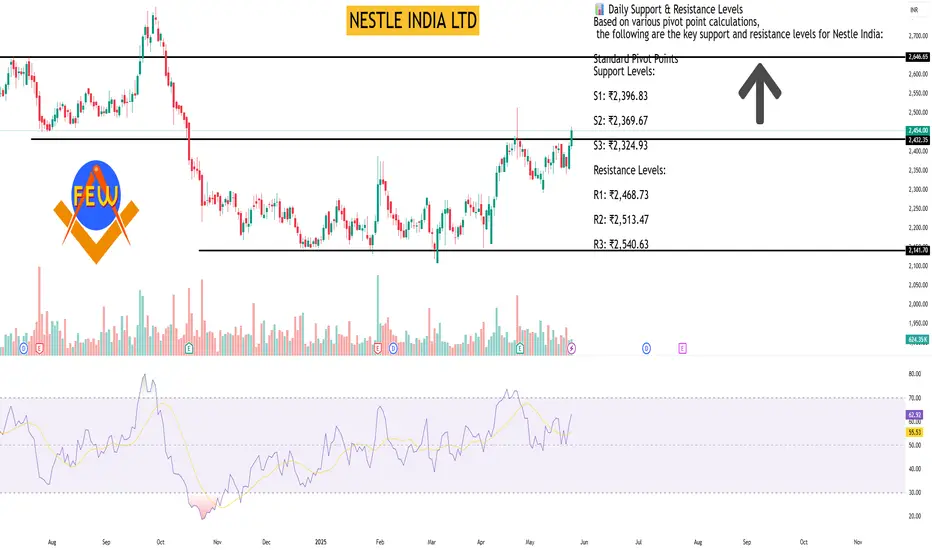
NESTLE INDIA LTDAs of May 26, 2025, Nestle India Ltd. (NSE: NESTLEIND) closed at ₹2,451.00, marking a 1.52% increase from the previous day. The stock's intraday range was between ₹2,405.40 and ₹2,464.90.
📊 Daily Support & Resistance Levels
Based on various pivot point calculations, the following are the key support and resistance levels for Nestle India:
Standard Pivot Points
Support Levels:
S1: ₹2,396.83
S2: ₹2,369.67
S3: ₹2,324.93
Resistance Levels:
R1: ₹2,468.73
R2: ₹2,513.47
R3: ₹2,540.63
Fibonacci Pivot Points
Support Levels:
S1: ₹2,396.83
S2: ₹2,369.37
S3: ₹2,352.40
Resistance Levels:
R1: ₹2,424.30
R2: ₹2,441.27
R3: ₹2,468.73
Camarilla Pivot Points
Support Levels:
S1: ₹2,407.81
S2: ₹2,401.22
S3: ₹2,394.63
Resistance Levels:
R1: ₹2,420.99
R2: ₹2,427.58
R3: ₹2,434.17
📈 Technical Indicators Overview
Relative Strength Index (RSI): 70.998 — approaching overbought territory.
MACD (12,26): 17.89 — bullish crossover.
Stochastic Oscillator (9,6): 85.134 — overbought.
Average Directional Index (ADX): 56.86 — indicating a strong trend.
Moving Averages: The stock is trading above its 5-day (₹2,454.78), 10-day (₹2,436.91), 20-day (₹2,405.42), 50-day (₹2,397.91), 100-day (₹2,374.14), and 200-day (₹2,381.37) simple moving averages, suggesting a strong upward momentum.
🔍 Summary
Nestle India Ltd. is exhibiting strong bullish momentum, trading above key support levels and moving averages. However, technical indicators like RSI and Stochastic Oscillator suggest that the stock is nearing overbought conditions. Investors should monitor these levels closely for potential pullbacks or consolidations.
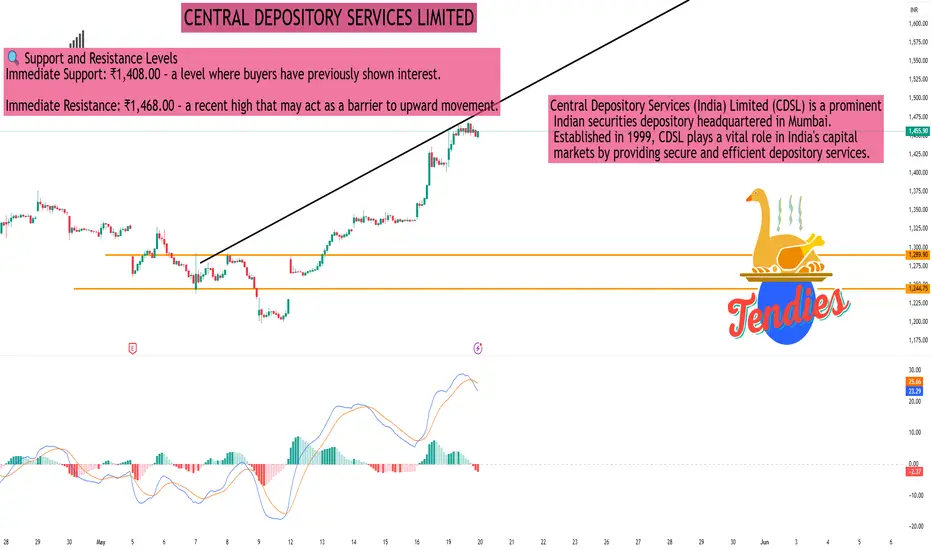
CENTRAL DEPOSITORY SERVICES LIMITEDAs of the close on Monday, May 19, 2025, Central Depository Services (India) Ltd (NSE: CDSL) was trading at ₹1,450.80, marking a 2.98% increase from the previous session.
📊 30-Minute Timeframe Technical Overview
Price Action:
Day's Range: ₹1,408.00 – ₹1,468.00
52-Week Range: ₹1,047.45 – ₹2,989.00
Volume: Approximately 9.5 million shares traded, indicating heightened market activity.
Technical Indicators:
Relative Strength Index (RSI): 69.89 – approaching overbought territory, suggesting caution.
Moving Average Convergence Divergence (MACD): 36.23 – indicating bullish momentum.
Average Directional Index (ADX): 16.44 – suggesting a weak trend strength.
Stochastic Oscillator: 80.92 – in the overbought zone, which may precede a price correction.
Indicator: ₹1,280.03 – acting as a support level.
Parabolic SAR (PSAR): ₹1,209.57 – indicating an upward trend.
🔍 Support and Resistance Levels
Immediate Support: ₹1,408.00 – a level where buyers have previously shown interest.
Immediate Resistance: ₹1,468.00 – a recent high that may act as a barrier to upward movement.
🔭 Outlook
The technical indicators suggest that CDSL is experiencing a strong bullish trend. However, the RSI and Stochastic Oscillator indicate that the stock is nearing overbought conditions, which could lead to a short-term consolidation or minor correction. Investors should monitor the support and resistance levels closely and consider the heightened trading volume, which may affect the strength of the current trend.
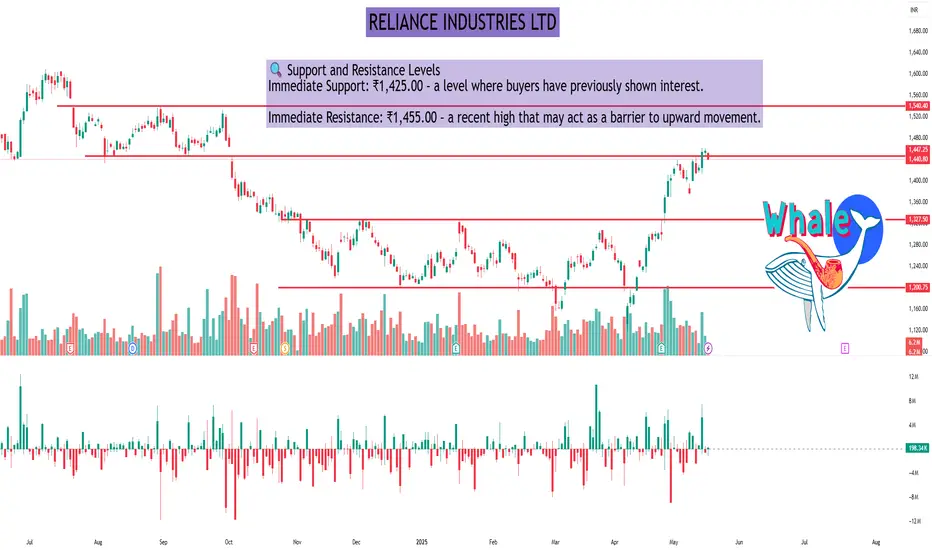
RELIANCE INDUSTRIES LTDAs of the close on Monday, May 19, 2025, Reliance Industries Ltd (NSE: RELIANCE) traded at ₹1,440.80, reflecting a 1.07% decrease from the previous session.
📊 Daily Technical Overview
Price Action:
Opening Price: ₹1,452.10
Day's Range: ₹1,438.20 – ₹1,454.60
52-Week Range: ₹1,114.85 – ₹1,608.80
Volume: Approximately 6.2 million shares traded, below the 50-day average of 8.4 million, indicating reduced market activity.
Technical Indicators:
Relative Strength Index (RSI): 69.84 – approaching overbought territory, suggesting caution.
Moving Average Convergence Divergence (MACD): Bullish crossover, indicating potential upward momentum.
Stochastic Oscillator: 76.17 – in the overbought zone, which may precede a price correction.
Average Directional Index (ADX): Indicates a strong trend, supporting the current price movement.
🔍 Support and Resistance Levels
Immediate Support: ₹1,425.00 – a level where buyers have previously shown interest.
Immediate Resistance: ₹1,455.00 – a recent high that may act as a barrier to upward movement.
🔭 Outlook
The technical indicators suggest that Reliance Industries Ltd is experiencing a strong bullish trend. However, the RSI and Stochastic Oscillator indicate that the stock is nearing overbought conditions, which could lead to a short-term consolidation or minor correction. Investors should monitor the support and resistance levels closely and consider the reduced trading volume, which may affect the strength of the current trend.
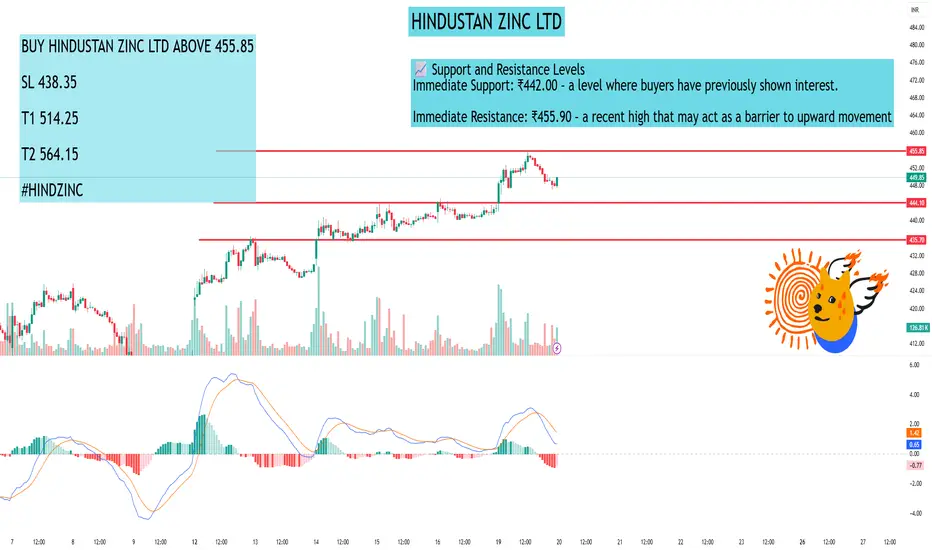
HINDUSTAN ZINC LTDAs of the close on Monday, May 19, 2025, Hindustan Zinc Ltd (NSE: HINDZINC) was trading at ₹448.20, reflecting a 1.33% increase from the previous session.
📊 15-Minute Timeframe Technical Overview
Analyzing the 15-minute chart, the stock exhibits a mild bullish trend:
Price Action: The current price is ₹428.25.
Moving Averages:
The 5-period Exponential Moving Average (EMA) is at ₹440.66.
The 15-period EMA stands at ₹435.01.
The 50-period EMA is at ₹435.91.
The 100-period EMA is at ₹446.19.
The 15-period EMA trending above the 50-period EMA indicates a bullish crossover.
Trend Analysis: The 5 and 15 EMAs are on an upward trajectory, suggesting a mild bullish sentiment in the short term.
🔍 Technical Indicators
Relative Strength Index (RSI): The RSI is approximately 56.70, indicating a neutral momentum without being overbought or oversold.
Moving Average Convergence Divergence (MACD): The MACD is at 0.811, suggesting a bullish crossover.
Average Directional Index (ADX): The ADX is at 13.22, indicating a weak trend strength.
Stochastic Oscillator: The Stochastic Oscillator is at 63.96, pointing to neutral momentum.
Indicator: The supertrend is at ₹406.99, acting as a support level.
Parabolic SAR (PSAR): The PSAR is at ₹400.77, indicating an upward trend.
📈 Support and Resistance Levels
Immediate Support: ₹442.00 – a level where buyers have previously shown interest.
Immediate Resistance: ₹455.90 – a recent high that may act as a barrier to upward movement.
🔭 Outlook
The current indicators suggest a cautious approach:
If the price sustains above ₹442.00, there may be potential for a rebound towards ₹455.90.
Conversely, a drop below ₹442.00 could lead to further declines, possibly testing lower support levels.
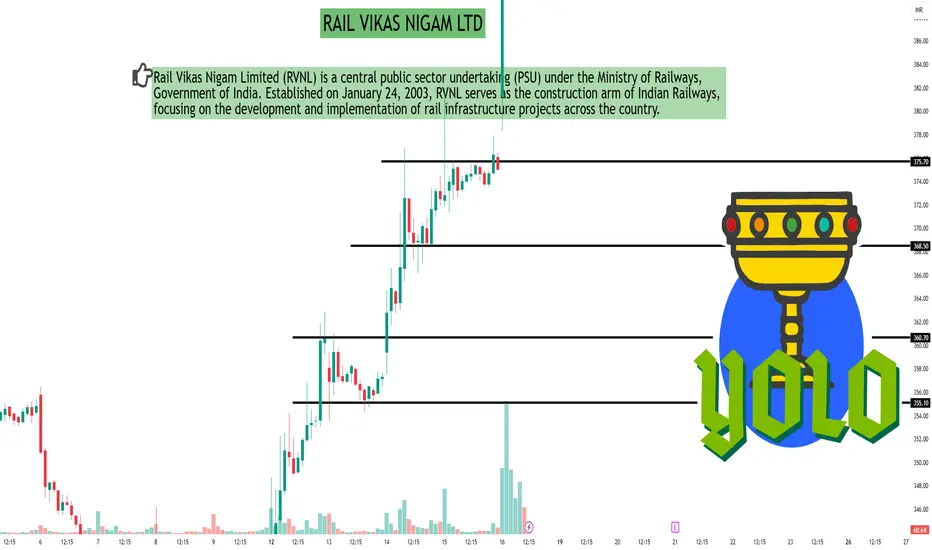
RAIL VIKAS NIGAM LTDAs of May 16, 2025, Rail Vikas Nigam Ltd. (NSE: RVNL) exhibits a bullish trend on the 30-minute timeframe, supported by several technical indicators:
📈 30-Minute Technical Analysis Summary
Current Price: ₹412.45
Relative Strength Index (RSI): 70.92
Indicates overbought conditions, suggesting strong upward momentum.
Moving Average Convergence Divergence (MACD): 2.89
Positive value supports the bullish trend.
Average Directional Index (ADX): 62.56
Reflects a strong trend strength.
Stochastic Oscillator: 78.09
Near overbought territory, indicating strong buying pressure.
Rate of Change (ROC): 0.972
Positive value aligns with upward price movement.
Supertrend: ₹372.14
Below current price, reinforcing the bullish outlook.
Parabolic SAR (PSAR): ₹371.61
Below current price, indicating an uptrend.
Chaikin Money Flow (CMF): 0.216
Positive value suggests buying pressure.
📊 TradingView Technical Summary (30-Minute Timeframe)
On TradingView, the 30-minute technical indicators for RVNL present a Neutral outlook, suggesting a balance between bullish and bearish signals.
⚠️ Trading Considerations
Overbought Indicators:
RSI and Stochastic values suggest the stock is in overbought territory; traders should watch for potential pullbacks.
Support Levels:
Supertrend and PSAR levels around ₹372 may act as support in case of a price correction.
Volume Analysis:
Monitoring volume trends alongside price movements can provide additional insights into the strength of the current trend.
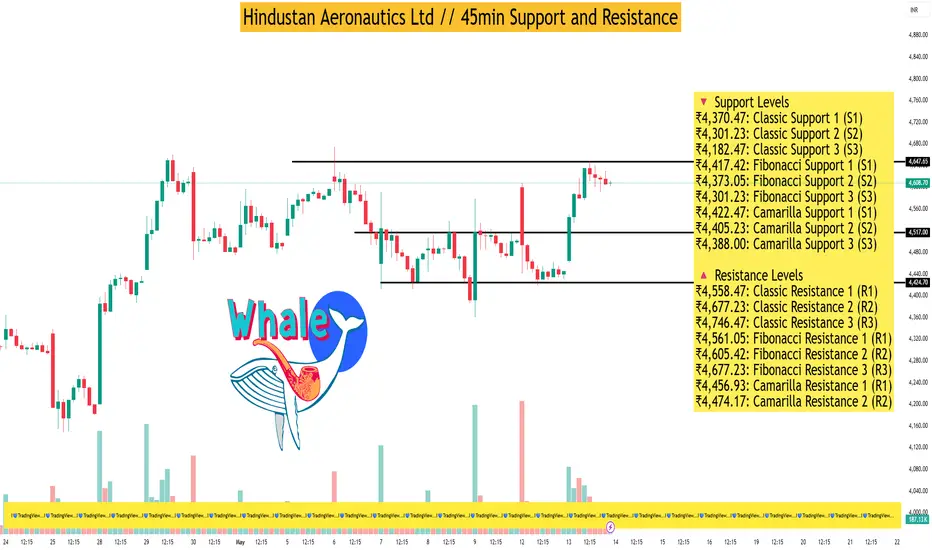
Hindustan Aeronautics Ltd // 45min Support and ResistanceAs of May 13, 2025, Hindustan Aeronautics Ltd (HAL) closed at ₹4,463.80, experiencing a slight decline of 0.668% for the day. Analyzing the 45-minute timeframe, the following support and resistance levels have been identified based on technical indicators and pivot point analyses:
🔻 Support Levels
₹4,370.47: Classic Support 1 (S1)
₹4,301.23: Classic Support 2 (S2)
₹4,182.47: Classic Support 3 (S3)
₹4,417.42: Fibonacci Support 1 (S1)
₹4,373.05: Fibonacci Support 2 (S2)
₹4,301.23: Fibonacci Support 3 (S3)
₹4,422.47: Camarilla Support 1 (S1)
₹4,405.23: Camarilla Support 2 (S2)
₹4,388.00: Camarilla Support 3 (S3)
🔺 Resistance Levels
₹4,558.47: Classic Resistance 1 (R1)
₹4,677.23: Classic Resistance 2 (R2)
₹4,746.47: Classic Resistance 3 (R3)
₹4,561.05: Fibonacci Resistance 1 (R1)
₹4,605.42: Fibonacci Resistance 2 (R2)
₹4,677.23: Fibonacci Resistance 3 (R3)
₹4,456.93: Camarilla Resistance 1 (R1)
₹4,474.17: Camarilla Resistance 2 (R2)
₹4,491.40: Camarilla Resistance 3 (R3)
📊 Technical Indicators Summary
Relative Strength Index (RSI): 44.65 – Neutral
MACD: -4.97 – Bearish
Average Directional Index (ADX): 20.58 – Indicates a weak trend
Stochastic Oscillator: 58.04 – Neutral
Rate of Change (ROC): 1.61 – Slightly bullish
Supertrend: ₹4,540.11 – Current trend indicator
Parabolic SAR (PSAR): ₹4,397.84 – Suggests potential reversal point
These indicators suggest a mildly bearish outlook in the short term, with the stock trading below key resistance levels. The RSI and Stochastic Oscillator indicate a neutral momentum, while the MACD points towards a bearish trend. The ADX value suggests that the current trend lacks strength.
"Bharat Dynamics in High Gear: A Bullish Outlook"Weekly Analysis
>>>Price Movement: The stock closed at ₹1,507.00, up by 6.61% for the week.
>>>Indicators: The 20-day Exponential Moving Average (EMA) is at ₹1,264.23, showing a bullish trend. The Stochastic Oscillator is at 99.73, indicating an overbought condition.
Daily Analysis
>>>Price Movement: The stock showed strong momentum, closing at ₹1,507.00.
>>>Indicators: The daily Stochastic Oscillator is also at 99.73, suggesting the stock is overbought. The Relative Strength Index (RSI) is neutral, indicating a balanced trend.

XAUUSD 1H SELL PROJECTION 08.04.25Instrument: Gold Spot / U.S. Dollar (XAUUSD)
Timeframe: 1 Hour (1H)
Current Price: ~$2,995.25
Projection Date: April 8, 2025
Analysis Type: Bearish/Sell Projection
📊 Technical Elements:
🔹 Trend Analysis:
A 1H downtrend is marked with a descending trendline.
Price previously broke a key support zone, retested it (now acting as resistance), and is expected to drop again.
🔹 Trade Setup:
Entry: Near current price ($2,995.25)
Stop Loss: Above Resistance R1 at $3,010.27
Take Profit Targets:
TP1: At Support S1 (~$2,980)
TP2: At Support S2 (~$2,957)
📈 Indicators:
📍 Stochastic Oscillator (5, 3, 3):
Reading: 79.61 (green) and 80.17 (red)
Interpretation: Just above 80 → Overbought Zone
Signal: Potential reversal downwards
📍 Relative Strength Index (RSI - 14):
Value: 44.84
Interpretation: Below neutral 50, not oversold
Signal: Bearish momentum building
🧠 Conclusion / Strategy:
The chart suggests a short/sell setup for XAUUSD.
The price has retested the broken support (now resistance) and formed a rejection candle at the trendline.
Indicators support a potential downward move (Stochastic overbought + RSI weak).
Targeting lower supports for potential exit points.

SBI Life Insurance (SBILIFE) Swing tradeSBI Life Insurance (SBILIFE) is currently trading at ₹1,546.40, showing a positive change of +3.21%.
Here's a brief technical analysis overview:
Moving Averages : The stock is above its 20-day Exponential Moving Average (EMA), which is at ₹1,492.05. This indicates a bullish trend.
Volume : The trading volume is 5.7 million, with a 20-day average of 7.54 million.
Stochastic Oscillator : The Stochastic indicator suggests potential momentum in the stock.

AVANTIFEED 1:8 RR (3 trade set up)Based on the technical analysis of Avanti Feeds Ltd (AVANTIFEED), the price action shows a positive trend in the short to mid-term:
The stock has broken out of a long-term triangle formation with an Inverted Head & Shoulder pattern, accompanied by strong volume1.
The price is exhibiting a positive breakout from the Keltner Bands, indicating strong bullish momentum2.
The ADX (Average Directional Index) suggests a strong uptrend2.
The Stochastic RSI shows bullish signals, with the indicator rising from oversold levels2.
The stock is trading above its key moving averages, further confirming the bullish trend4.
Short to mid-term price action analysis is described as "definitely positive," indicating a strong uptrend78.
However, it's important to note that some conflicting signals exist:
The MACD shows a bearish crossover, which could indicate potential short-term weakness2.
The Stochastic RSI also shows some bearish divergence in the longer term4.
Overall, the price action analysis for AVANTIFEED appears bullish, with strong momentum and positive breakouts observed across multiple technical indicators.

Epl ltd Long on monthly timeframeEPL Ltd., formerly known as Essel Propack Ltd., is a leading global manufacturer of laminated plastic tubes, serving industries such as pharmaceuticals, cosmetics, and food. Here's a detailed analysis of EPL Ltd.'s stock performance on a monthly timeframe:
**Stock Performance:**
- **Current Price:** As of February 14, 2025, EPL Ltd.'s share price is ₹251.92.
- **Monthly Return:** Over the past month, the stock has appreciated by 5.03%.
- **52-Week Range:** The stock has traded between ₹169.85 and ₹289.70 over the past year, indicating significant volatility.
**Technical Analysis:**
- **Moving Averages:** The stock is currently trading above its short-term moving average, suggesting a bullish trend. However, the long-term moving average remains above the short-term average, indicating a general sell signal.
- **Stochastic RSI:** The Stochastic RSI indicator is in a neutral zone, with readings between 55 and 80 indicating a bullish condition.
**Valuation Metrics:**
- **Price-to-Earnings (P/E) Ratio:** The P/E ratio stands at 30.07, suggesting the stock is trading at a premium compared to the industry average.
- **Price-to-Book (P/B) Ratio:** The P/B ratio is 3.75, indicating the stock is valued at approximately 3.75 times its book value.
- **Dividend Yield:** EPL Ltd. offers a dividend yield of 1.79%, reflecting a commitment to returning value to shareholders.
**Analyst Insights:**
- **Price Target:** Analysts have set a price target of ₹316 for EPL Ltd., indicating a potential upside of approximately 25% from the current price.
- **Analyst Ratings:** The stock holds a "Buy" rating from analysts, reflecting positive sentiment towards its future prospects.
**Recent Developments:**
- **Earnings Growth:** In the quarter ending September 2024, EPL Ltd. reported a net profit of ₹87 crore, marking a 72.28% increase compared to the same period last year.
- **Dividend Declaration:** The company declared a dividend of ₹2.50 per share in November 2024, translating to a dividend yield of 1.95%.
**Conclusion:**
EPL Ltd. has demonstrated strong financial performance, with significant earnings growth and a commitment to shareholder returns through dividends. The stock is trading at a premium valuation, supported by positive analyst ratings and a favorable price target. Investors should consider these factors when evaluating EPL Ltd. as a potential investment.

Banswara Syntex Ltd.Banswara Syntex Ltd. (NSE: BANSWRAS) is currently exhibiting a **Neutral** technical outlook on the monthly timeframe.
**Technical Indicators:**
- **Relative Strength Index (RSI):** The 14-day RSI stands at 53.81, indicating a neutral market sentiment. citeturn0search5
- **Moving Averages:** The stock is trading below its 50-day simple moving average (SMA) of ₹144.23 and above its 50-day exponential moving average (EMA) of ₹139.63, suggesting a mixed trend. citeturn0search5
- **MACD (Moving Average Convergence Divergence):** The MACD value is -2.43, which is below the signal line, indicating a bearish momentum. citeturn0search5
- **Stochastic Oscillator:** The Stochastic Oscillator is at 68.59, suggesting a neutral market condition. citeturn0search5
**Support and Resistance Levels:**
- **Support:** The stock has support at ₹127.62. citeturn0search5
- **Resistance:** The resistance level is at ₹137.67. citeturn0search5
**Conclusion:**
Banswara Syntex Ltd. is currently in a neutral technical position on the monthly timeframe, with indicators suggesting neither strong bullish nor bearish momentum. Investors should monitor these indicators closely, as a breakout above resistance levels could signal a bullish trend, while a drop below support levels might indicate a bearish move. It's advisable to consider these technical factors alongside fundamental analysis and broader market conditions when making investment decisions.

#bls international #BLS PERFECT REVERSAL CANDIDATE
BLS International Services Ltd. (NSE: BLS) is currently exhibiting a **Neutral** technical outlook, with indicators suggesting neither strong bullish nor bearish momentum.
**Technical Indicators:**
- **Relative Strength Index (RSI):** The 14-day RSI stands at 35.13, indicating a neutral market sentiment. citeturn0search4
- **Moving Averages:** The stock is trading below its 5-day, 10-day, 20-day, and 50-day simple and exponential moving averages, suggesting a bearish trend. citeturn0search4
- **MACD (Moving Average Convergence Divergence):** The MACD value is -10.94, which is below the signal line, indicating a bearish momentum. citeturn0search4
- **Stochastic Oscillator:** The Stochastic Oscillator is at 16.70, suggesting a buy signal. citeturn0search4
**Support and Resistance Levels:**
- **Support:** The stock has support at ₹389.87. citeturn0search4
- **Resistance:** The resistance level is at ₹448.87. citeturn0search4
**Conclusion:**
BLS International Services Ltd. is currently in a neutral technical position, with indicators suggesting neither strong bullish nor bearish momentum. Investors should monitor these indicators closely, as a breakout above resistance levels could signal a bullish trend, while a drop below support levels might indicate a bearish move. It's advisable to consider these technical factors alongside fundamental analysis and broader market conditions when making investment decisions.

Crisil Ltd.CRISIL Ltd. (NSE: CRISIL) is currently exhibiting a **Neutral** technical outlook, as indicated by various technical analysis indicators.
**Technical Indicators:**
- **Relative Strength Index (RSI):** The 14-day RSI stands at 38.43, suggesting a neutral market sentiment. citeturn0search3
- **Moving Averages:** The stock is trading below its 5-day, 10-day, 20-day, and 50-day simple and exponential moving averages, indicating a bearish trend. citeturn0search3
- **MACD (Moving Average Convergence Divergence):** The MACD value is -124.85, which is below the signal line, suggesting a bearish momentum. citeturn0search3
- **Stochastic Oscillator:** The Stochastic Oscillator is at 38.63, indicating a neutral market condition. citeturn0search3
**Support and Resistance Levels:**
- **Support:** The stock has support at ₹4,996.55. citeturn0search3
- **Resistance:** The resistance level is at ₹5,455.40. citeturn0search3
**Conclusion:**
CRISIL Ltd. is currently in a neutral technical position, with indicators suggesting neither strong bullish nor bearish momentum. Investors should monitor these indicators closely, as a breakout above resistance levels could signal a bullish trend, while a drop below support levels might indicate a bearish move. It's advisable to consider these technical factors alongside fundamental analysis and broader market conditions when making investment decisions.

Crude OilLet's break down the trend and reversal analysis of this chart:
### 1. Trend Analysis:
- **Uptrend:** As seen in the chart, prices form higher lows (HL), indicating an upward movement over time. Higher lows suggest that buyers are gaining strength at each dip.
- **Downtrend:** Conversely, the presence of lower highs (LH) points to a downward trend where sellers dominate, causing prices to decline with each rally.
### 2. Reversal Signals:
- **Stochastic Oscillator:** This tool helps identify overbought (82.60) and oversold (73.03) conditions. When the oscillator crosses above or below these levels, it can signal possible price reversals.
- **Candlestick Patterns:** Notice the formations around higher lows and lower highs. These patterns can provide clues to potential reversals. For example, long wicks indicate price rejection at certain levels, hinting at a change in direction.
### 3. Key Levels:
- **Resistance Levels:** Prices often struggle to break above certain points, known as resistance. In this chart, the high around 79.44 USD could act as a resistance level.
- **Support Levels:** Similarly, prices tend to find support at lower levels like 64.74 USD, where buyers step in to prevent further decline.
To sum it up, this chart indicates that the WTI Crude market experiences alternating trends, with periods of upward (higher lows) and downward (lower highs) movements, while key indicators (stochastic oscillator and candlestick patterns) provide insight into potential reversals.
Feel free to ask if you'd like to dive deeper into any specific aspect!

EURUSD Let's dive into the analysis of this EUR/USD trading chart. Here's what I'm seeing:
1. **Price Action**: The main chart displays the daily price movements of the EUR/USD currency pair. The candlesticks reflect the opening, closing, high, and low prices for each day.
2. **Downtrend**: There are purple dashed trendlines forming a downward channel, indicating a bearish trend. The "Lower Highs" (LH) annotations confirm this bearish sentiment.
3. **Volume**: The volume bar chart below the price chart shows the trading volume for each day. Higher volume bars on down days can confirm bearish pressure.
4. **Stochastic Oscillator**: This indicator at the bottom shows that the blue line is at 42.89 and the orange line is at 41.22. These values suggest that the market is neither overbought nor oversold but is closer to the middle range.
5. **Key Price Levels**:
- **Current Price**: 1.02881, with a slight decrease of 0.08%.
- **High**: 1.12138
- **Low**: 1.01694
- **Bid**: 1.02879
- **Ask**: 1.02886
6. **Highlighted Area**: The green and red boxes highlight a potential trade setup, with suggested entry, stop-loss, and take-profit levels. This setup could be a good opportunity if you believe the bearish trend will continue or reverse.
Overall, the chart suggests a bearish trend with some potential trading setups. Keep an eye on the volume and stochastic oscillator for signs of any potential reversals. If you need any more detailed analysis or have questions about specific parts of the chart, feel free to ask!

Analysis of the latest trend of gold market:
🎗️Analysis of gold news: In the early Asian session on Thursday (December 12), the price of gold rose and fell. Spot gold is currently trading around $2,716/ounce. The price of gold rose by more than $20 on Wednesday, the fourth consecutive trading day of increase. The highest intraday price hit $2,720.98/ounce, just slightly lower than the one-month high of $2,721.21/ounce on November 25; the inflation data released earlier was in line with expectations, increasing the possibility of the Federal Reserve cutting interest rates next week, while investors are waiting for the U.S. Producer Price Index (PPI) data to provide further direction for monetary policy. In addition to the U.S. PPI data, the changes in the number of initial jobless claims in the United States will also be released on this trading day, which investors need to pay attention to. In addition, it is necessary to pay attention to news related to Trump and news related to geopolitical acceleration.⭕
🎗️Gold technical analysis: Yesterday, gold technically stabilized at 2686 after repeated suppression and shock below the 2700 mark in the Asian and European sessions, ushering in a strong bullish bottoming out and rebounding to close above the high. The US gold price continued to break through and stood above the Asian session high of 2704 and continued to rise to 2720 to close with a strong medium-sized positive. The overall gold price has formed a bullish unilateral upward trend for three consecutive trading days, and is only one step away from the previous high of 2740 in the short term. There is a high probability that the upward momentum will continue today.⭕
🎗️In terms of the shape of the daily K-line chart, gold shows a trend of continuous positive rise, but the current pressure at the 2720 position is more obvious. This pressure mainly comes from two aspects. One is the horizontal pressure position formed during the previous decline, and the other is the upper track pressure position of the BOLL indicator.⭕
🎗️From the indicator point of view, the stochastic indicator shows a golden cross upward state, releasing a signal of main long and upward operation. Looking at the 4-hour chart again, the stochastic indicator continues to maintain a golden cross, which is a bullish signal. From the perspective of form, it presents a continuous slow rise form, which is also a bullish form. At present, in this slow bullish rise trend, the short-term support position is around 2700, and further support is around 2686. The intraday retracement relies on this position to continue to be bullish.⭕
🎗️Trading strategy:
On the whole, I suggest that the short-term operation of gold today is mainly long on the pullback, and the rebound is supplemented by high shorts. The short-term focus on the upper side is the 2730-2735 line of resistance, and the short-term focus on the lower side is the 2700-2695 line of support.⭕

How do Indicators Work in Trading?Trading indicators are essential tools that help traders analyze market trends and make better decisions.
By using historical price data and various mathematical formulas, these indicators provide insights into market conditions and potential future movements.
Whether you are tracking moving averages, measuring volatility with Bollinger Bands, or assessing momentum with the RSI, each of these indicators has its own advantages.
This article provides an overview of how trading indicators work and effective ways to use them for making trading decisions.
What Are Trading Indicators?
Trading indicators are tools used by traders to make informed decisions when analyzing and interpreting financial market data.
They are mathematical calculations based on historical price, volume, or open interest data, and they generate visual signals or patterns on trading charts.
These indicators can reveal trends, momentum, volatility, and market strength, assisting traders in predicting future price movements.
Commonly used types include moving averages that display the average price over a specific period of time and Relative Strength Index (RSI) that assesses how quickly and dramatically prices change.
Through comprehending and applying these indicators, traders can improve their market analysis and trading strategies.
How Do Indicators Work?
The truth is that trading indicators don't actually 'work' in the sense of predicting future prices. Instead, they reflect the market's psychology, showing how current prices compare to past ones, which can guide traders. When combined with candlestick patterns, these tools can help shape your technical analysis strategy.
For instance, indicators can suggest where to place a stop-loss order to minimize risk when closing a trade.
Using trading indicators is particularly valuable if you want to keep emotions out of your trading decisions or avoid being influenced by others' opinions.
Types of Trading Indicators
Traders use various types of trading indicators to analyze market trends and make informed decisions. Here are some of the most popular trading indicators:
1. Trend Indicators
Trend indicators help traders to recognize the intensity and direction of trends in a market. This helps them know whether a particular asset is in an uptrend, a downtrend, or moving sideways.
Common examples include Moving Averages (MA) and Moving Average Convergence Divergence (MACD). Moving Averages smooth out price data over a specified period, making it easier to spot the trend direction. MACD, on the other hand, shows the relationship between two moving averages, signaling potential trend changes.
These indicators are crucial for traders to align their strategies with the prevailing market direction and optimize their entry and exit points.
2. Momentum Indicators
Momentum indicators measure the speed or velocity of price movements to identify overbought or oversold conditions. They help traders gauge the strength of a price trend and anticipate potential reversals.
Examples of these indicators are: the Relative Strength Index (RSI) and the Stochastic Oscillator.
The RSI measures the size of recent gains versus recent losses to show if an asset is overbought or oversold. The Stochastic Oscillator compares a closing price to its price range over a specific period, also identifying overbought or oversold levels.
These indicators are essential for traders to assess market momentum and make informed trading decisions.
3. Volatility Indicators
Volatility indicators measure the rate of price fluctuations over a given period, helping traders understand market conditions.
Common examples are Bollinger Bands and Average True Range (ATR).
Bollinger Bands consist of a middle band (simple moving average) and two outer bands (standard deviations), indicating volatility levels and potential price reversals.
ATR gauges market volatility by averaging the true range over a set period. The true range includes the highest minus the lowest price of the current period, the absolute difference between the current high and the previous close, and the absolute difference between the current low and the previous close.
These indicators help in assessing market risk and potential price movements.
4. Volume Indicators
Volume indicators analyze trading activity to confirm price movements' strengths or weaknesses. By examining the volume of trades, these indicators reveal whether market participants support a price trend.
Common examples include On-Balance Volume (OBV) and the Volume Oscillator. OBV tracks buying and selling pressure by adding the volume on days when prices go up and subtracting it on days when prices go down. The Volume Oscillator compares two moving averages of volume to gauge trend strength.
These indicators help traders identify potential trend reversals, validate price movements, and make more informed trading decisions based on the activity behind price changes.
Conclusion
Trading indicators are powerful tools that can significantly improve your trading strategy. By providing valuable insights into market trends and conditions, they help traders make more informed decisions.
While it's important to understand their limitations, combining different indicators and customizing them to your trading style can lead to better results.

🔥GOLD TREND ANALYSIS FOR NEXT MONDAYThe gold market experienced a sharp correction ahead of Friday's close. The price retreated significantly from the high of $2,431, eventually settling at $2,343 levels by the end of the trading day. This change is influenced by many factors. On the one hand, the overheating trend of the US Consumer Price Index (CPI) shows that inflationary pressure still exists, which has put certain pressure on market sentiment. On the other hand, the speeches of hawkish officials from the Federal Reserve further strengthened the market's expectations for the trend of the US dollar, pushing the US dollar exchange rate to break through the 106 mark. In addition, the escalation of tensions in the Middle East still poses a threat to the market, and its potential impact cannot be ignored. Overall, the market is highly volatile, and investors should remain cautious and pay close attention to market dynamics.
In the short term, the price of gold began to rise continuously after trading sideways near 2380, broke through the high of 2400 during the US trading period, and continued to climb strongly to around 2431. However, unexpectedly, the price of gold fell sharply in the evening, falling by as much as $100. While we know the market may have peaked, it is difficult to determine where the top will be because we cannot accurately assess the market's risk aversion. However, the market peak usually meets three conditions: accelerated rise, accelerated decline and continued decline. This bull market started at 1810, jumped short and opened high, and failed to cover the gap between 1810-1830, and then continued to rise. It dates back to two years ago during the Russo-Ukrainian war.
At present, the overall performance of the gold market is that the daily K-line rises and falls, forming a strong downward trend of single Yin, and driving the weekly K-line to form a shooting star, which appears to be very strong. The stochastic indicator changes from a second golden cross to a dead cross. In the short term, you can consider following the daily K-line's dead cross for short positions. However, Friday's sharp decline caught people off guard and could lead to a lower opening or continuation of the decline next Monday.
On the 4-hour chart, the third stage of divergence is highlighted. The stochastic indicator has formed a dead cross and is biased toward the short side. The lower track support is near 2318. This is the only long position that can be considered next week. On the whole, the short-term gold operation advice next Monday is mainly to go short on rebounds, supplemented by longs on callbacks. The top should focus on the 2360-2365 resistance range in the short term, and the bottom should focus on the 2318-2315 support range.

BANKNIFTYWe can see strong support and also just based on stochastic its a buy but suggested buy point is 45350 and above and if market has gaps like opening at 45500 have to wait and see can it resist till 45600.
This are the important levels which needs to be followed.
The indicator which is seen it all based on stochastic and nothing fancy.
Happy Trading.
Good luck.
