Silver Futures (CFD)Silver closed above 40 ema in daily time frame in trading session of day before yesterday, it automatically confirms that the silver has completed a complex correction recently, now there is a good chance that a major bottom is done.
Silver can possibly make a move towards north direction in the forthcoming trading sessions, as per price we can say towards $24.89 which is the high of wave X and coincidently it is also top of current rising channel.
on the way down, or in the worst scenario, the 20 day simple moving average and the lower end of the channel which around coincide around $22.62, will be the crucial support level to watch out for.
fib key levels for target and whole scenario
macd in weekly
macd in daily positive and uptick
rsi in weekly uptick
stochastic in weekly
stochastic in daily
Most investors treat trading as a hobby because they have a full-time job doing something else. However, If you treat trading like a business, it will pay you like a business. If you treat like a hobby, hobbies don't pay, they cost you...!
Disclaimer
i am not sebi registered analyst
my studies are for educational purpose only
please consult your financial advisor before trading or investing
Search in ideas for "stochastic"

HINDALCO INDSHindalco stock has made double top on hourly time frame along with bkt , bearish hidden divergences rd in rsi, macd, stochastic etc, we are having bearish bias in this stock, one can go short at these levels or on rise ( if any ) with stoploss of 486, all the key levels are mentioned on chart along with stoploss and targets.
key levels are mentioned on chart along with stoploss and targets
wave structure could be like this
macd in daily in negative croosover
macd in hourly started down tick
rsi in hourly below 60 now
dmi are converging in hourly
Bearish RD in rsi in hourly
Bearish RD in macd in hourly
Bearish RD in stochastic in hourly
BKT
Disclaimer
I am not sebi registered analyst
My studies are for educational purpose only
Consult your financial advisor before trading or investing

Hero Motor Corp - Inverted Flag Pattern - ShortHi Friends,
Pranam!!!
We are going to analysis the techincal part of Hero Motor Corp!!
Weekly TF:
In weekly TF the script was breaked the previous Market Structure of Uptrend and formed a Lower High and Lower Lows
The script was in support at 2724-2800 and weekly resistance will be 3154-3216
Daily TF:
In Daily TF the script was in the downtrend and EMA200 was Flat, Which denotes trend either can turn bullish or continue to be the bearish.
The dynamic support was around 2823-2850 and the script was holding in the dynamic support range.
MACD of daily was exhausting and weekly its was Flat in the volaitility.
In 2hr TF the MACD was in bearish.
Stochastic RSI of Daily and Weekly was in Overbought range which support the current downtrend
In 2hr TF the stochastic was in the oversold range.
In Daily TF the CPR was currently in the narrow and script was braked above the CPR and was retraced to the R1 of the CPR
CPR was currently in bearish bias
In daily TF the candlestick pattern near in the resistance evidence as evening star which is bearish in nature.
In the script was in the downside and inverted Flag pattern was also evidence in the script
ATR Volatility in Daily TF was Flat, in Weekly TF down and in 2HR tf it was in the Average.
Based on the above, we conclude that the script of Heromotocorp was in the bearish.
Entry:
In Lower TF of 2hr the script was evidencing in the bear Flag Pattern which consitute in line with the trend.
Enty:
Breakout with Bearish Confirmation along with StochRSI reaches and retrace to below 80 or
For Risk traders Sell now or at top of the Channel Pattern(drawn in blue)
SL - 2895 - 1ATR of Daily ATR ( if near Channel TOP) or
SL - After Breakout is Previous candle High - 1ATR.
If you like our analysis press the thumbup and support us.

Coal India Ltd - Inverted H&S Pattern - LongHi Friends,
Pranam!!
We are now going to analysis the technical part of Coal India Ltd!!!
Weekly TF:
The script was in the consolidation phase for the past 1.5 years.
The script was near the dynamic resistance of EMA50-EMA79 at 142-150.
Daily TF:
The script was in the uptrend and trendline constitute the same.
The script has taken the dynamic support of EMA50-EMA79.
Resistance was braked at 141-146.
CPR was daily TF was in the bearish bias and average cpr.
CPR was braked out.
MACD for the script as in the Bullish side and Weekly MACD was flat.2hr TF was in the overbought zone of the MACD and bullish was in the weaker side.
Stochastic RSI of daily TF was in the overbought zone.
Whereas the Weekly and 2HR TF was above 50 zone.
ATR Volatility was Flat in Daily, Weekly and 2HR TF.
Pattern:
In 2hr TF the script was formed Inverted H&S Pattern and neckline of the Head and Shoulder was braked out.
Also the script was broken the trendline and retested the same which took as the support.
Based on the above we conclude that Coal India was in the Bullish View and its right investment for Long Term aspect.
Entry for Short-term:
Wait for the pullback to EMA50-EMA79 zone with stochastic RSI of 2hr to come to oversold area and retrace above 20.
SL - 141-1ATR of Daily
Target - 164
If you like our analysis give us a thumbsup.

CEAT LTD - Descending Triangle Pattern - ShortHi Friends,
Greetings from Thenali Views,
We are now going to analysis the CEAT LTD..
The script has formed a descending triangle pattern where lower highs and lower lows are formed where the script has strong support at the range of 1268-1276.
The script was also forming a H&S Pattern in the support zone. As per our analysis the right shoulder will be formed at the range of the Dynamic Support of EMA50 to EMA79.
Stochastic RSI was in the oversold range in 2hr, Daily and Weekly TF. We can have glance to wait for entry till the script was break the support or triangle pattern.
MACD was also in the bearish or oversold range in 2hr, Daily and Weekly TF.
CPR was bullish bias compared to last month, but still the script brakes below the CPR and Support1 of the CPR.
ATR volatility was FLAT which tells us that the huge potential brake out was near.
Based on the above.
We conclude that the CEAT was in the Downtrend and We can have look for Shorting the script if it reaches in the range of dynamic S&R when price rejection pattern found, where the risk to reward will be higher. Also the confluence to that the descending triangle and H&S pattern was evidence at the downtrend.
Entry at Area of Value - Either at the EMA50 to EMA79 or Brake out of the support
SL = Based on the Trade Setup - 1ATR.
Triangle Pattern:
H&S Pattern:
Stochastic RSI:
MACD:
CPR:
ATR:

CDSL - Long - Falling Wedge PatternHi Friends,
We are going to analysis script CDSL.
CDSL was forming in a Falling Wedge Pattern and where the script was currently in the Dynamic Support EMA50 and EMA79 Range.
And it was retested the Support Level of 1101 and retraced. As per the FIB Channel level it was in the 61.8 retracement level.
Now the script retracement move was completed and it like to move high.
Stochastic RSI of Daily TF and Weekly TF are in the Oversold Range
MACD in Daily TF and 2HR TF was in the Low range and Weekly TF was in the High.
CPR was in the Bullish Bias and Price in near the support of the CPR.
Volatility was High as per the ATR.
Pattern was Bullish Flag or Falling Wedge .
Based on the above, we are bullish on the script.
Buy: CMP
SL: 1102 - 1ATR
Target: 1575 + Up on Which Trail Your SL based on the trend.
FIB Channel:
Stochastic RSI:
MACD:
CPR:
ATR:

ITC - Explosive Breakout is need to be witness Hi Friends,
We are now going analysis the ITC Ltd!!!
ITC was in the consolidation phase for more than 9 Months.
Let Analysis the possibilities:
1. Script was in the consolidation phase.
2. Script Volatility was being Flat.
3. Script was in the descending triangle pattern
4. EMA 200 was flatten from downtrend
5. MACD in Hightime frame i.e. Weekly was flat.
6. Stochastic RSI in Daily and 2HR time was in Oversold region. In weekly TF it was nearing Oversold Region
7. The script was in the Support Zone with Strong Buildup.
Overview:
As per our analysis, the script breaks the Triangle pattern . The script may witness the huge move.
As per our though we call this script will be brakes in bullish side.
Hence, we can go Long once the breakout happens with small quantity and once pull back (like Bull Flag etc) or Retest we can add the script (For Conservative People)
For Aggressive and for good Risk to reward:
We can go Long now with value of 199-203
SL - 199 - 1ATR.
EMA
Stochastic RSI
ATR
MACD:
Consolidation Phase:
If like our idea, Like us and support us.

Daawat (LTFOODS) - Inverted H&S Shoulder Pattern - LongHi Friends,
Pranam!!!
We are now going to analysis the technical analysis of DAAWAT (L.T.Foods Ltd)
Trend of the script was in the uptrend- weaker side and its take the support of the EMA200.
The script has taken the support on the weekly TF at 61-64 Range.
Price Rejection was evidence near Support. Also the dynamic support was taken.
In Daily TF the script was in the strong support zone of 61-63 where the price was also the Higher TF Support.
The script has strong resistance at 72.50-73.50 and 82-84. The script was also taken the support at the trendline at 61.65
In Daily TF, the CPR was bearish bias and the CPR was acting as resistance level.
The stochastic RSI was in the near overbought zone in Daily TF and Overbought and 2HR TF and Oversold range in Weekly TF.
MACD lines are also in the bearish wing which near flat in daily and 2hr TF. Whereas in weekly TF, it in the glimpse of the bearishness.
ATR Volatility in the daily TF and 2hr TF was Flat.
In 2hr TF:
The script was formed in the Inverted Head and Shoulder Pattern formed with a Buildup and ATR was in down.
The script was above the CPR and Hourly CPR will be in the Bullish Bias.
Trend in the 2hr TF was in the Downtrend, but trend might changed due to retracement candle are getting bigger in 2HR and based on the above long-term trend was also in the uptrend correction phase.
Elliot Wave pattern was near completion corrective phase.
Overall, we conclude that LT Foods or DAAWAT on Bullish Note.
Entry - CMP (enter when stochastic RSI of 24 come below and retrace above 20)
SL - 66.05 - 1ATR ( Based on 2hr TF or Long-term use Daily TF ATR)
Target - 72.75
If like our analysis kindly press the thumb-up and do follow us.

CIPLACipla,
this stock tested weekly lower bollinger band and bounced back sharply recently, also positive crossover has done in the weekly oscillator stochastic indicator.
the wave structure suggests that it is in a larger degree wave 3 which is getting subdivided.
within wave 3, the stock has completed wave I and II and it is currently in wave III of 3, as wave III unfolds , the stock can posiibly rise higher towards 1120.
one can go long at these levels or in dips ( if any ) with stoploss of last swing low 886.
Wave structure
key levels are mentioned on chart
weekly stochastic turned positive
weekly rsi uptick near 60
bollinger and price action in weekly
bollinger and price action in daily
Disclaimer
I am not sebi registered analyst
My studies are for educational purpose only
Consult your financial advisor before trading or investing

Reliance Industries Ltd - Inverted H&S Pattern - LongHi Friends,
Pranam to All!!
The script we are going to analysis is Reliance Industries Ltd..
In Daily TF the script has formed a Inverted H&S Pattern. The trend was in uptrend as per EMA200 as which the pattern was more valid one.
RIL was in the consolidation phase for more than a 9 months. The script was traded in a range bound where the now market structure was forming at Higher Highs and Higher Lows.
The script has strong resistance at 2272 - 2225 and Support at 2063 - 2024 and 1896 - 1838
Also the H&S Neckline will act as resistance for the script.
The script has more than 100 Bars for forming Inverted H&S Pattern.
Moreover, MACD was in the flat range as the volatility was shrinking.
ATR also evidence the Volatility was shrinking.
The script has Dynamic S&R at 2105-2125.
Stochastic RSI was in the oversold range.
CPR was in the bearish bias comparted to last month CPR.
Based on the above, Our advise we can go Bullish once the Pullback came at range of 2130-2100 as we have higher risk to reward.
Entry based on Pullback or brake out
SL - Below Right shoulder - 1 ATR
Target - Height of the Head and Trail your SL.
Chart Pattern:
MACD:
Dynamic Support:
ATR:
CPR:
Stochastic RSI:
Trend as EMA200:

Crude Oil - Short term trend was Bearish Hi Friends,
Crude Oil Positional Trade . The Crude oil was in Downtrend forming Lower Highs and Lower Lows.
Dynamic S&R was in the Range (Flat). If the Crude oil brakes above the Last Line of Defense to reverse the trend we can go long based on the following :
1. Stochastic RSI - 4Hr TF, Daily TF and Weekly must above 20
2. MACD should be in Flat on Higher TF
3. Last Line of Defense and Dynamic S& R
4. Monthly CPR will act as Support or Resistance. Hence, It should be consider for a factor.
5. Trend was in Bullish as EMA 200 or EMA 162 in Daily and Weekly TF
Based on the above factor we can go long in Crude Oil
Shorting:
Dynamic S&R - EMA50 and EMA79 was being respected in Daily and 4hr TF which act as Resistance
Power Move in 4HR TF which can be signal of bearish sign.
Trend in 4hr is Bearish as per EMA200.
Crude oil was in the resistance zone of CPR.
Based on the said thing we short the market if we found a reversal pattern or rejection of Candlestick pattern found at the resistance.
Over All. Wait till a confirmation point arise.
Images:
Stochastic RSI:
MACD:
Dynamic S&R and Last Line of Defense:
Daily TF:
4hr TF:
CPR:
Trend as EMA:
Power Move:
CPR of 4hr TF:

VEDL - Triangle Pattern- LongHi Friends,
Right now we are going to analysis the script VEDL
Script was in the Long Trend.
Script was touched the Area of Value with confluence to EMA50 & EMA79 which acts as dynamic Support and Horizonal Support 260.
Stochastic RSI in Daily, 2hr and Weekly was in the oversold region .
MACD was also in the Oversold area
Volatility was in the peak at ATR.
Trend was in the uptrend and Descending triangle pattern was formed which was braked and retested now.
CPR : Script was in the range of CPR . CPR was Bullish Bias.
Based on the above:
We are Bullish on VEDL.
Buy: Tomorrow Open Price
Target - Previous Swing High & Trail your SL further.
SL: 276 - 1ATR
EMA50 and EMA79: Dynamic Support
Stochastic RSI
MACD:
ATR:
CPR:
Triangle Pattern:

Dabur Ltd - ShortHi Friends,
Refer to the Dabur, the Script has now reached the channel Top now the script can reverse to the support level.
Trend are in the Bullish Side. But Price Action evidence the script was in the parallel channel top which was in the range bound.
We are going against the trend based on the below facts:
1. Volatility of the script was in the peak
2. Stochastic RSI was in the overbought range at 2hr, Day and Weekly TF
3. CPR Resistance 1 was reached.
4. Channel Top was reached with confluence on Resistance line.
5. Script was in the Range Bound.
6. EMA 50 was far away from the value which was confluence to Stochastic RSI.
Entry: Tomorrow Open
SL - 622+13.50 - 635.50to 636 ( 1ATR Above 23rd August High)
Target - 574-571.

Nifty Opinion- Tomorrow is more of a wait & watch dayWhile today's fall was expected and my yesterday's idea can be checked for the same, I am not really sure about tomorrow.
There are mixed signs,
1. The hourly stochastic is positive K% is above D%, which according to me is a very good indicator indicating green trend
2. Nifty touched 0.75 gann levels, reversed, retraced almost 78.6% of the total fall from 14575 till 14264, though after retracing it has closed near the low of the day which suggests that probably the expected retracement has already been completed
3. Nifty faced resistance intraday at 14350 which is 19th March low, though it was able to break it upside but closed again below it, so 14350 can act as a good resistance
4. Today was the second day of fall and to continue the cycle, a 3rd day of fall is needed (hypothesis covered in my previous idea)
5. Daily level RSI and Stochastic are negative
6. Journey till 14150 level and then probably till 13600 is expected to be completed
14250, 14140 and finally 14040 will be important points to observe and can provide good support.
Touching 14040 would be 78.6% correction of the rally that began on 1st Feb till 15431.

Nifty opinion- Nifty might be at an important Gann support. Nifty has last week taken support at Gann level and can be expected to again show some bounce in the initial hours tomorrow.
The daily stochastic was almost turning positive till yesterday closing until today's fall, now it's again indicating weakness.
Hourly stochastic is currently resting on the lower band and therefore bounce can't be completely ruled out.
I have observed another interesting thing abt the recent trend, nifty trend of positive and negative in a 5:3 ratio, Nifty falls or stays under pressure for either 5 or 3 days and then goes up or stays green for next 3 or 5 days resp.
Today was the first day of fall after 3 days of green or neutral closing, which suggests continuation of red closing for at least another 2 days.
To sum up, Nifty might open flat, go up in the initial hour and then continue with the downfall.
Good no of PE OI at 14500 but even higher CE OI at 14700. Green opening and trading higher in the initial hours might lure more people to buy CE and then the market can take a turn.
Disclaimer- This is just my opinion and reading. Taking of any trades is not encouraged based on this.

KOTAK BANK ADVANCED FIBBO LEVELS , TRADE WITH CONFIRMATION NSE:KOTAKBANK
TRADE AFTER CONFIRMATION FROM MACD , RSI , MOMENTUM , STOCHASTIC RSI + HEIKEN ASHI USE 1 HR CHART (FOR SWING)
AND WITH SUPERTREND , VWAP STOCHASTIC + HEIKENASHI (INTRADAY) USE 15 MIN AND 5 MIN CHART
100 % TRUSTABLE LEVEL , THESE LEVELS ARE ONLY FOR EDUCATION PURPOSE TRADE AT YOUR OWN RISK
ABHINAV

adani long intraday valid till 30/10/2020NSE:ADANIENT
stochastic gives buy on 15 min TF if stochastic give buy on next candle if break then buy

TCS - Heading DownTCS is currently testing its support of 2200, and has closed below it today. I use Vix Fix along with On Balance Volume to see the trend. Here the OBV is decreasing while the Vix is increasing - clear indication of Share sliding down. Further confirmation is taken using a setup of Stochastic Momentum and Awesome Oscillator. Stochastic shows the beginning of down trend, further confirmed by the Awesome going Red.
First stop from here should be 2130, thats where the support lies, which if broken should 2100 soon. NSE:TCS

Bajaj Auto : Ready for HoodiBaba Ride !!Bajaj Auto has given first indication of bull run when it closed above 2900 on weekly basis which started higher top higher bottom series. Counter has corrected after touching high of 3050. 38.2% retracement of entire rally from 2450 -3050 comes at 2825. 2810-2825 zone should provide support for next bull run. Stochastic has entered into oversold zone but yet to turn bullish. Opportunist can buy at 2825 with stop loss below 2720 for target of 3200. Trend follower can wait for reversal on stochastic and ADX.

BEARISH REVERSAL IN HEROMOTOCORPHEROMOTOCO
Bearish engulfing pattern has been spotted at the top of a rally in heromotoco. Also, there is an immediate resistance at the same level.Both RSI and stochastic have given bearish crossovers. Stochastic lies in the overbought zone.

EIH Eastern International Hotels (Oberoi Group) prices movements are an interesting study in diverging trends. I like to study weekly charts since they are better indicative of medium term trends and give a clearer picture of the strength or weakness of a scrip.
1 and 2, the price and the oscillator move in opposite direction, further the A/D trend (5) also is downward. This confirms the weakness of the upward movement. Similarly 3 and 4 the price stays flat and Stochastic trends upward. When you encounter a divergence in two indicators then this implies to tread with caution.
In the last week the price has dipped below the 200 EMA and this is confirmed by both the stochastic and A/D. Moreover the relative strength vs. Nifty which has been flat, has seen a downward curvature. This is a good opportunity to go short on the stock with stop loss at 100, the stock is likely to move to the early 80's next couple of weeks.

ARKADE📊 Current Price & Key Levels
Last Traded Price (LTP): ₹170.08
Pivot Point: ₹171.40
Support Levels:
S1: ₹166.79
S2: ₹163.51
S3: ₹158.90
Resistance Levels:
R1: ₹174.68
R2: ₹179.29
R3: ₹182.57
📉 Technical Indicators Overview
Relative Strength Index (RSI): 30.98 – Indicates a neutral trend.
MACD: -3.47 – Suggests a bearish momentum.
Stochastic RSI: 8.55 – Indicates oversold conditions.
Commodity Channel Index (CCI): -236.51 – Reflects a strong downtrend.
Money Flow Index (MFI): 37.48 – Indicates a downtrend.
📌 Summary
Trend: The stock is currently in a downtrend.
Key Support: ₹166.79
Key Resistance: ₹174.68
Outlook: Short-term bearish with potential for consolidation.

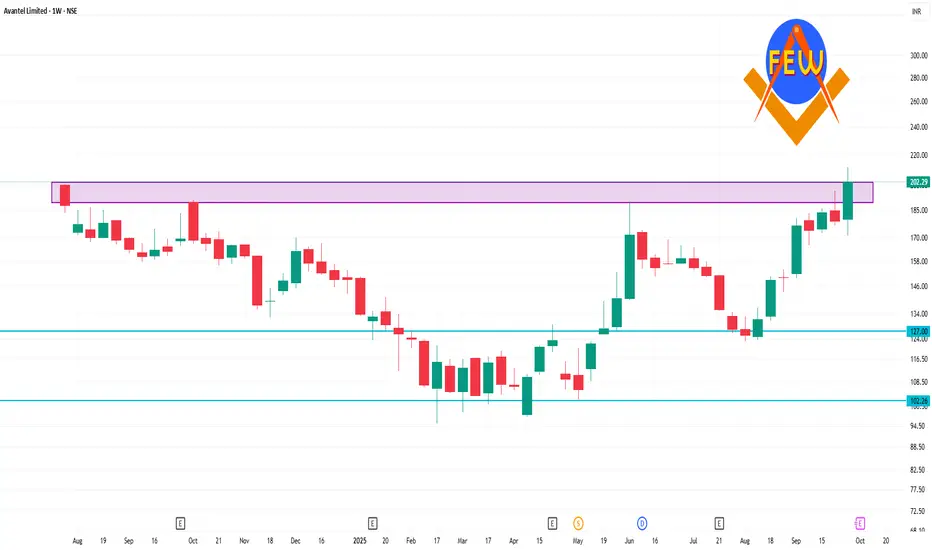
AVANTEL 1 Week Time Frame📈 Price Performance (1 Week)
Current Price: ₹202.29
Weekly Change: +11.61%
52-Week Range: ₹95.51 – ₹211.79
📊 Technical Indicators
Moving Averages
20-Day EMA: ₹173.47
50-Day EMA: ₹160.46
100-Day EMA: ₹151.62
200-Day EMA: ₹144.58
Current Price vs. EMAs: The current price is above all major EMAs, indicating a bullish trend.
Relative Strength Index (RSI)
14-Day RSI: 59.26
Interpretation: The RSI is in the neutral zone (50–70), suggesting neither overbought nor oversold conditions.
Moving Average Convergence Divergence (MACD)
MACD Value: 9.44
Signal: Positive MACD indicates upward momentum.
Stochastic RSI
Value: 53.95
Interpretation: Neutral, with no immediate overbought or oversold signals.
🔍 Summary
Trend: Bullish
Indicators: Most technical indicators are aligned with a positive outlook.
Resistance Levels: ₹211.79 (52-week high)
Support Levels: ₹173.47 (20-day EMA)