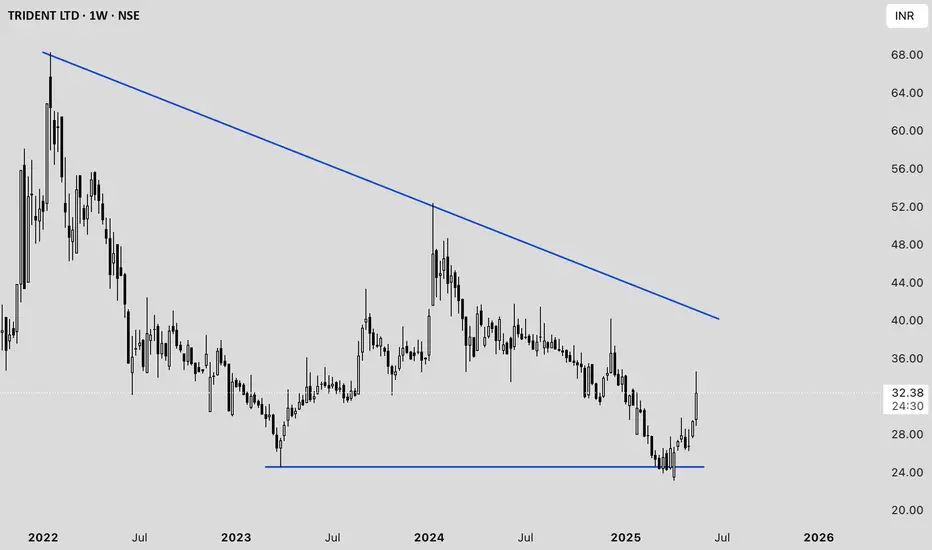
Trident Ltd. Price Analysis (as of May 23, 2025)#### **Current Price and Recent Movement**
- **Latest Price:** ₹32.11 (down 2.32% from the previous close) .
- **1-Week Return:** +9.29%
- **1-Month Return:** +9.11%
- **1-Year Return:** -15.39%
- **3-Year Return:** -32.89%
#### **Technical Analysis**
- **Buy Signal:** A 200-day moving average crossover occurred on May 21, 2025. Historically, this signal has led to an average gain of 6.61% within 30 days .
- **Momentum Indicators:**
- **RSI:** 62.17 (shows moderate bullish momentum)
- **MACD:** 0.535 (bullish signal)
- **Stochastic:** 75.40 (approaching overbought zone)
- **Supertrend:** 26.03 (bullish)
- **ROC:** 10.87 (positive momentum)
- **Analyst Sentiment:** 100% of analysts currently recommend a "Buy" with an average target price of ₹38, indicating a potential upside of ~15.6% .
#### **Fundamental Overview**
- **P/E Ratio:** 44.50–45.65 (well below the industry average of 126.09, but still high relative to earnings growth)
- **Price-to-Book Ratio:** 3.62–3.88
- **Dividend:** Announced ₹0.5 per share (record date: May 27, 2025) .
- **Net Profit Margin:** 5.78% (FY24)
- **Return on Equity:** 9.04% (FY24)
- **Debt/Equity:** 0.48 (moderate leverage)
- **Intrinsic Value Estimate:** ₹9.73 (suggests current price is at a premium to intrinsic value)
#### **Recent Financial Performance**
- **Q3 FY25 Revenue:** ₹1,667.09 crore (down 9.17% YoY)
- **Profitability:** Net profit/share for FY24 was ₹0.76, down from ₹0.83 in FY23
- **Expense Management:** Interest expense is low at 1.86% of operating revenue; employee cost is 13.2%
#### **Strengths**
- Strong technical momentum and recent bullish crossover.
- Consistent dividend payout.
- Low interest expense and moderate leverage.
#### **Weaknesses**
- Declining revenue and profit over the last few quarters.
- High valuation relative to earnings and intrinsic value.
- Long-term returns have been negative over 1 and 3 years.
#### **Outlook**
Analysts remain bullish in the short term, buoyed by technical signals and an expected price target of ₹38 . However, fundamental concerns such as declining profits, high P/E, and premium to intrinsic value warrant caution for long-term investors.
---
**Summary:**
Trident Ltd. is showing short-term bullish momentum with positive technical indicators and analyst sentiment. However, investors should be cautious due to weak long-term performance, high valuation, and recent declines in revenue and profit .
Search in ideas for "stochastic"
📊 Equitas Small Finance Bank Analysis - Week Starting 19th FebNSE:EQUITASBNK
Last Closing Price: 💵 107.20
50-Day Moving Average: 📈 Crossed Over @ 406.52 (Short Term Bull Run)
EMA & MA Crossover: 🔄 Pending @ 104.00 & 102.62 (Bullish Trend Re-establishment Expected)
Parabolic SAR: ✅ Bullish @ 99.00
Fibonacci Levels:
Closed Above 📏 0.382 @ 106.05
Next Target 🎯 Above 0.50 @ 108.05 (Strengthening Buy Signal)
MACD:
Signal Value: 📶 1.28
MACD Value: 📈 1.31
Stochastic RSI: 🔄 K58.67 ➡️ D32.73 (Bullish Crossover)
%R (Williams Percent Range): 📈 Upper Band @ 7.87
Fisher Transform: 🐟 Positive @ 1.42, Trigger @ 2.53 (Bullish)
🎯 Targets:
First Target: 🎯 110.15 (Fibonacci 0.618 Level)
Second Target: 🎯 112.95
🛑 Stop Loss: ⚠️ 99.60 (Fibonacci 0 Level)
⚠️ Disclaimer: This content is provided for informational purposes only. It is not intended as financial advice. Trading involves risks and is influenced by external market conditions. Conduct your research or consult a financial advisor.
#EquitasSmallFinanceBank #TechnicalAnalysis #StockMarket #NSE #TradingView #Investing #Finance #Stocks #BullishTrends #TradingSignals #MarketAnalysis #FibonacciLevels #StochasticsRSI #MACD #ParabolicSAR

JSW Energy Short and Long Term AnalysisFrom couple of day this stock is in bearish . But it takes a support at 407.20 . It's a strong support.
Now this Stock is in Neutral according to technical .
Time Frame Analysis:
1W -2.37%
1M -0.23%
3M -6.25%
6M +38.55%
technical Details As per my view:
Moving Average: (10,20,50,200): Sell
RSI: Neutral
Stochastic: Neutral
Williams Percent Range(14days): -63.53 (Neutral)
Swing or long term Buy Signal: above price 422
Intraday Analysis:
If break 407.20 support with good volume then we can see a good down move of 397.35.
Now price is consolidating between 408.30-412.70 .

Bearish divergence on PELThe analysis is given on the chart
Comment if you have any query and if you like my analysis, don't forget to press the like button.
I am not a SEBI registered investment advisor and hence do not follow my analysis blindly.
Be aware of what you are trading and the risk associated with it.
Stock market is risky and you can lose a lot of your capital.
Be wise and trade carefully!
Grateful!🙏

YesBank - Will it make new high?Yesbank and the rectangle formation looks interesting with the stochastic.When the price is consolidating inside the rectagle, stochastic reaching the lower band implies price will move up. More the consolidation, the break out will have good run. I expect the stock will make new high after forming, breaking the consolidation.

AUDUSD 4 Hour Analysis (3 July 2023)AUDUSD 4 Hour Analysis (3 July 2023)
1. Price is in strong downtrend and also the price is in nearest supply area
2. Also, we can see some bearish divergence in Stochastic
3. if the price breaks the supply area, we can think for some bullish entries
4. But for bearish entry we can check the confirmation in Stochastic.

Balrampur Chini Is Poised For A Huge Move-Stock broke out of a downward channel and then consolidated for a few weeks with volumes drying up.
-Stock broke out yesterday after consolidation, confirming a double bottom and an inverted head & shoulder pattern.
-Stock also broke above a long-term resistance line that has been tested multiple times over the years.
-Breakout was on high volume.
-Stock sustaining above 50 DMA which has acted as resistance in the past.
-Huge bullish divergence on RSI.
-Bullish divergence on Stochastic.
-Huge Bullish divergence on MACD along with MACD line crossing over 0.
-Bullish divergence on weekly MACD, RSI, and Stochastic as well.
Not n investment advice. Do your own due diligence.
Disclosure: Invested.

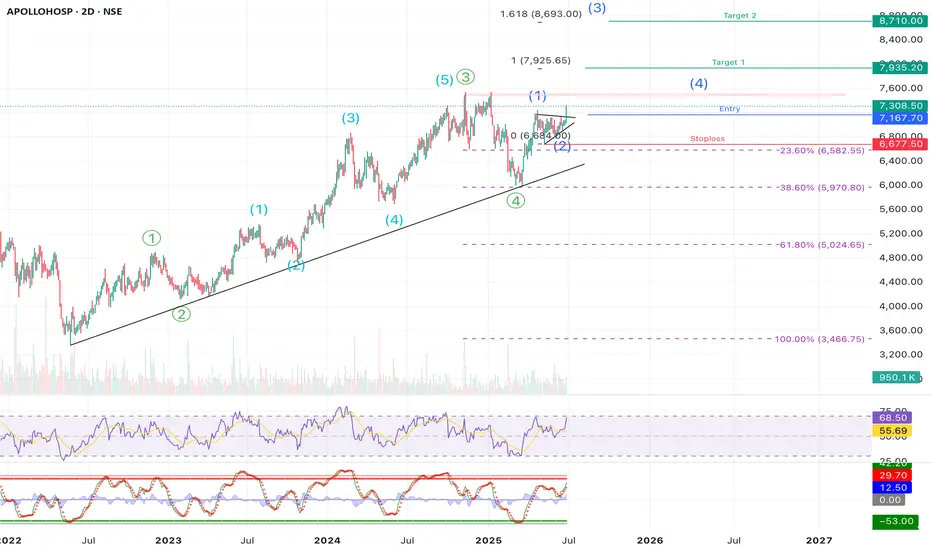
APOLLOHOSP | Swing | Breakout APOLLO HOSPITAL – Elliott Wave Structure + Breakout Opportunity Ahead
Apollo Hospitals is showing a textbook Elliott Wave formation, and we might just be at the beginning of a fresh impulsive rally. If you’re a swing trader or positional investor, this setup is worth keeping a close eye on.
⸻
🧩 Elliott Wave Count Analysis
• The stock is in a larger degree 5-wave move (marked in green). Within that 1-4 completed and wave 5 in progress.
• Within that, we can also see a new 5-wave impulsive structure developing (in blue), and it seems like we just completed Wave (2) of this new leg.
• This means — Wave (3) could be starting now, which is usually the strongest and fastest wave.
⸻
📈 Trade Setup
• Entry Zone: Around ₹7,165–₹7,215
• Stoploss: ₹6,677 (just below recent swing low and invalidation of the current wave count, Around 7-8% )
• Target 1: ₹7,925 (around 10%+ )
• Target 2: ₹8,710 (around 25%)
• Extended Target (Wave 3 Fibonacci Extension): ₹9,167
The targets are based on Fibonacci extension levels from Wave (1) to Wave (2), which typically project the length of Wave (3).
⸻
🔍 Supporting Technicals
✅ Trendline Support
• Price has been respecting a long-term rising trendline since early 2022 — a strong sign of continued bullish momentum.
✅ RSI & Stochastics Turning Up
• RSI is rising but not overbought — suggesting more room for upside.
• Stochastic oscillator is also showing a bullish crossover, confirming early momentum for the next wave up.
⸻
⚠️ Risk Management Note
If price drops below ₹6,677 and breaks the trendline, that would invalidate this Elliott wave count. It’s wise to exit or reduce exposure in that case. This is key to avoid being caught in a deeper corrective phase.
⸻
📝 Summary:
Apollo Hospitals appears to be starting a fresh Wave (3) after completing a healthy correction. With a clean Elliott Wave structure, trendline support, and supportive indicators, the setup looks strong. Risk is clearly defined and the reward potential is high — a good case for a swing position.
⸻
💬 Are you tracking this Wave 3 setup too? Let’s hear your thoughts in the comments below!
Disclaimer:
This analysis is shared for educational and informational purposes only. It is not investment advice or a recommendation. Please consult a SEBI-registered financial advisor before making any investment decisions. The author is not responsible for any losses arising from trading or investing based on this analysis.
The Midcap Carnage is Over. -The Midcap sector showed great realitive strength yesterday when the Nifty was down and Midcaps were up. This happened after a long time.
Weekly chart
-Sector breaking out of a falling wedge pattern on the weekly chart.
-Found support at 50% Fib retracement.
-Bullish divergence on stochastic.
-Converging MACD lines.
Daily chart
-Bullish divergence on RSI.
-Triple bullish divergence on Stochastic.
-Quadruple bullish divergence on MACD.
-MACD line crossing over 0.
Not an investment advice, do your own dude diligence.

Small Caps Have Likely Bottomed Out Here. CNXSMALLCAPOn the weekly chart.
-Breaking out of a falling wedge.
-Bounced off a strong resistance.
-Bounced off 0.618 Fibonacci retracement.
-Bullish divergence on Stochastic.
On the daily chart.
-Bullish divergence on the RSI.
-Bullish divergence on Stochastic.
-Bullish divergence on MACD.
-Bull cross on MACD.

Wipro building the buy momentum📈 Weekly Stock Picks: NSE:WIPRO - Week Starting 4th September, 2023 📈
💡 Rationale for Selection:
📊 Technical Analysis:
Parabolic SAR: Currently showing a sell signal, but the stock has rebounded. 📉➡️📈
Fibonacci Levels: Bounced back from near the 0.618 levels and surpassed the 0.5 levels. Indicates a trend reversal. 🔄
MACD: Expected bottom-up crossover; MACD line (1.3) expected to cross Signal line (2.32) confirming a bullish bias. 📈
Stochastics & RSI: K=23.18, D=9.03, showing the stock has reached oversold territory and is in a position to bounce back. 📈
Percentage R and Fisher 9: Indicate an uptrend is likely in the next 1-2 trading sessions. 📈
📰 Market Indicators:
A surge in IT stocks recently. 📈
Mutual funds are showing increasing interest in IT stocks, expecting a boom. 🤝
🎯 Trade Parameters:
🟢 Entry Price: ₹416.25 (0.382 Fibonacci Levels)
🎯 Target Price: ₹422.20
🔴 Stop Loss: ₹41.75
#WiproLimited #StockPick #TechnicalAnalysis #Fibonacci #MACD #Stochastics #RSI #MutualFunds #ITBoom #WeeklyStockPicks #InvestWisely
📋 Disclaimers and Disclosures:
Risk: Investing in stocks is subject to market risk. Please consult your financial advisor before making any investment decisions. The information provided is only for the education purpose and should not be considered as an investment advice or as stock recommendation. You are requested to take due diligence on your own accord and consult financial advisor, research analyst or a broker before acting on any information on it. We do not confirm any validity or correctness of the information and might change our viewpoint on the stock anytime, as per our discretion and research.
Disclosure: This analysis is purely based on technical indicators and market trends as of 1st September 2023. Past performance is not indicative of future results.
Conflicts of Interest: We may or may not have any vested interest in Wipro Limited as of the date of this report.

Wipro Research24-07-2022
Stochastics are at low shows to go high and touch 473.85 till mid-October according to the Fibonacci tool Analysis
Wipro Released its Q1FY2022 results where it grew its revenue but issuing dividends to the shareholders made an unusual expense to the company.
CFO Jatin thinks, issuing dividends is the reason behind its increased expenses and fall in NET Profit and Stock Price.
Profit of the company fall 21% YoY
Wipro is just spending on its marketing strategies for the upcoming Quarter and their Financial expenses were more than the last FY same Quarter end!
Theirry Delaport states their clients' word while supporting Wipro's increased expenses- Technology is not a cost it's an investment, it's a way to transform to improve productivity.
According to my Analysis and understanding, I think there is something big to hit at the upper level for Wipro from this point as it's below its intrinsic value and we see the economy recovering from the inflation so I believe this point would be the lowest for Wipro and it will show a very peculiar growth in Q2 as its already at the bottom of its potential in the stock market after looking at its Stochastics NSE:WIPRO

BANKNIFTY [30th December 2020]** PLEASE NOTE THAT ALL LEVELS MENTIONED ARE SPOT **
Good evening! The market rallied on, as speculated in yesterday’s post, but stopped short at a minor hurdle @ 31375. USDINR took support at a Fibonacci level around 73.50 and Stochastics seems to be ready to go up, while BN’s Stochastics remains at an overbought zone. A quick test of 31000 cannot be ruled out.
In case of a GAP-UP , one can go long if the index sustains above 31375 for targets of 31500-31600-31800. If it fails to sustain above 31375, one can look to short for levels mentioned below.
In case of a GAP-DOWN , one can short if the index breaches 31300 for targets of 31200-31000-30950. The trend support line lies around 31200 which should act as a good support. If it manages to take support there, one can look to go long for targets of 31350-31500-31650.
--
“It is not the strongest of the species that survives, nor the most intelligent, but the most adaptable to change.” – Charles Darwin

BANKNIFTY [13th October 2020]The divergence in Stochastics highs recently led to the swift fall in the index, but has also led the Stochastics to an oversold zone. Hard to say which way it’ll go but I am expecting a rangebound movement with a positive bias for a day or two. However, the view will be negated if the index breaches and stays below 23500 (also 1 week’s MA).
LONG , if the index sustains above 23850 for targets of 24060-24200-24500 . Ideally one should go long if the index sustains in the range of 23500-23700.
SHORT , if the index breaches and stays below 23500 for targets of 23200-23000-22800 . Ideally one should short around 23800 if weakness is evident around that level.

BANKNIFTY [12th August 2020]The index closed comfortably above its 50% retracement level of 22120 but below 22250 (initial resistance in the first hour today). Although the index has been scaling new heights, its visible that the up-move is becoming a struggle. 22400, a crucial level, should be the next deciding point. However, there are more reasons for the index to correct a little from these levels than continuing the one-way ride. Some of them are as follows -
1. The index has retraced more than 50% of its recent fall, purely, by tracking global indices. The recent monetary policy did give the index a push but aggression was missing.
2. 22400 not only serves as 61.8% retracement of recent fall but also 38.2% retracement of its fall from all time-high. The level has witnessed strong distribution on several occasions in the past. It is also, coincidentally, the upper end of the rising trend channel.
3. Stochastics on the hourly chart is at the overbought zone and is also showing a divergence from its previous high in contrast to the candlesticks.
On the upside, even with a gap up, 22400 will act as a pivot point. Ideally one can short between 22400-22500. The stochastics-divergence-led-correction hypothesis will be negated if the index takes support and closes above 22500.
On the downside, if there is a gap down, 22250-22200 would be good levels to go short for 22120-22050-22900. However, the options OI data suggests that the expiry would probably be above 22000.
Expecting the expiry range to between 22000-22500.

BANKNIFTY [13th July 2020]The market observed a relentless rally towards 23100 in the past week despite negative news all around. However, a massive supply zone was observed at around 23000 levels, this being the second supply zone after 22400. Momentum is dying out slowly and Stochastics has more ground to go before bottoming out. There are still ample chances of the market resuming its journey upwards after certain levels as discussed below.
On the upside, any weakness seen at 22500-22650-23000 levels should be used as a shorting opportunity for levels of 22400-21650-20800 (please keep your targets using these levels as an approximation).
However, a divergence between the lows of Price and Stochastics gives the market a good opportunity to spike up with volume in the first half itself. In case the market manages to breach and sustain beyond 23000, the index will resume its upmove to 23500 and ultimately 24350 (50% fib retracecment from the low of March to all time high).

BANK NIFTY CHANNEL FALL EXPECTEDAS YOU CAN SEE IT IS RESPECTING CHANNEL PLUS IT IS HAVING BEARISH DIVERGENCE WITH STOCHASTICS IN HOURLY CHART LETS SEE WHAT HAPPENS LET STOCHASTICS GIVE CROSSOVER AND COME BELOW 80
EVEN IF IT OPENS GAP UP OUT OF CHANNEL IT WILL EVENTUALLY ENTER IT AS STOCK CANT STAY OUT FOR LONG BUT IF CLOSES ABOVE CHANNEL LINE FIRST LET NEXT CANDLE BREAK HIGH OF 1ST THEN ONLY GO LONG

Smart money buying in YES BANK.YES Bank Breakout Alert
YES Bank has recently shown a strong breakout supported by high trading volume, following news that Japan's Sumitomo Mitsui Banking Corporation has received RBI approval to acquire a 51% stake in the bank.
From a technical standpoint, the chart structure indicates a bullish trend on higher time frames. If this breakout holds as genuine, the stock has the potential to test ₹22.50 and ₹28 levels in the near term — representing an upside of approximately 40% from current levels.

"IOTX" A Parallel Channel TradePreferably Sell at/above = .07799
1st Target = .07373
2nd/final target = .06951 with trailing stop loss
Just paper trade.
GG.

♠️ACE♠️Preferably buy at/below - 8.5650
Target 1 - 10.3836
Target 2 - 12.2180 with trailing stop loss
Target 3 - 14.0415 with trailing stop loss
Stop loss - 6.7427 or as per your preference/ risk appetite.
Just Paper Trade.

BANKNIFTYWe can see market opening down, if this happens then we will see bullish movement later on or if its a bullish opening than surely bearish movement as seen in stochastics.
Wait and trade.
Happy trading.

Chola Finance Can you sell it ? 🤔Hey, do you like profit then your search is ending now
Today we are having
NSE: CHOLAFIN
We have already seen that the chart is showing us weakness in the past few days but the scallops patterns have occurred and now you could see a downside
What we have found by analyzing the chart
1. A Scallops pattern has occurred
2. The Chart Breaked a series of dojis and could be for selled for this week
3. It has left the 50 - day moving average a way too far
4. Time frame :- 1 Day
5. Like the Post and Follow us on Trading view
Comment Below If You want to ask me questions on this on any other idea
Have a Nice Day to you all
Made By MAYANKTECHRESEARCHING 🙏
We are not responsible for any profit or loss
Based on Your Own Risk this is only to show you what's going on

SGX Nifty 22/02/21 at 20.48 istSGX NIFTY
on 4 hour chart
SGX NIFTY is oversold zone on RSI and Stochastics.
It has also tested the earlier breakout point of 14663.
Today market lows violated tomorrow then downslide continues.
Earlier we had shown the retracement of the rise from 13588 to 15443.
SGX does have the gaps. But the big jump reversal seen earlier from 14065
could be tested if sustains below low of 22/02/21 market on 23/02/21.
Pull back if any can climb back to 15034-15247.
The same can be supply zone till new peak is not made.
