Paytm stock breakoutLet's dive into the **Paytm (One97 Communications Ltd.)** analysis from both a **fundamental** and **technical** perspective.
### **Fundamental Analysis of Paytm (One97 Communications Ltd.)**
#### **Overview of Paytm**
- **Sector:** Financial Services, Technology
- **Industry:** Digital Payments, Financial Technology (FinTech)
- **Founded:** 2010 by Vijay Shekhar Sharma
- **Headquarters:** Noida, India
- **Market Cap:** Approx. ₹47,000 crore (as of the latest data)
Paytm is one of India’s leading digital payment platforms, offering services in mobile wallets, payments, banking, insurance, and wealth management. Paytm became a household name in India, especially after the 2016 demonetization, which significantly boosted the adoption of digital payment systems.
#### **Key Financials (Latest Report)**
- **Revenue Growth:** Paytm has shown significant growth in its top line, driven by the expansion of its digital payments and financial services products. The company has diversified into multiple areas, including lending, insurance, and wealth management.
- **Profitability:** Despite its high revenue growth, Paytm has faced challenges in achieving consistent profitability. As of the latest financial results, the company has been operating at a loss, mainly due to high customer acquisition costs, marketing, and operational expenses.
- **Debt Levels:** Paytm has taken on some debt for its expansion, but it is generally well-funded by investors, having raised significant capital through its IPO.
- **Market Share:** Paytm is one of the dominant players in India’s digital payments sector, competing with other fintech giants like Google Pay, PhonePe, and MobiKwik.
#### **Valuation Ratios**
- **P/E Ratio:** Paytm is not currently profitable, so it does not have a meaningful P/E ratio.
- **P/B Ratio:** As Paytm is still in a growth phase, its Price-to-Book (P/B) ratio reflects the market's valuation of its future growth potential. It remains relatively high compared to traditional companies.
- **Losses & Burn Rate:** Paytm has faced a high burn rate as it invests heavily in customer acquisition, technology, and expanding its financial product offerings. Investors are waiting for the company to scale and achieve profitability.
#### **Industry & Macro Trends**
- **Digital Payments Growth:** The digital payments market in India is expanding rapidly, driven by increased smartphone penetration, digital adoption, and government initiatives like UPI. Paytm stands to benefit from this market shift.
- **Financial Services Expansion:** Paytm has been diversifying into other areas of financial services, including lending, insurance, and wealth management, which should provide additional growth avenues.
- **Regulatory Risks:** Being a fintech company, Paytm is subject to regulatory scrutiny, especially around its lending practices and financial products. Changes in regulations could impact its business model.
- **Competition:** Paytm faces intense competition from established players like Google Pay, PhonePe, and Amazon Pay. Additionally, traditional banks are increasingly investing in their digital offerings, increasing the competitive pressure.
---
### **Technical Analysis of Paytm**
Let's look at Paytm's potential technical outlook based on its stock price movement, assuming you're analyzing the stock after it went public:
#### **Price Action:**
- **Current Price:** The stock price of Paytm (One97 Communications) has been volatile since its IPO, trading below its listing price at various points, reflecting investor sentiment and concerns about its long-term profitability.
- **Chart Patterns:** Given the volatility, Paytm might show consolidation patterns, breakout formations, or flag patterns that can indicate future price movement.
#### **Key Levels:**
- **Support Levels:**
- **₹600-₹620:** Paytm has found support at this range in the past, where the stock could consolidate. If the price falls here again, this could be a potential buying opportunity.
- **₹500-₹530:** A critical support zone. If the stock breaks below this level, it might suggest further downside potential.
- **Resistance Levels:**
- **₹750-₹770:** The stock has faced resistance near this level multiple times. A breakout above this resistance could indicate potential upside and momentum.
- **₹900-₹950:** This level could act as a significant barrier if the stock experiences upward momentum, representing key psychological resistance.
#### **Moving Averages:**
- **50-Day Moving Average (50-MA):** If Paytm is trading above its 50-day moving average, it suggests short-term bullishness. If it trades below, it indicates potential weakness.
- **200-Day Moving Average (200-MA):** A key indicator of long-term trend direction. If Paytm is trading above its 200-day MA, it would indicate that the long-term trend is positive.
#### **Momentum Indicators:**
- **RSI (Relative Strength Index):** The RSI gives an indication of whether the stock is overbought or oversold. If the RSI is above 70, the stock could be overbought, and if below 30, it could be oversold.
- **Current RSI:** If RSI is nearing 70, it may signal that the stock is approaching overbought conditions.
- **MACD (Moving Average Convergence Divergence):**
- A positive MACD (where the MACD line crosses above the signal line) would suggest bullish momentum, whereas a negative MACD would signal weakening momentum.
#### **Volume Analysis:**
- **Volume Trends:** Rising volume during price increases signals strong buying interest. If the stock rises without a significant increase in volume, it could indicate a lack of conviction behind the move.
- **Volume Spikes:** A large volume spike near key support or resistance levels could signal the initiation of a breakout or breakdown.
---
### **Conclusion:**
- **Fundamental Strengths:**
- Paytm is a leader in India’s digital payment sector, with a massive user base and a wide array of services.
- The company is expanding its reach in financial services, which could drive growth in the future, though profitability remains a concern.
- **Technical Outlook:**
- The stock has experienced significant volatility since its IPO, with key support levels at ₹600-₹620 and resistance levels near ₹750-₹770.
- Paytm’s ability to sustain a bullish trend will depend on breaking through resistance levels and maintaining strong volume on upward moves.
#### **Risks to Watch:**
- **Profitability Concerns:** Paytm’s high marketing and operational expenses could continue to weigh on profitability in the short term.
- **Competition & Market Sentiment:** Paytm faces competition from established fintech players and changing market dynamics, which could affect its market share and valuation.
---
**Disclaimer:**
The information provided is for educational purposes only and should not be construed as financial or investment advice. I am not a SEBI-registered advisor, and this analysis is not a recommendation to buy, sell, or hold any securities. Accuracy and timeliness of the data cannot be guaranteed. Always conduct your own research or consult with a professional before making investment decisions. I do not take responsibility for any losses incurred.
Sensexanalysis

Patanjali stock Long Let’s analyze **Patanjali Foods Limited** (previously known as **Ruchi Soya Industries**), which is one of the key companies under the Patanjali group and focuses on food products, including edible oils, soya foods, and other packaged products.
### **Fundamental Analysis of Patanjali Foods Limited**
#### **Overview of Patanjali Foods Ltd.**
- **Sector:** FMCG (Fast-Moving Consumer Goods)
- **Industry:** Edible Oils & Food Processing
- **Parent Group:** Patanjali Ayurved (owned by Baba Ramdev and Acharya Balkrishna)
- **Headquarters:** Haridwar, India
- **Market Cap:** Approximately ₹50,000 crore (as per the latest reports)
Patanjali Foods is one of India’s leading companies in the edible oil and food products sector. It produces a range of products such as edible oils (under the brand name "Patanjali"), soya, and other processed foods. It has a strong presence in the Indian market, particularly after it was acquired by Patanjali Ayurved and rebranded as Patanjali Foods.
#### **Key Financials (Latest Report)**
- **Revenue Growth:** The company has shown strong growth due to its expanding product portfolio and aggressive marketing strategies. In recent years, Patanjali Foods has benefitted from the rising demand for healthy cooking oils and packaged food products.
- **Profitability:** The company’s margins have been under pressure in some years due to raw material price fluctuations (e.g., the cost of edible oils). However, Patanjali Foods remains relatively profitable.
- **Debt Levels:** Post-acquisition, Patanjali Foods has focused on reducing its debt levels and improving financial health, but it still carries some debt from its past operations before the acquisition.
- **Brand Recognition:** The Patanjali brand has a significant impact on consumer purchasing behavior in India, and its market positioning has helped it maintain a competitive edge in the food sector.
#### **Valuation Ratios**
- **P/E Ratio:** Patanjali Foods has benefited from its acquisition and transformation, but its valuation can fluctuate based on commodity price trends and the competitive landscape in the edible oils sector.
- **P/B Ratio:** Given its strong brand, Patanjali Foods may command a premium valuation compared to other food sector companies.
- **Dividend Yield:** The company pays a dividend, reflecting a strong cash flow and a shareholder-friendly approach, though the yield might vary year-to-year depending on profitability.
#### **Industry & Macro Trends**
- **Edible Oil Market:** The demand for edible oils continues to rise, especially healthy oils such as sunflower, soybean, and mustard. Patanjali Foods benefits from this trend by offering a variety of edible oil products.
- **Health-Conscious Consumers:** As consumers become more health-conscious, Patanjali's focus on natural and Ayurvedic-based products positions it well in the market.
- **Competition:** Patanjali Foods faces competition from other major edible oil brands like Marico (Saffola), Adani Wilmar (Fortune), and Hindustan Unilever (Listerine).
---
### **Technical Analysis of Patanjali Foods Limited**
If you were analyzing **Patanjali Foods Ltd.** from a technical standpoint (assuming it were a publicly traded stock), the following would apply:
#### **Price Action:**
- **Current Price:** The stock price would fluctuate based on market sentiment, commodity price movements, and company announcements.
- **Chart Patterns:** Look for potential patterns such as bullish triangles, head and shoulders, or cup-and-handle patterns that could indicate breakout opportunities or price consolidations.
#### **Key Levels:**
- **Support Levels:**
- **₹1,000-₹1,050:** Historically, stocks in this price range tend to find support. If the stock moves below this level, it may trigger further declines.
- **₹900-₹950:** This zone would likely act as a second line of defense if prices drop further.
- **Resistance Levels:**
- **₹1,200-₹1,250:** A critical resistance level, as it represents a key psychological barrier. A breakout above this level could lead to further bullish movements.
- **₹1,350-₹1,400:** The next level of resistance where significant selling pressure might come in.
#### **Moving Averages:**
- **50-Day Moving Average (50-MA):** If the stock is above the 50-day MA, it suggests short-term bullish sentiment.
- **200-Day Moving Average (200-MA):** A stock trading above the 200-day MA shows long-term strength. If the stock breaks below this level, it would indicate weakening momentum.
#### **Momentum Indicators:**
- **RSI (Relative Strength Index):** The RSI helps determine whether a stock is overbought or oversold. An RSI above 70 would indicate overbought conditions, while an RSI below 30 would indicate oversold conditions.
- **MACD (Moving Average Convergence Divergence):** A positive MACD line crossing above the signal line would indicate bullish momentum, while a negative MACD could point toward bearish signals.
#### **Volume Analysis:**
- **Volume Trends:** Rising volume during an uptrend indicates strength. If the volume increases during price declines, it could indicate selling pressure.
- **Volume Spikes:** Large volume spikes at key support or resistance levels could indicate significant shifts in market sentiment.
---
### **Conclusion:**
- **Fundamental Strengths:**
- Patanjali Foods is a strong player in the Indian edible oils and food products sector, benefiting from the growing demand for natural, healthy products.
- The company has a solid brand presence, which helps it maintain a competitive edge in an increasingly crowded FMCG space.
- The company's focus on health-conscious products has helped it gain market share in the oil and packaged food sectors.
- **Technical Outlook:**
- Key support lies around ₹1,000-₹1,050, and resistance near ₹1,200-₹1,250. A breakout above these levels could signal further bullish movement.
- Moving averages, RSI, and MACD would be important to monitor to gauge the stock's short-term and long-term trend.
Patanjali Foods' strong brand equity, along with the overall positive sentiment in the FMCG sector, makes it an interesting stock to watch for potential investment, assuming it follows the growth trajectory of its parent company, Patanjali Ayurved.
---
**Disclaimer:**
The information provided is for educational purposes only and should not be construed as financial or investment advice. I am not a SEBI-registered advisor, and this analysis is not a recommendation to buy, sell, or hold any securities. Accuracy and timeliness of the data cannot be guaranteed. Always conduct your own research or consult with a professional before making investment decisions. I do not take responsibility for any losses incurred.

Best Mutual Funds and SIPs for 2025Best Mutual Funds and SIPs for 2025
Mutual funds and Systematic Investment Plans (SIPs) are popular investment options for both new and experienced investors. With 2025 on the horizon, selecting the right funds is crucial for maximizing returns and managing risk effectively.
Top Performing Mutual Funds for 2025
Large-Cap Funds: Suitable for stable growth with moderate risk.
Example: HDFC Top 100 Fund
Example: ICICI Prudential Bluechip Fund
Mid-Cap Funds: Higher growth potential but with increased volatility.
Example: Axis Midcap Fund
Example: Nippon India Growth Fund
Small-Cap Funds: High-risk, high-reward investments.
Example: SBI Small Cap Fund
Example: Kotak Small Cap Fund
Debt Funds: Low-risk option for stable returns.
Example: ICICI Prudential Corporate Bond Fund
Hybrid Funds: Balance of equity and debt.
Example: HDFC Balanced Advantage Fund
Why Choose SIPs?
Disciplined Investing: Encourages regular savings.
Rupee Cost Averaging: Reduces the impact of market volatility.
Compounding Benefits: Helps grow wealth over time.
Conclusion
Investing in the right mutual funds and SIPs in 2025 can provide stable growth and financial security. Always diversify your portfolio and consult financial experts before investing.
Disclaimer: SkyTradingZone provides educational content only and does not offer financial or investment advice. We are not SEBI registered.

what is rsi and why it is important for trading ?**SkyTradingZone: Your Ultimate Guide to Trading Education**
# Understanding RSI (Relative Strength Index) and Its Importance in Trading
## What is RSI?
Relative Strength Index (RSI) is a momentum oscillator that measures the speed and change of price movements. It helps traders identify overbought and oversold conditions in the market and provides insights into potential trend reversals.
### RSI Formula:
RSI = 100 -
Where RS (Relative Strength) = Average gain over a period / Average loss over the same period
The standard period used for RSI is 14 days, but traders can adjust it based on their strategy.
## How to Interpret RSI?
- **Above 70:** Indicates overbought conditions; potential for price correction or reversal.
- **Below 30:** Indicates oversold conditions; potential for price bounce or uptrend.
- **Between 30-70:** Indicates a neutral zone where price is neither overbought nor oversold.
## Importance of RSI in Trading
1. **Identifying Overbought and Oversold Conditions:** RSI helps traders avoid entering trades at extreme price levels.
2. **Trend Confirmation:** RSI can confirm whether an existing trend is strong or losing momentum.
3. **Divergence Trading:** If price makes a new high but RSI doesn’t, it signals a potential reversal (bearish divergence). If price makes a new low but RSI doesn’t, it signals a potential uptrend (bullish divergence).
4. **Support and Resistance Validation:** RSI can help validate whether a support or resistance level is likely to hold.
## How to Use RSI Effectively?
- Combine RSI with other indicators like Moving Averages and Bollinger Bands for better accuracy.
- Look for RSI divergences to predict potential trend reversals.
- Use RSI along with candlestick patterns for precise entry and exit points.
- Adjust RSI periods for different trading styles (e.g., shorter periods for day trading, longer for swing trading).
## Conclusion
RSI is a powerful tool in technical analysis that helps traders understand market momentum and make informed decisions. When combined with other indicators, RSI can improve trading accuracy and risk management.
---
*Disclaimer: SkyTradingZone provides educational content only and does not offer financial or investment advice. We are not SEBI registered.*

how to ride big bullish trends in market ?Riding big bullish trends in the market requires a combination of skill, strategy, and discipline. Here are several steps and strategies that traders and investors commonly use to take advantage of strong upward trends:
### 1. **Identify the Bullish Trend Early**
- **Trend Indicators:** Use tools like moving averages (e.g., 50-day, 200-day) to confirm the trend. When the price is above a moving average, it's often a sign that the market is in a bullish phase.
- **Volume Analysis:** Look for increasing volume as prices rise. A strong uptrend is often confirmed with higher trading volume.
- **Support & Resistance:** Identify key support levels where the price bounces higher and resistance levels where the price breaks through. Breaking resistance levels could signal the start of a strong bullish move.
- **Chart Patterns:** Watch for patterns like "cup and handle," "ascending triangles," or "bullish flags" that often precede large upward movements.
### 2. **Use Technical Analysis to Enter the Market**
- **Pullbacks and Corrections:** A pullback in the trend is a good entry point if the bullish trend is still intact. For example, buying during small pullbacks after a strong upward movement can often provide an opportunity to enter at a favorable price.
- **Breakouts:** If a stock or asset breaks through a significant resistance level with momentum, this could indicate the beginning of a big move.
- **Indicators:** Use momentum indicators like RSI (Relative Strength Index) or MACD (Moving Average Convergence Divergence) to confirm that the trend is strong and not overbought.
### 3. **Risk Management**
- **Stop-Loss Orders:** Set stop-loss orders to limit your losses if the trend reverses. Consider trailing stops, where the stop-loss moves with the price to lock in profits as the trend moves up.
- **Position Sizing:** Don’t risk too much of your capital on a single trade. Use appropriate position sizing, so that even if a trade goes against you, it doesn’t hurt your portfolio too much.
- **Diversification:** Don’t concentrate all your investments into one asset or market. Spread your risk across different assets that are all riding a bullish trend.
### 4. **Ride the Trend with Patience**
- **Don’t Rush to Exit:** If the trend is strong, sometimes the best strategy is to hold your position and avoid jumping in and out of the market. Many successful traders let their positions run while adjusting their stop-loss to lock in gains.
- **Mental Discipline:** Avoid the temptation to exit too early or chase the market. Stay disciplined and stick with your plan.
### 5. **Monitor Market Sentiment**
- **News & Events:** Stay aware of news, earnings reports, and events that could drive the market. Strong bullish trends can be supported by good news, but you must also be cautious of any market-moving events that could reverse the trend.
- **Market Sentiment Indicators:** Use sentiment indicators like the Fear & Greed index or news sources to gauge whether the market is overly optimistic or if there’s still room for the trend to continue.
### 6. **Scale-In and Scale-Out**
- **Scale-In:** Add to your position as the trend strengthens and the price continues to go up. Don’t go all-in at once. Add to the position gradually as it proves itself.
- **Scale-Out:** Take partial profits along the way to lock in some gains while letting the rest of the position run if the trend continues.
### 7. **Avoid Emotional Trading**
- **Fear of Missing Out (FOMO):** Don’t chase the trend after it has already run up significantly. This often leads to buying at the top and facing a market reversal.
- **Greed:** Don’t hold onto a position out of greed when signs of a reversal are apparent. Recognize when it’s time to exit or reduce your exposure.
### 8. **Adapt to Changing Market Conditions**
- **Trend Reversals:** Be aware of signs that the trend may be reversing (e.g., a sudden sharp drop in price or lower highs forming in the chart). Don't ignore signals of a potential change, and be ready to exit before the trend turns.
- **Market Cycles:** Understand that markets move in cycles. While one trend may be bullish, eventually the market will transition, and you need to adjust your strategy accordingly.
### 9. **Use Leverage Cautiously (Advanced)**
- If you're an experienced trader, you might consider using leverage to amplify your returns on a bullish trend. However, leverage increases risk, so it should be used cautiously, and only if you fully understand the risks involved.

What is adx and why it is important ?**ADX (Average Directional Index)** is a technical analysis indicator used to measure the strength of a trend, whether it’s an uptrend or a downtrend, but **not** the direction of the trend itself. It was developed by J. Welles Wilder in the late 1970s and is part of the **Directional Movement System**, which also includes two other indicators: the **+DI** (Positive Directional Indicator) and **-DI** (Negative Directional Indicator).
### **How ADX is Calculated:**
The ADX line itself is derived from the **+DI** and **-DI** lines, which represent the strength of the upward and downward price movements, respectively. ADX ranges from **0 to 100**, with the following general interpretation:
- **0 to 25:** Weak trend — This means the market is in a choppy, sideways range, and there is little directional movement.
- **25 to 50:** Strong trend — The market is showing a significant directional movement, whether up or down.
- **50 to 75:** Very strong trend — This indicates an extremely strong trend.
- **75 to 100:** Extremely strong trend — An extremely strong trend, though markets rarely reach this level for extended periods.
The **+DI** and **-DI** lines represent the strength of upward and downward price movements:
- **+DI** indicates upward movement, and when it's above **-DI**, it suggests that the uptrend is stronger.
- **-DI** indicates downward movement, and when it's above **+DI**, it suggests that the downtrend is stronger.
---
### **Why ADX is Important:**
1. **Trend Strength:** ADX tells you how strong a trend is, not whether it’s up or down. This helps traders identify whether the market is trending or moving sideways, which is crucial for determining which strategies to use. For instance:
- If ADX is above 25, a trending market is present, and trend-following strategies like moving averages or trendlines can be effective.
- If ADX is below 25, the market is range-bound, and range-trading strategies (such as support and resistance) might work better.
2. **Avoiding False Signals:** In sideways markets (low ADX values), using trend-following indicators like moving averages can give false signals. ADX helps traders avoid these false signals and focuses attention on trending markets.
3. **Confirming Trend Reversals:** ADX can also help in confirming trend reversals. When the ADX is rising, it indicates that a new trend (either upward or downward) is developing. Conversely, a falling ADX may indicate that the current trend is losing strength and that a reversal could occur.
4. **Deciding When to Enter or Exit:**
- **Entry signals:** Traders may look for a rising ADX line above 25 in combination with a crossover between the **+DI** and **-DI** as a signal to enter a trade.
- **Exit signals:** A falling ADX, especially if it drops below 20 or 25, may signal a weakening trend, suggesting it might be a good time to exit a trade.
### **Summary:**
- **ADX** tells you how strong a trend is (but not the direction).
- Values above 25 indicate strong trends (either up or down), while values below 25 indicate weak or no clear trend.
- It’s useful for confirming whether the market is trending or range-bound, helping you decide which strategies to employ.
- **+DI** and **-DI** indicate the direction of the trend, while ADX gauges its strength.

what is RSI and Rsi divergence ?**RSI (Relative Strength Index)** is a popular technical indicator used in financial markets, primarily to assess the strength or momentum of a security's price movement. It was developed by J. Welles Wilder in the late 1970s.
- **RSI Calculation:** The RSI ranges from 0 to 100 and is typically calculated using 14 periods (though it can be adjusted). The formula compares the magnitude of recent gains to recent losses in price movement, essentially measuring how overbought or oversold an asset might be.
- RSI = 100 - (100 / (1 + RS)), where **RS** is the average of "up closes" divided by the average of "down closes" over the given period.
**Key Levels to Watch:**
- **Overbought:** RSI above 70 typically suggests the asset might be overbought and could face a price reversal or pullback.
- **Oversold:** RSI below 30 typically suggests the asset might be oversold and could experience a price reversal upward.
---
**RSI Divergence** occurs when there is a discrepancy between the price movement of an asset and the movement of the RSI.
- **Bullish Divergence:** This happens when the price forms lower lows, but the RSI forms higher lows. It suggests that despite falling prices, the downward momentum is weakening, indicating a potential upward reversal or trend change.
- **Bearish Divergence:** This happens when the price forms higher highs, but the RSI forms lower highs. It suggests that despite rising prices, the upward momentum is weakening, indicating a potential downward reversal or trend change.
### Example:
- **Bullish Divergence:** Imagine a stock price makes a new low, but the RSI makes a higher low. This divergence could signal a buying opportunity as the stock might be oversold and due for a bounce.
- **Bearish Divergence:** If a stock price makes a new high, but the RSI forms a lower high, it may signal a potential selling opportunity because the buying momentum is weakening, and a price drop could be imminent.
RSI divergence is considered a potential signal, but it's often more reliable when used in conjunction with other technical indicators or chart patterns to confirm a potential reversal.

how to become profitable in long term trading ?Becoming **profitable in long-term trading** is about developing a solid strategy, being patient, and having the discipline to stick to your plan through market ups and downs. It’s not about quick gains but rather about making consistent, smart decisions that compound over time. Here are key steps you can follow to increase your chances of long-term profitability:
---
### **1. Develop a Clear Trading Plan**
A **trading plan** is essential for long-term success. It serves as a roadmap to guide your decisions and keep your emotions in check.
- **Define Your Goals**: Are you looking to grow your wealth over time, generate income, or hedge other investments? Be clear on your objectives.
- **Choose Your Trading Style**: Long-term trading can include strategies like:
- **Buy and Hold**: Holding positions for years to capture long-term growth.
- **Swing Trading**: Holding positions for several weeks or months based on market trends.
- **Position Trading**: Taking larger positions based on long-term trends or fundamental factors.
- **Set Criteria for Trades**: Define what conditions need to be met for you to enter and exit a trade, based on technical analysis, fundamentals, or both.
---
### **2. Focus on Solid Fundamentals**
In long-term trading, understanding the underlying assets you're trading is key. This involves:
- **Fundamental Analysis**: For stocks, this means analyzing financial statements, revenue growth, debt levels, competitive advantage, and management quality. For other assets like commodities or currencies, it means understanding supply/demand dynamics, global economic trends, etc.
- **Quality Assets**: Invest in assets that have strong long-term potential. For example, stocks of companies with solid fundamentals (e.g., consistent earnings growth, strong market position) are more likely to appreciate over time.
- **Diversification**: Spread your investments across different asset classes (stocks, bonds, commodities, etc.) to reduce risk. A diversified portfolio helps smooth out the ride over time.
---
### **3. Embrace the Power of Compounding**
**Compounding** is one of the most powerful concepts in long-term investing. By reinvesting your profits (such as dividends, interest, or capital gains), you earn returns on your original investment as well as your accumulated returns.
- **Start Early**: The earlier you start, the more time your investments have to compound. This means consistently reinvesting profits back into the market.
- **Regular Contributions**: Consider contributing to your portfolio on a regular basis (e.g., monthly or quarterly), even if the amounts are small. Over time, these contributions can grow significantly.
---
### **4. Stick to a Risk Management Strategy**
Long-term trading requires patience, and part of that patience comes from managing risk effectively.
- **Position Sizing**: Don't risk too much on any single trade. The general rule is to risk only 1–2% of your capital on each position. This helps ensure that even if a trade goes wrong, it won’t hurt your overall portfolio too much.
- **Diversification**: As mentioned, diversifying your investments across different sectors, industries, or asset classes can help reduce the overall risk of your portfolio.
- **Set Stop-Losses and Take-Profits**: While long-term trading generally involves less frequent exits, it's still smart to set stop-loss levels to protect yourself from large, unforeseen losses and take-profit levels to lock in gains when your target is met.
---
### **5. Be Patient and Avoid Emotional Trading**
- **Long-Term Focus**: One of the biggest mistakes traders make is reacting to short-term market movements. Don’t let temporary volatility derail your long-term plan.
- **Emotional Discipline**: Keep emotions like fear and greed in check. Long-term trading requires the ability to ignore the “noise” of daily market fluctuations. Stick to your plan and don’t chase after short-term wins.
- **Avoid Overtrading**: Don’t trade just for the sake of trading. Successful long-term traders often make fewer trades and hold positions for longer periods.
---
### **6. Keep Learning and Stay Informed**
- **Continuous Education**: Stay updated on market trends, economic conditions, and new trading strategies. The more you learn, the better decisions you’ll be able to make.
- **Review Your Trades**: Regularly analyze your past trades and portfolio performance. What worked? What didn’t? This feedback loop will help you improve your decision-making over time.
- **Stay Updated on Global Events**: Understanding macroeconomic trends, interest rates, geopolitical events, and industry news is critical for long-term traders. These can significantly impact your investments.
---
### **7. Keep Costs Low**
In long-term trading, transaction costs (like commissions, spreads, and fees) can eat into your profits. Minimize costs to maximize returns.
- **Use Low-Cost Brokers**: Choose brokers with low fees or commission-free trading to keep costs under control.
- **Long-Term Tax Efficiency**: Be mindful of capital gains taxes. In many countries, long-term capital gains (for assets held more than a year) are taxed at a lower rate than short-term capital gains. Plan your trades accordingly to minimize taxes.
---
### **8. Stick to a Long-Term Investment Mindset**
Successful long-term traders aren’t trying to time the market or chase every trend. Instead, they:
- **Trust the Process**: Recognize that there will be both ups and downs in the market. Be prepared for volatility, and stick to your strategy even during tough times.
- **Understand the Power of Patience**: Long-term trading is about building wealth steadily over time. It may not be as thrilling as short-term trading, but it can lead to significant gains when compounded over years.
- **Avoid Trying to "Time" the Market**: Trying to predict short-term market movements is difficult and often counterproductive. Instead, focus on capturing long-term growth and trend-following.
---
### **9. Monitor and Adjust When Necessary**
While patience is crucial, so is flexibility. You should monitor your portfolio periodically and make adjustments as needed:
- **Rebalance Your Portfolio**: Over time, some assets in your portfolio may grow faster than others, causing your initial asset allocation to shift. Periodically rebalance your portfolio to align with your long-term goals.
- **Adapt to Changing Conditions**: The world changes, and so do markets. Stay open to adjusting your strategy if you notice shifts in market conditions, economic trends, or your personal financial situation.
---
### **10. Stay Disciplined in Your Approach**
- **Avoid the Urge to “Time the Market”**: It’s nearly impossible to predict short-term price movements. Trust your long-term plan and make decisions based on sound analysis, not market noise.
- **Stay Committed**: Long-term profitability requires consistency. Stick to your strategy, keep learning, and be disciplined.
---
### Conclusion:
**Long-term trading** is about building wealth gradually through informed decisions, patience, and proper risk management. It’s not about chasing short-term gains but about being consistent in your approach, staying disciplined, and letting your investments grow over time. With the right mindset and strategy, you can achieve consistent profitability in the long run.

learn option trading and become profitable ?Learning **options trading** and becoming profitable involves understanding several key concepts, strategies, and risk management techniques. It’s a skill that requires time, practice, and the ability to control emotions. Here's a step-by-step guide to get started and increase your chances of profitability in options trading:
---
### **Step 1: Understand the Basics of Options**
Before jumping into trading, you need to grasp the fundamental concepts of options:
1. **What Are Options?**
- **Call Option**: A contract that gives you the right (but not the obligation) to **buy** a stock at a specific price (strike price) before a certain expiration date.
- **Put Option**: A contract that gives you the right (but not the obligation) to **sell** a stock at a specific price before a certain expiration date.
2. **Key Terms**:
- **Strike Price**: The price at which the option holder can buy (for calls) or sell (for puts) the underlying asset.
- **Expiration Date**: The date the option expires. After this date, the option is no longer valid.
- **Premium**: The price paid for the option, which is a combination of intrinsic value and time value.
- **In-the-Money (ITM)**: When the option has intrinsic value. For call options, it means the stock price is above the strike price. For put options, it means the stock price is below the strike price.
- **Out-of-the-Money (OTM)**: When the option has no intrinsic value. For calls, the stock price is below the strike price. For puts, the stock price is above the strike price.
- **At-the-Money (ATM)**: When the stock price is equal or close to the strike price.
---
### **Step 2: Learn Different Option Strategies**
Options trading offers a variety of strategies. Start by learning basic strategies before moving on to more advanced ones:
1. **Basic Strategies**:
- **Buying Calls**: Used when you expect the price of the underlying asset to rise.
- **Buying Puts**: Used when you expect the price of the underlying asset to fall.
- **Covered Call**: Involves owning the underlying stock and selling a call option. It's used to generate income on stocks you already own, especially if you think the stock will not rise significantly.
- **Protective Put**: Buying a put option to protect against a decline in the value of a stock you own (like an insurance policy).
2. **Intermediate Strategies**:
- **Vertical Spreads**: Involves buying and selling options of the same type (calls or puts) with different strike prices but the same expiration. Examples include **bull call spreads** and **bear put spreads**.
- **Straddle and Strangle**: Used when you expect large price movements, but are unsure of the direction. You buy both call and put options on the same asset with the same expiration date.
3. **Advanced Strategies**:
- **Iron Condor**: A strategy involving multiple strikes and different types of options to profit from low volatility in the underlying asset.
- **Butterfly Spread**: A strategy with limited risk and reward, used when you expect low volatility in the asset.
---
### **Step 3: Understand Risk Management**
Options can be highly volatile and risky, so managing risk is crucial. Here are some tips:
1. **Position Sizing**: Never risk more than you can afford to lose. Use position sizing to manage the amount of capital you’re willing to put at risk in any trade.
2. **Use Stop-Loss Orders**: Implement stop-loss orders or exit strategies to limit your losses if the trade goes against you.
3. **Risk-Reward Ratio**: Make sure that for every unit of risk, you're potentially making a greater reward. A common risk-to-reward ratio is 1:3, meaning for every $1 at risk, you should aim for a $3 reward.
---
### **Step 4: Develop a Trading Plan**
A well-structured trading plan is essential for long-term success:
1. **Define Your Goals**: Are you trading options for income, capital appreciation, or hedging? Define your objectives clearly.
2. **Identify Your Trading Style**: Decide if you want to be a day trader (short-term) or a swing trader (medium-term). Your strategy will depend on this.
3. **Stick to Your Strategy**: Avoid impulsive decisions or “chasing” the market. Stick to the rules of your strategy and trade according to your plan.
4. **Keep Records**: Maintain a trading journal to track your trades, profits, losses, mistakes, and successes. This will help you analyze your performance and improve.
---
### **Step 5: Paper Trade First**
Before you risk real money, **practice with a simulated account** (paper trading). Many brokers offer demo accounts where you can practice trading options without real financial risk.
- **Simulate Real Trades**: Execute mock trades with no real capital on the line. This will allow you to familiarize yourself with how options work and test different strategies.
- **Evaluate Results**: After several months of paper trading, evaluate your results and refine your strategies.
---
### **Step 6: Start Trading with Real Money**
Once you’re confident in your strategy and risk management, start trading with real money. Begin with small positions and gradually increase your exposure as you gain experience.
1. **Start Small**: Begin with a small percentage of your capital to minimize the risk while you’re learning.
2. **Focus on Liquid Options**: Trade options with high liquidity to ensure you can enter and exit positions smoothly without significant slippage.
3. **Monitor Volatility**: Volatility can impact option pricing. Keep an eye on volatility metrics like the VIX and adjust your strategies accordingly.
---
### **Step 7: Keep Learning and Improving**
Options trading is a continuous learning process. The more you trade, the better you will get at understanding the nuances of the market.
1. **Study Market Conditions**: Understand how different market conditions (bullish, bearish, sideways) affect option prices.
2. **Stay Updated**: Keep learning through books, online courses, webinars, and forums to improve your skills.
3. **Review and Adapt**: Regularly review your trades and adapt your strategies based on your experiences.
---
### Common Mistakes to Avoid:
- **Overleveraging**: Avoid using too much leverage, as options can be highly risky and you could lose your entire investment quickly.
- **Not Using Stop-Losses**: Don’t let emotions drive your trading. Always use stop-losses to protect your capital.
- **Chasing the Market**: Don’t jump into trades based on FOMO (fear of missing out). Wait for the right setup based on your strategy.
- **Ignoring Implied Volatility**: Always be aware of implied volatility before making option trades, as it impacts option pricing.
---
### Conclusion:
To become profitable in options trading, you need to **understand the fundamentals**, develop a solid **trading plan**, practice with **paper trading**, and apply **risk management** techniques. Start with basic strategies, gradually advance to more complex ones, and always be willing to adapt based on your experiences. The key to success in options trading is continuous learning, patience, and disciplined execution.

what is Database trading ?**Database trading** refers to a type of algorithmic trading that relies on vast amounts of historical and real-time market data, often stored and analyzed in databases, to identify patterns and make trading decisions. It uses the power of **data-driven strategies** to execute trades automatically based on specific criteria derived from the analysis of data stored in databases.
Key aspects of database trading:
### 1. **Data Collection & Storage**:
- Traders collect large datasets from various sources, including historical price data, order book data, economic indicators, news, social media, etc.
- This data is stored in **databases** (such as SQL databases, NoSQL databases, or data warehouses) to be processed and analyzed later.
### 2. **Database Management**:
- The data needs to be efficiently managed and organized in a way that it can be easily accessed, queried, and processed. Databases provide this structure and support for quick access to the data for analysis.
### 3. **Backtesting Strategies**:
- One of the main uses of databases in trading is **backtesting**. Traders can test their trading strategies on historical data stored in the database to see how well they would have performed in the past before applying them in live markets.
### 4. **Algorithmic Trading**:
- Once a strategy is backtested, the data can be used to program **trading algorithms** that will analyze the data in real-time and execute trades based on predefined rules and conditions.
- These algorithms may rely on factors like price movements, technical indicators, market sentiment, and volume data, all of which are stored in databases.
### 5. **Real-Time Trading**:
- As market conditions change, real-time data is continuously fed into the database. Trading algorithms use this live data to make decisions and execute trades automatically, without the need for human intervention.
### 6. **Machine Learning and Data Mining**:
- Advanced database trading can incorporate **machine learning models** and **data mining techniques** to identify hidden patterns in large datasets.
- These models are trained on historical data stored in databases and can adapt to changing market conditions, making decisions that might not be obvious to human traders.
### 7. **Risk Management**:
- Database trading often includes built-in risk management tools. By tracking data points such as volatility, price fluctuations, and other risk factors, algorithms can manage positions, set stop losses, and protect against significant losses.
### Benefits of Database Trading:
- **Speed and Automation**: Database trading systems can process and execute trades much faster than human traders.
- **Data-Driven Decisions**: The use of large datasets allows for decisions based on comprehensive information rather than intuition or limited data.
- **Backtesting and Optimization**: Traders can optimize strategies and assess potential risks using historical data before live trading.
In summary, **database trading** is about using sophisticated data management and algorithmic trading systems to make informed, automated trading decisions. It enables traders to leverage vast datasets and computational power to identify profitable trading opportunities and execute them efficiently.

What is volatility in trading and how to deal with it ?**Volatility** in trading refers to the degree of price fluctuations in a market or security over a specific period of time. It indicates how much and how quickly the price of an asset (like stocks, currencies, or commodities) can change. High volatility means large price movements, while low volatility suggests relatively stable prices.
### Key Aspects of Volatility:
1. **Price Fluctuations**: Volatility measures how much an asset's price increases or decreases. For example, if a stock moves 5% up and down within a day, it’s considered volatile.
2. **Market Sentiment**: Increased volatility often reflects uncertainty or strong emotions in the market, like fear, excitement, or speculation.
3. **Volatility Index (VIX)**: The **VIX** is a popular measure of market volatility, often referred to as the "fear index." It tracks expectations of future volatility based on S&P 500 index options.
### Types of Volatility:
1. **Historical Volatility**: Based on past price movements of an asset. It’s calculated by measuring the standard deviation of price changes over a defined period.
2. **Implied Volatility**: Derived from options prices, it reflects the market’s expectations of future volatility. High implied volatility often means the market anticipates large price moves.
### How to Deal with Volatility in Trading:
#### 1. **Risk Management**:
- **Set Stop-Loss Orders**: Protect yourself from large, unexpected price swings by placing stop-loss orders. This automatically sells your position if the price drops beyond a specified point.
- **Position Sizing**: Trade smaller positions when the market is highly volatile to limit potential losses.
- **Diversify**: Spreading your investments across different assets or markets can reduce overall portfolio volatility.
#### 2. **Use Volatility Indicators**:
- **Average True Range (ATR)**: This indicator measures market volatility by calculating the average range of price movement over a certain period. A higher ATR indicates more volatility.
- **Bollinger Bands**: These bands expand and contract based on volatility. When the market is more volatile, the bands widen; when it’s less volatile, the bands narrow. Traders use this to gauge price momentum and potential breakouts.
#### 3. **Trade with a Plan**:
- **Stay Disciplined**: Stick to your trading plan and avoid impulsive decisions. Volatile markets can lead to emotional trading, so having a well-defined plan helps you stay calm and make objective decisions.
- **Know Your Time Frame**: Volatility can affect short-term traders more dramatically than long-term investors. If you're a day trader, be prepared for fast changes, whereas long-term investors may benefit from ignoring short-term price swings.
#### 4. **Volatility Strategies**:
- **Straddle and Strangle (Options Trading)**: These strategies take advantage of expected high volatility. They involve buying both a call option (betting on a price increase) and a put option (betting on a price decrease). This way, you profit if the price moves significantly in either direction.
- **Scalping**: This strategy involves making numerous small trades throughout the day to capitalize on minor price movements. It requires quick decision-making and tight risk management.
#### 5. **Avoid Overtrading**:
- **Stay Calm**: High volatility can cause market noise, tempting traders to take excessive trades. Avoid overtrading by sticking to your strategy and waiting for clear opportunities.
- **Monitor News**: Volatility can be driven by news events, such as earnings reports or geopolitical events. Stay informed about potential sources of market-moving news and adjust your trading accordingly.
#### 6. **Hedging**:
- **Options and Futures**: Traders can hedge against volatility using options or futures contracts, which allow them to protect existing positions from adverse price movements. Hedging involves taking an opposite position to offset potential losses.
#### 7. **Adapt to Market Conditions**:
- Volatility can change over time, so it’s important to adjust your strategy to the current market environment. In highly volatile markets, it may be wise to use conservative strategies, while in calmer periods, more aggressive strategies could be appropriate.
---
### Summary:
Volatility is a natural part of financial markets, and while it can present both risks and opportunities, it requires careful management. By using tools like stop-loss orders, volatility indicators, and risk management strategies, traders can protect themselves from excessive losses while still capitalizing on market movements. Understanding volatility and adapting to it based on your trading style—whether you're a short-term trader or long-term investor—is key to managing it effectively.

what is Smart money concept ?The **Smart Money Concept (SMC)** refers to the idea of tracking and following the investment activities and market movements made by experienced, knowledgeable, and well-capitalized investors or institutions. These investors are often referred to as "smart money" because they have access to sophisticated research, tools, and insights, giving them an edge over the average investor. The concept revolves around the belief that if you can identify where these smart money players are moving, you can potentially profit by mimicking their strategies.
Here are key points that define the **Smart Money Concept**:
1. **Institutional Investors**: Large banks, hedge funds, mutual funds, and other big financial entities with substantial capital are considered "smart money" because they can move markets with their decisions.
2. **Market Indicators**: Traders and investors who follow SMC track key market indicators, such as institutional buying/selling patterns, volume spikes, order flow, and other technical analysis tools, to identify where smart money is moving.
3. **Price Action and Market Structure**: A lot of SMC analysis focuses on reading price action and understanding the structure of markets to interpret the intentions of these big players.
4. **Contrarian Strategy**: The Smart Money Concept sometimes involves a contrarian approach—buying when smart money is accumulating assets (often before the general public catches on) and selling when smart money is offloading (often before prices fall).
5. **Risk Management**: Those who follow the Smart Money Concept emphasize understanding the risks associated with following institutional investors and avoid blindly mimicking their moves without conducting independent analysis.

Rvnl ltdLet's conduct a **technical analysis** of **Rail Vikas Nigam Ltd. (RVNL)**, which is involved in the development of railway infrastructure projects in India.
---
### **Technical Analysis of Rail Vikas Nigam Ltd. (RVNL)**
#### **1. Support and Resistance Levels**
- **Support Levels:**
- Support is where the stock tends to find buying interest and reverse from a downtrend.
- **Example Support Levels:** If RVNL has previously bounced near ₹45, ₹48, or ₹50, these could be important support levels to monitor.
- A breach of these support levels could indicate a possible further downtrend.
- **Resistance Levels:**
- Resistance is where the stock faces selling pressure and struggles to move higher.
- **Example Resistance Levels:** Levels such as ₹55, ₹58, or ₹60 could be areas of resistance for the stock.
- A breakout above these resistance levels could signal bullish momentum and the potential for further upside.
#### **2. Moving Averages (MA)**
- **50-day Moving Average (MA):**
- The 50-day MA is an important short-term trend indicator. If RVNL is trading above this moving average, it indicates a bullish short-term trend.
- **Example:** If RVNL is trading at ₹53 and the 50-day MA is ₹51, it indicates a bullish short-term outlook.
- **200-day Moving Average (MA):**
- The 200-day MA provides insights into the long-term trend. A price above the 200-day MA suggests long-term bullishness.
- **Example:** If RVNL is at ₹53 and the 200-day MA is ₹48, it signifies that the long-term trend is bullish.
#### **3. RSI (Relative Strength Index)**
- **RSI Levels:**
- **Above 70:** The stock may be overbought, indicating potential for a pullback or consolidation.
- **Below 30:** The stock may be oversold, suggesting that it could be due for a rebound or upward reversal.
- **Current Example:**
- If the RSI is **above 70**, it suggests RVNL could be overbought, and a price pullback might occur.
- If the RSI is **below 30**, it could signal that RVNL is oversold and may reverse to the upside.
#### **4. MACD (Moving Average Convergence Divergence)**
- **Bullish Signal:** When the MACD line crosses above the signal line, it is a bullish signal, suggesting that upward momentum may continue.
- **Bearish Signal:** When the MACD line crosses below the signal line, it is a bearish signal, suggesting downward pressure or consolidation.
- **Current Example:**
- If the MACD line is above the signal line, it’s a bullish signal for RVNL, indicating the possibility of further upside.
- If the MACD line is below the signal line, it may indicate a bearish trend or a period of consolidation.
#### **5. Volume Analysis**
- **Increasing Volume:** Rising prices accompanied by increasing volume confirm that the trend is supported by strong buying interest.
- **Decreasing Volume:** If the price rises or falls with decreasing volume, it may indicate a weakening trend or lack of conviction.
- **Current Example:**
- If RVNL is rising with increasing volume, it confirms that the uptrend is strong.
- If RVNL is rising with declining volume, it could signal a potential reversal or that the momentum is fading.
#### **6. Candlestick Patterns**
- **Bullish Patterns:**
- Patterns such as **Bullish Engulfing**, **Morning Star**, or **Hammer** near support levels suggest a potential reversal to the upside.
- **Bearish Patterns:**
- Patterns like **Shooting Star**, **Bearish Engulfing**, or **Evening Star** near resistance levels suggest that the price might reverse to the downside.
- **Current Example:**
- A **Bullish Engulfing** pattern near ₹50 could signal a potential upward reversal.
- A **Shooting Star** near ₹55 could indicate potential resistance and a reversal downward.
#### **7. Fibonacci Retracement Levels**
- **Fibonacci Levels** are useful for identifying potential retracement levels during a correction. The key Fibonacci levels are **23.6%, 38.2%, 50%, and 61.8%**.
- **Current Example:**
- If RVNL has moved from ₹45 to ₹55, the key Fibonacci retracement levels to watch for support during a pullback would be:
- **23.6% retracement** around ₹53
- **38.2% retracement** around ₹51.5
- **50% retracement** around ₹50
- **61.8% retracement** around ₹48.5
These levels can serve as potential support if the stock faces a price correction.
---
**Disclaimer:**
- I am not a SEBI-registered professional or licensed financial advisor.
- This analysis is based on historical price data, technical indicators, and general market trends.
- Any decisions you make based on this information are entirely at your own risk. Please consult with a licensed financial advisor before making any investment decisions.
- Technical analysis cannot guarantee future results, and stock prices can be influenced by numerous factors, including news, economic data, and other market developments.

devyani international ltd.Let's conduct a **technical analysis** of **Devyani International Ltd.** (Devyani), which is one of the largest franchisees of Yum! Brands in India, operating popular brands like Pizza Hut, KFC, and Taco Bell.
---
### **Technical Analysis of Devyani International Ltd.**
#### **1. Support and Resistance Levels**
- **Support Levels:**
- Support levels are where the stock has previously found a floor or a reversal point.
- **Example Support Levels:** If Devyani has bounced at ₹175, ₹180, or ₹185 in recent times, these levels are key areas to monitor.
- A drop below these levels could signal a bearish trend or a deeper correction.
- **Resistance Levels:**
- Resistance is where the stock faces selling pressure and struggles to move higher.
- **Example Resistance Levels:** Levels such as ₹210, ₹220, or ₹230 could be strong resistance levels for the stock.
- A breakout above these levels could indicate further bullish momentum.
#### **2. Moving Averages (MA)**
- **50-day Moving Average (MA):**
- The 50-day MA is a short-term trend indicator. If the stock is trading above the 50-day MA, it indicates short-term bullishness.
- **Example:** If Devyani is trading at ₹200 and the 50-day MA is ₹190, it suggests short-term upward momentum.
- **200-day Moving Average (MA):**
- The 200-day MA represents the long-term trend. If the stock is above the 200-day MA, it suggests a long-term bullish trend.
- **Example:** If the stock is at ₹200 and the 200-day MA is ₹180, it signals the stock is in a long-term bullish phase.
#### **3. RSI (Relative Strength Index)**
- **RSI Levels:**
- **Above 70:** This suggests the stock may be overbought, indicating that a pullback or consolidation might occur.
- **Below 30:** This suggests the stock may be oversold, potentially indicating a buying opportunity.
- **Current Example:**
- If the RSI is **above 70**, it suggests that Devyani may be overbought, which could result in a pullback or correction.
- If the RSI is **below 30**, it may indicate that the stock is oversold, and it could reverse or bounce back.
#### **4. MACD (Moving Average Convergence Divergence)**
- **Bullish Signal:** A bullish signal occurs when the MACD line crosses above the signal line, suggesting potential upward momentum.
- **Bearish Signal:** A bearish signal occurs when the MACD line crosses below the signal line, indicating a potential downward movement.
- **Current Example:**
- If the MACD line is **above the signal line**, it suggests bullish momentum for Devyani.
- If the MACD line is **below the signal line**, it suggests bearish pressure and potential downward movement.
#### **5. Volume Analysis**
- **Increasing Volume:** If the stock is moving upwards with increasing volume, this confirms strong buying interest and a healthy trend.
- **Decreasing Volume:** If the price is moving up or down with decreasing volume, it indicates a lack of conviction behind the move.
- **Current Example:**
- If Devyani is rising with increasing volume, it indicates that the buying interest is strong and supports the bullish trend.
- If the stock rises with decreasing volume, it might indicate weakening momentum or a possible reversal.
#### **6. Candlestick Patterns**
- **Bullish Patterns:**
- Patterns like **Bullish Engulfing**, **Morning Star**, or **Hammer** near support levels signal a potential upward reversal.
- **Bearish Patterns:**
- Patterns like **Shooting Star**, **Bearish Engulfing**, or **Evening Star** near resistance levels signal a potential downward reversal.
- **Current Example:**
- A **Bullish Engulfing** pattern near ₹190 could indicate a potential reversal to the upside.
- A **Shooting Star** pattern near ₹220 could indicate a potential reversal to the downside.
#### **7. Fibonacci Retracement Levels**
- **Fibonacci Levels** help identify potential support and resistance during a pullback. The key levels are **23.6%, 38.2%, 50%, 61.8%**.
- **Current Example:**
- If Devyani has moved from ₹180 to ₹220, you can check the Fibonacci retracement levels for support during a pullback:
- **23.6% retracement** around ₹210
- **38.2% retracement** around ₹200
- **50% retracement** around ₹190
- **61.8% retracement** around ₹180
These Fibonacci levels can serve as potential support levels if the stock faces a price correction.
---
**Disclaimer:**
- I am not a SEBI-registered professional or licensed financial advisor.
- This analysis is based on historical price data, technical indicators, and general market trends.
- Any decisions you make based on this information are entirely at your own risk. Please consult a licensed financial advisor before making any investment decisions.
- Technical analysis cannot guarantee future results, and stock prices can be influenced by numerous factors, including news, economic data, and other market developments.

interlobe aviation ltdLet's conduct a **technical analysis** of **InterGlobe Aviation Ltd.** (IndiGo), which is the parent company of IndiGo Airlines. Here's a detailed breakdown of how you can analyze the stock using key technical indicators.
---
### **Technical Analysis of InterGlobe Aviation Ltd. (IndiGo)**
#### **1. Support and Resistance Levels**
- **Support Levels:**
- Support is where the stock has previously bounced back from, indicating a level where buying interest has emerged.
- **Example Support Levels:** If InterGlobe Aviation has recently found support near ₹2,050, ₹2,100, or ₹2,150, these levels are important to watch.
- A drop below these levels could indicate a potential bearish move or a deeper correction.
- **Resistance Levels:**
- Resistance is where selling pressure has previously emerged, preventing the stock from moving higher.
- **Example Resistance Levels:** Levels like ₹2,250, ₹2,300, or ₹2,350 could be areas of resistance for the stock.
- A breakout above these levels could indicate further bullish momentum and a potential continuation of the uptrend.
#### **2. Moving Averages (MA)**
- **50-day Moving Average (MA):**
- The 50-day MA helps identify the short-term trend. If the stock is trading above this moving average, it suggests bullish momentum.
- **Example:** If InterGlobe is trading at ₹2,150 and the 50-day MA is ₹2,100, it signals short-term bullish momentum.
- **200-day Moving Average (MA):**
- The 200-day MA is used to gauge long-term trends. If the stock is above this MA, it suggests a long-term bullish trend.
- **Example:** If the stock is at ₹2,150 and the 200-day MA is ₹2,100, it indicates that the long-term trend is positive.
#### **3. RSI (Relative Strength Index)**
- **RSI Levels:**
- **Above 70:** The stock may be overbought, indicating a potential pullback or consolidation.
- **Below 30:** The stock may be oversold, suggesting a potential buying opportunity for a reversal.
- **Current Example:**
- If the RSI is **above 70**, it suggests that InterGlobe might be overbought, signaling a possible price correction.
- If the RSI is **below 30**, it indicates the stock might be oversold, potentially signaling a buying opportunity for a rebound.
#### **4. MACD (Moving Average Convergence Divergence)**
- **Bullish Signal:** A bullish crossover occurs when the MACD line crosses above the signal line, suggesting an upward price movement.
- **Bearish Signal:** A bearish crossover occurs when the MACD line crosses below the signal line, signaling a potential downward move.
- **Current Example:**
- If the MACD line is above the signal line, this is a bullish signal for InterGlobe Aviation, suggesting the potential for upward movement.
- If the MACD line is below the signal line, it may indicate a bearish trend or consolidation.
#### **5. Volume Analysis**
- **Increasing Volume:** Rising prices accompanied by increasing volume typically signal strong buying interest and confirmation of the trend.
- **Decreasing Volume:** If the price moves up or down with decreasing volume, it suggests that the move lacks conviction.
- **Current Example:**
- If InterGlobe is rising with increasing volume, it supports the bullish trend.
- If the stock rises or falls with declining volume, it might suggest that the trend is weakening or about to reverse.
#### **6. Candlestick Patterns**
- **Bullish Patterns:**
- Patterns like **Bullish Engulfing**, **Morning Star**, or **Hammer** near support levels could indicate potential price reversals to the upside.
- **Bearish Patterns:**
- Patterns like **Shooting Star**, **Bearish Engulfing**, or **Evening Star** near resistance levels could suggest a potential reversal to the downside.
- **Current Example:**
- A **Bullish Engulfing** pattern at ₹2,100 (support) could signal a potential upward move.
- A **Shooting Star** pattern near ₹2,250 (resistance) might indicate a possible reversal downward.
#### **7. Fibonacci Retracement Levels**
- **Fibonacci Retracement Levels** are used to identify potential support and resistance levels during a pullback. Key levels include **23.6%, 38.2%, 50%, 61.8%**.
- **Current Example:**
- If InterGlobe has moved from ₹2,000 to ₹2,300, key Fibonacci retracement levels would be:
- **23.6% retracement** around ₹2,250
- **38.2% retracement** around ₹2,200
- **50% retracement** around ₹2,150
- **61.8% retracement** around ₹2,100
These levels can act as support if the stock pulls back, or as resistance if the stock faces a correction within an uptrend.
---
**Disclaimer:**
- I am not a SEBI-registered professional or licensed financial advisor.
- The analysis and recommendations provided here are based on historical price data, technical indicators, and market trends.
- Any decisions you make based on this information are entirely at your own risk. Please consult with a licensed financial advisor before making any investment decisions.
- Technical analysis is not a guarantee of future performance, and stock prices can be affected by various factors including news, economic data, and other market influences.

BajFinanceLet's perform a **technical analysis** of **Bajaj Finserv Ltd.** (Bajaj Fin) based on key technical indicators. You can apply these guidelines to real-time data on a charting platform.
---
### **Technical Analysis of Bajaj Finserv Ltd.**
#### **1. Support and Resistance Levels**
- **Support Levels:**
- Support is the level where the stock has historically reversed from a downtrend. It's a price range where buying interest has previously emerged.
- **Example Support Levels:** If Bajaj Fin has recently bounced at ₹1,400, ₹1,450, or ₹1,500, these may be key support levels to watch.
- If the price is approaching these levels again and shows signs of bouncing, they could be good buying zones.
- **Resistance Levels:**
- Resistance is a price level where selling pressure has emerged, preventing further price movement upwards.
- **Example Resistance Levels:** Look for levels like ₹1,600, ₹1,650, or ₹1,700, where Bajaj Finserv has faced difficulty moving higher.
- A breakout above these resistance levels could signal continued upward momentum.
#### **2. Moving Averages (MA)**
- **50-day Moving Average (MA):**
- The 50-day MA is used to gauge short-term trends. If the stock is above this moving average, it generally indicates short-term bullishness.
- **Example:** If Bajaj Fin is trading at ₹1,500 and the 50-day MA is ₹1,470, this signals short-term bullish momentum.
- **200-day Moving Average (MA):**
- The 200-day MA is typically used for assessing long-term trends. If the stock is trading above the 200-day MA, it suggests a long-term bullish trend.
- **Example:** If Bajaj Fin is at ₹1,500 and the 200-day MA is at ₹1,450, it indicates long-term bullish sentiment.
#### **3. RSI (Relative Strength Index)**
- **RSI Levels:**
- **Above 70:** The stock may be overbought, indicating that a pullback or correction could occur soon.
- **Below 30:** The stock may be oversold, suggesting it could be due for an upward reversal.
- **Current Example:**
- If the RSI is **above 70**, Bajaj Finserv might be overbought, suggesting a possible short-term pullback.
- If the RSI is **below 30**, it signals the stock is oversold, potentially indicating a buying opportunity for a rebound.
#### **4. MACD (Moving Average Convergence Divergence)**
- **Bullish Signal:** A bullish signal is when the MACD line crosses above the signal line, suggesting upward momentum.
- **Bearish Signal:** A bearish signal is when the MACD line crosses below the signal line, indicating downward momentum.
- **Current Example:**
- If the MACD line is above the signal line, it’s a bullish signal for Bajaj Finserv, implying potential upward movement.
- If the MACD line is below the signal line, it may indicate a bearish trend or consolidation phase.
#### **5. Volume Analysis**
- **Increasing Volume:** If the stock price rises with increasing volume, it confirms that the trend is strong and supported by buying interest.
- **Decreasing Volume:** If the stock price is moving up or down with decreasing volume, it suggests weakening momentum.
- **Current Example:**
- If Bajaj Fin is rising with increasing volume, this suggests strong buying interest, supporting the uptrend.
- If the stock is rising with declining volume, it may indicate that the rally is losing steam, possibly signaling a reversal or consolidation.
#### **6. Candlestick Patterns**
- **Bullish Patterns:**
- Look for **Bullish Engulfing**, **Morning Star**, or **Hammer** patterns near support levels to signal a potential upward reversal.
- **Bearish Patterns:**
- Look for **Shooting Star**, **Bearish Engulfing**, or **Evening Star** patterns near resistance levels to signal potential downward reversals.
- **Current Example:**
- If a **Bullish Engulfing** pattern forms near ₹1,450 (support), it might indicate an upcoming upward move.
- If a **Shooting Star** forms near ₹1,650 (resistance), it could indicate a potential reversal downward.
#### **7. Fibonacci Retracement Levels**
- **Fibonacci Levels** are used to identify key support and resistance levels during a price correction or pullback. Key levels are **23.6%, 38.2%, 50%, 61.8%**.
- **Current Example:**
- If Bajaj Finserv has moved from ₹1,400 to ₹1,600, key Fibonacci retracement levels would be:
- **23.6% retracement** around ₹1,570
- **38.2% retracement** around ₹1,540
- **50% retracement** around ₹1,500
- **61.8% retracement** around ₹1,470
These levels could act as support during a pullback in an uptrend.
---
**Disclaimer:**
- I am not a SEBI-registered professional or licensed financial advisor.
- The analysis provided is based on historical price data, technical indicators, and general market trends.
- Any action you take based on this analysis is at your own risk. Please consult a licensed financial advisor before making any investment decisions.
- Technical analysis does not guarantee future results, and market movements are influenced by various factors, including news, economic events, and market sentiment.

Gail Let's perform a **technical analysis** of **GAIL India Ltd.** (GAIL) based on key technical indicators. Since I don't have real-time market data, I'll guide you through the analysis framework, and you can apply it with the latest data from a charting platform.
---
### **Technical Analysis of GAIL India Ltd.**
#### **1. Support and Resistance Levels**
- **Support Levels:**
- Support levels are price zones where the stock has historically reversed from a downtrend.
- **Example Support Levels:** If GAIL has previously found support at ₹105, ₹100, or ₹95, these are important levels to monitor. A drop below these levels could signal further weakness.
- If the stock is near support and starts to bounce back, this could indicate a potential buying opportunity.
- **Resistance Levels:**
- Resistance is where the stock has faced selling pressure or turned down in the past.
- **Example Resistance Levels:** Look for levels such as ₹120, ₹125, or ₹130, where the stock has previously struggled to move higher.
- A breakout above these levels could signal that the stock is entering a new bullish phase.
#### **2. Moving Averages (MA)**
- **50-day Moving Average (MA):**
- The 50-day MA helps identify the short-term trend. If the stock is above the 50-day MA, it suggests short-term bullish momentum. If below, it suggests short-term bearishness.
- **Example:** If GAIL is trading at ₹110 and the 50-day MA is ₹108, it indicates a short-term bullish trend.
- **200-day Moving Average (MA):**
- The 200-day MA is used to identify the long-term trend. If the stock is trading above the 200-day MA, it indicates a long-term bullish trend.
- **Example:** If the stock is at ₹110 and the 200-day MA is ₹105, it confirms a long-term bullish trend.
#### **3. RSI (Relative Strength Index)**
- **RSI Levels:**
- **Above 70:** The stock may be overbought, indicating a potential pullback or consolidation.
- **Below 30:** The stock may be oversold, suggesting a potential upward reversal.
- **Current Example:**
- If the RSI is **above 70**, GAIL may be overbought and could face a price correction.
- If the RSI is **below 30**, GAIL may be oversold, suggesting the stock could bounce upward.
#### **4. MACD (Moving Average Convergence Divergence)**
- **Bullish Signal:** A bullish crossover occurs when the MACD line crosses above the signal line, indicating a potential upward momentum.
- **Bearish Signal:** A bearish crossover occurs when the MACD line crosses below the signal line, indicating a potential downward move.
- **Current Example:**
- If the MACD is above the signal line, this is a bullish signal for GAIL.
- If the MACD is below the signal line, it might indicate that GAIL could face downward pressure.
#### **5. Volume Analysis**
- **Increasing Volume:** A price move with increasing volume indicates strong buying or selling interest and reinforces the current trend.
- **Decreasing Volume:** If the stock rises or falls on decreasing volume, it may indicate weakening momentum.
- **Current Example:**
- If GAIL is rising with increasing volume, it shows strong support for the upward movement.
- If the stock is moving down with increasing volume, it may indicate a strong downtrend.
#### **6. Candlestick Patterns**
- **Bullish Patterns:**
- **Bullish Engulfing**, **Hammer**, and **Morning Star** patterns at key support levels suggest a potential reversal to the upside.
- **Bearish Patterns:**
- **Shooting Star**, **Bearish Engulfing**, and **Evening Star** patterns at key resistance levels signal a potential reversal to the downside.
- **Current Example:**
- If a **Bullish Engulfing** pattern forms near a support level (like ₹100), it could signal a reversal to the upside.
- If a **Shooting Star** forms near a resistance level (like ₹120), it could indicate a potential downward reversal.
#### **7. Fibonacci Retracement Levels**
- **Fibonacci Retracement Levels** help identify potential support and resistance during price retracements. The key levels are **23.6%, 38.2%, 50%, 61.8%**.
- **Current Example:**
- If GAIL has moved from ₹95 to ₹120, you could check the following Fibonacci levels:
- **23.6% retracement** around ₹115
- **38.2% retracement** around ₹110
- **50% retracement** around ₹105
- **61.8% retracement** around ₹102
These levels can act as potential support if the stock pulls back.
---
**Disclaimer:**
- I am not a SEBI-registered professional or licensed financial advisor.
- All analysis, recommendations, and opinions provided are based on historical price data, patterns, and general market trends.
- Any action you take on the basis of this information is at your own risk. Please consult with a licensed financial advisor before making any investment decisions.
- Technical analysis cannot guarantee future results and may not be accurate in predicting market movements.
- Stock prices and market conditions can be influenced by many factors, including external events, news, and economic data, which are beyond the scope of this analysis.

Veranda learning solutions Let's dive into the **technical analysis** of **Veranda Learning Solutions Ltd.** based on typical technical indicators. Since I don't have live market data, I'll guide you through a structured analysis framework. You can use real-time data from a stock charting tool to apply these indicators.
---
### **Technical Analysis of Veranda Learning Solutions Ltd. (VERANDA)**
#### **1. Support and Resistance Levels**
- **Support Levels:**
- These are price zones where the stock has historically found buying interest or has reversed direction.
- **Example Support Levels:** Look for recent lows. If Veranda Learning has recently bounced at ₹250 or ₹230, these could be key support levels. If the price breaks below these, it may signal further downside risk.
- If the stock is approaching these levels and starts to bounce back, these can act as buy signals.
- **Resistance Levels:**
- Resistance is where the stock has faced selling pressure in the past. If the stock has faced difficulty breaking through ₹280, ₹290, or ₹300, these levels could act as resistance.
- A breakout above these resistance levels could signal strong bullish momentum.
#### **2. Moving Averages (MA)**
- **50-day Moving Average (MA):**
- The 50-day moving average helps assess short-term price trends. If the stock is trading above this level, it generally indicates bullish momentum in the short term.
- **Example:** If the stock is at ₹270 and the 50-day MA is ₹265, this would signal short-term bullishness.
- **200-day Moving Average (MA):**
- The 200-day moving average is used for identifying the long-term trend. If the stock is trading above it, it suggests a long-term bullish trend. If below, the stock may be in a long-term downtrend.
- **Example:** If the stock is at ₹270 and the 200-day MA is at ₹260, it confirms a long-term bullish trend.
#### **3. RSI (Relative Strength Index)**
- **RSI Levels:**
- **Above 70:** Indicates the stock is potentially overbought, suggesting a pullback or consolidation could occur.
- **Below 30:** Indicates the stock is potentially oversold, suggesting it may be due for an upward move or reversal.
- **Current Example:**
- If the RSI is **above 70**, the stock could be in overbought territory, suggesting it might face a correction.
- If the RSI is **below 30**, it suggests oversold conditions, potentially indicating a buying opportunity.
#### **4. MACD (Moving Average Convergence Divergence)**
- **Bullish Signal:** When the MACD line crosses above the signal line, it suggests bullish momentum.
- **Bearish Signal:** When the MACD line crosses below the signal line, it suggests bearish momentum.
- **Current Example:**
- If the MACD is currently above the signal line, it signals potential upward momentum for the stock.
- If the MACD is below the signal line, it might indicate a downtrend or consolidation.
#### **5. Volume Analysis**
- **Increasing Volume:** When the stock rises with increasing volume, it suggests strong buying interest, confirming the trend.
- **Decreasing Volume:** If the stock rises or falls with decreasing volume, it may signal weakening momentum, either bullish or bearish.
- **Current Example:**
- If Veranda Learning is rising with increasing volume, it confirms the strength of the upward move.
- If the stock price rises but volume is decreasing, it could suggest that the rally is losing momentum and may not be sustainable.
#### **6. Candlestick Patterns**
- **Bullish Patterns:** Look for **Hammer**, **Bullish Engulfing**, or **Morning Star** patterns during a downtrend. These could signal a reversal to the upside.
- **Bearish Patterns:** Patterns like **Shooting Star**, **Evening Star**, or **Bearish Engulfing** near resistance could signal a reversal to the downside.
- **Current Example:**
- If a **Bullish Engulfing** pattern forms near a support level, it may signal a reversal to the upside.
- If a **Shooting Star** or **Evening Star** forms near a resistance level, it could indicate a potential reversal to the downside.
#### **7. Fibonacci Retracement Levels**
- Fibonacci retracement levels are often used to identify potential support or resistance areas during pullbacks or price corrections. Key levels include **23.6%, 38.2%, 50%,** and **61.8%**.
- **Current Example:**
- If the stock has moved from ₹230 to ₹300, check for retracement levels. The **38.2% retracement** might be around ₹280, and the **50% retracement** could be around ₹265.
- These levels could act as support during a pullback if the stock is in an uptrend.
---
**Disclaimer:**
- I am not a SEBI-registered professional or licensed financial advisor.
- All analysis, recommendations, and opinions provided are based solely on historical price data, patterns, and general market trends.
- Any action you take on the basis of this information is at your own risk. Please consult with a licensed financial advisor before making any investment decisions.
- Technical analysis cannot guarantee future results and may not be accurate in predicting market movements.
- Market conditions and stock prices can be influenced by many factors, including external events, news, and economic data, which are beyond the scope of this analysis.
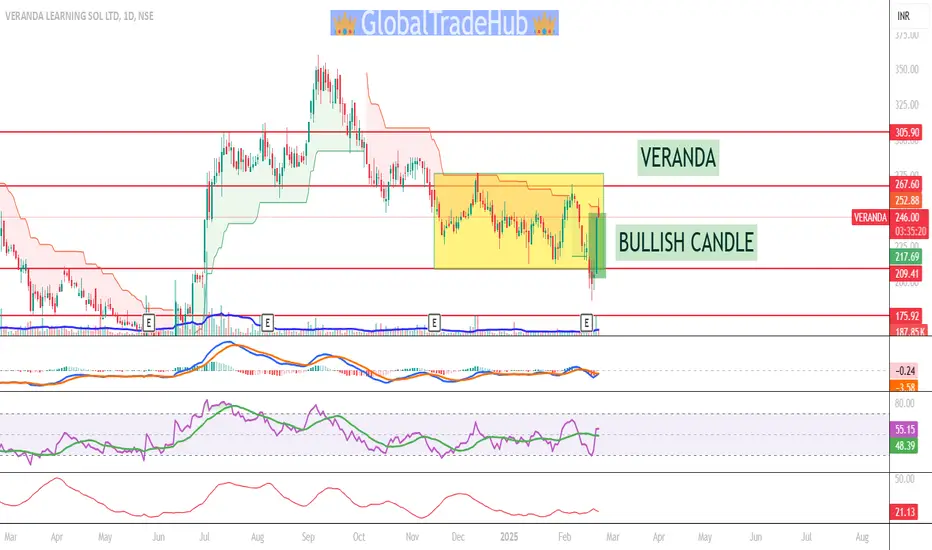
MotilalofsLet's dive into the **technical analysis** for **Motilal Oswal Financial Services Ltd. (MotilalOswal)** based on typical indicators and technical tools. Again, since I don’t have real-time market data, the analysis provided below is a general framework based on how you can approach the analysis.
---
### **Technical Analysis of Motilal Oswal Financial Services Ltd. (MotilalOswal)**
#### **1. Support and Resistance Levels**
- **Support Levels:**
- These are areas where the stock has historically found buying interest and reversed direction. Look for recent lows.
- **Example Support Levels:** If Motilal Oswal recently bounced around ₹1,000 or ₹950, these could be seen as key support levels.
- A breakdown below these support levels could signal further weakness and a potential downtrend.
- **Resistance Levels:**
- Resistance levels are price zones where selling pressure has historically emerged. If the stock has had difficulty breaking through ₹1,150 or ₹1,200 recently, those could act as resistance zones.
- If the stock manages to break above these levels with strong volume, it may signal a potential upward breakout.
#### **2. Moving Averages (MA)**
- **50-day MA:** The 50-day moving average helps assess the short-term trend. If the stock is trading above this level, it indicates short-term bullishness. If below, it may indicate short-term bearish momentum.
- **Example:** If the stock is at ₹1,100 and the 50-day MA is ₹1,090, it suggests short-term bullish momentum.
- **200-day MA:** The 200-day moving average is considered a long-term trend indicator. If the stock is trading above it, it indicates a bullish long-term trend; if below, it signals a bearish trend.
- **Example:** If the stock is at ₹1,100 and the 200-day MA is ₹1,080, it indicates a bullish long-term trend.
#### **3. RSI (Relative Strength Index)**
- **RSI Levels:**
- **Above 70:** The stock is potentially overbought, indicating that it may face a pullback or consolidation.
- **Below 30:** The stock is potentially oversold, suggesting it may be due for a reversal or upward movement.
- **Current Example:**
- If the RSI is at **75**, the stock might be in overbought territory, signaling a potential pullback.
- If the RSI is at **25**, the stock could be oversold, indicating a possible bounce or reversal to the upside.
#### **4. MACD (Moving Average Convergence Divergence)**
- **Bullish Cross:** When the MACD line crosses above the signal line, it typically indicates an upward trend or buying signal.
- **Bearish Cross:** When the MACD line crosses below the signal line, it signals a potential downtrend or selling signal.
- **Current Example:**
- If the MACD line is above the signal line, it suggests a bullish trend for Motilal Oswal.
- If the MACD line crosses below the signal line, it may signal a bearish move.
#### **5. Volume Analysis**
- **Increasing Volume:** When the stock rises with increasing volume, it suggests strong buying interest, confirming the price movement.
- **Decreasing Volume:** If the stock rises or falls with decreasing volume, it may signal a weakening trend.
- **Current Example:**
- If the stock is pushing higher with increasing volume, it indicates strength in the upward move.
- If the stock is declining with rising volume, it could indicate that the downtrend is strong.
#### **6. Candlestick Patterns**
- **Bullish Patterns:** Patterns like **Hammer**, **Bullish Engulfing**, and **Morning Star** during a downtrend suggest potential reversals to the upside.
- **Bearish Patterns:** Patterns like **Shooting Star**, **Evening Star**, and **Bearish Engulfing** during an uptrend signal potential reversals to the downside.
- **Current Example:**
- If a **Bullish Engulfing** pattern is formed near support, it could suggest a reversal to the upside.
- If a **Shooting Star** or **Evening Star** pattern is formed near resistance, it could signal a reversal to the downside.
#### **7. Fibonacci Retracement Levels**
- Fibonacci levels are used to identify potential support or resistance areas during a pullback or retracement. The key levels are 23.6%, 38.2%, 50%, and 61.8%.
- **Current Example:**
- If the stock has moved from ₹950 to ₹1,150, check for pullbacks to the **38.2%** retracement level around ₹1,080 or **50%** retracement around ₹1,050. These could act as support zones for the stock to bounce back.
---
**Disclaimer:**
- I am not a SEBI-registered professional or licensed financial advisor.
- All analysis, recommendations, and opinions provided are based solely on historical price data, patterns, and general market trends.
- Any action you take on the basis of this information is at your own risk. Please consult with a licensed financial advisor before making any investment decisions.
- Technical analysis cannot guarantee future results and may not be accurate in predicting market movements.
- Market conditions and stock prices can be influenced by many factors, including external events, news, and economic data, which are beyond the scope of this analysis.

Adanient ltdLet's dive into the technical analysis of **Adani Enterprises Ltd.** (AdaniEnt) based on the current market conditions. I'll provide a structured technical analysis framework, focusing on key indicators like support, resistance, moving averages, RSI, MACD, and more.
Since I don’t have real-time market data, here's how you can analyze the stock with the available tools:
---
### **Technical Analysis of Adani Enterprises Ltd. (AdaniEnt)**
#### **1. Support and Resistance Levels**
- **Support Levels:**
- Look for the recent lows or key levels where the stock has bounced in the past.
- Example: If the stock recently bounced at ₹1,800, ₹1,750, or ₹1,700, those could be considered support levels.
- A drop below these levels may suggest the stock could head lower.
- **Resistance Levels:**
- Key resistance levels are areas where the stock faced selling pressure before. These levels often correspond to previous price highs.
- Example: If the stock has struggled to break past ₹2,000 or ₹2,100 in recent months, these could act as resistance.
- A breakout above these levels could signal a strong upward move.
#### **2. Moving Averages (MA)**
- **50-day Moving Average (MA):**
- If the stock is trading above the 50-day MA, this is typically seen as a short-term bullish sign.
- **Example:** If the stock is at ₹1,900 and the 50-day MA is ₹1,880, this indicates short-term bullish momentum.
- **200-day Moving Average (MA):**
- The 200-day MA is a longer-term trend indicator. If the stock is trading above it, the long-term trend is bullish, and if it's below, the long-term trend may be bearish.
- **Example:** If the 200-day MA is ₹1,750 and the stock is above it, this confirms the stock’s long-term uptrend.
#### **3. RSI (Relative Strength Index)**
- **RSI Levels:**
- **Above 70:** The stock is considered overbought, which may indicate a potential pullback or consolidation.
- **Below 30:** The stock is oversold, suggesting it could be due for a reversal or bounce.
- **Current Example:** If the RSI is at **72**, the stock may be in overbought territory, which could indicate a potential pullback. If it's at **28**, the stock could be oversold and might see a potential bounce.
#### **4. MACD (Moving Average Convergence Divergence)**
- **Bullish Signal:** If the MACD line crosses above the signal line, it suggests a potential uptrend.
- **Bearish Signal:** If the MACD line crosses below the signal line, it indicates potential bearish momentum.
- **Current Example:** If the MACD line is above the signal line, it is a positive sign for the stock. However, if it's below the signal line, this could suggest further downside risk.
#### **5. Volume Analysis**
- **Increasing Volume:** When the stock moves higher with increasing volume, it indicates strong buying interest.
- **Decreasing Volume:** If the stock rises or falls with decreasing volume, it might suggest weakening momentum.
- **Current Example:** If the stock is making new highs with increasing volume, this suggests the trend is likely to continue.
#### **6. Candlestick Patterns**
- **Bullish Patterns:** Look for **Hammer**, **Bullish Engulfing**, or **Morning Star** patterns during a downtrend, which could signal a reversal to the upside.
- **Bearish Patterns:** **Shooting Star**, **Bearish Engulfing**, or **Evening Star** patterns during an uptrend could indicate a reversal to the downside.
- **Current Example:** If there’s a **Bullish Engulfing** pattern forming, this could indicate a potential reversal or continuation of an uptrend.
#### **7. Fibonacci Retracement Levels**
- Key Fibonacci levels (such as **23.6%, 38.2%, 50%, 61.8%**) are often used to identify potential support and resistance levels during retracements.
- **Current Example:** If the stock is moving from ₹1,700 to ₹2,100, check the **23.6% retracement** around ₹1,950 and the **50% retracement** at ₹1,900 as possible support areas during a pullback.
---
**Disclaimer:**
- I am not a SEBI-registered professional or licensed financial advisor.
- All analysis, recommendations, and opinions provided are based solely on historical price data, patterns, and general market trends.
- Any action you take on the basis of this information is at your own risk. Please consult with a licensed financial advisor before making any investment decisions.
- Technical analysis cannot guarantee future results and may not be accurate in predicting market movements.
- Market conditions and stock prices can be influenced by many factors, including external events, news, and economic data, which are beyond the scope of this analysis.
---
Let me know if you would like to discuss a specific technical indicator in more detail or if you'd like to focus on any particular aspect of the analysis!

tajgvk hotels ### **Technical Analysis of TajGVK Hotels & Resorts Ltd. (TAJGVK)**
#### **1. Support and Resistance Levels (Current Situation)**
- **Support Levels:**
- The key support levels to watch are typically previous price lows, or areas where the stock has repeatedly bounced back in the past.
- **Example Support Levels:** If the stock recently bounced at ₹240 and ₹230, these might be considered strong support levels. A drop below these levels could signal a further downtrend.
- **Resistance Levels:**
- Resistance levels are price zones where the stock has previously faced selling pressure. If the stock price is approaching a key resistance area and is struggling to break through, it might indicate a reversal or consolidation.
- **Example Resistance Levels:** If the stock is struggling to break through ₹270 and ₹280, these could be key resistance levels. A breakout above these levels would signal bullish momentum.
#### **2. Moving Averages (MA) Analysis:**
- **50-day MA:** If the stock is trading above the 50-day moving average, it signals a potential bullish short-term trend. A price below the 50-day MA suggests a bearish or corrective phase.
- **Current Situation:** If the stock is at ₹250 and the 50-day MA is at ₹245, the stock is currently above the short-term trend indicator, which is bullish.
- **200-day MA:** This is an important long-term indicator. If the stock is trading above the 200-day MA, the long-term trend is considered bullish. If it's below, the long-term trend may be bearish.
- **Current Situation:** If the stock is at ₹250 and the 200-day MA is at ₹240, the stock is still in a long-term uptrend.
#### **3. RSI (Relative Strength Index):**
- **RSI Levels:**
- **Above 70:** Indicates that the stock is potentially overbought and may be due for a pullback.
- **Below 30:** Indicates the stock is oversold and may be due for a reversal or rally.
- **Current Situation:**
- If the RSI is at **75**, it suggests the stock is in overbought territory and may face a correction soon.
- If the RSI is at **25**, it suggests the stock is oversold, which could signal an upward move or reversal.
#### **4. MACD (Moving Average Convergence Divergence):**
- **Bullish Cross:** When the MACD line crosses above the signal line, it signals upward momentum.
- **Bearish Cross:** When the MACD line crosses below the signal line, it indicates potential downward pressure.
- **Current Situation:**
- If the MACD has recently crossed above the signal line, it suggests bullish momentum and could be a signal to enter long positions.
- If the MACD is below the signal line, it might indicate weakness and potential selling pressure.
#### **5. Volume Analysis:**
- **Increasing Volume:** Confirm price movements. Rising volume during upward movements suggests strong buying interest, while rising volume during downward movements signals strong selling interest.
- **Decreasing Volume:** Can indicate weakening momentum, either during a rally or a decline.
- **Current Situation:**
- If the stock is moving upwards with increasing volume, it indicates strength in the price move.
- If the stock is declining with high volume, it could signal that the downtrend has strength.
#### **6. Candlestick Patterns:**
- **Bullish Patterns:** **Hammer**, **Engulfing**, **Morning Star**, and **Bullish Harami** are all potential signs of reversals to the upside.
- **Bearish Patterns:** **Shooting Star**, **Evening Star**, and **Bearish Engulfing** could indicate a potential reversal to the downside.
- **Current Situation:**
- If the stock has recently formed a **Bullish Engulfing** pattern, it may suggest the start of an upward move.
- If a **Shooting Star** or **Evening Star** has formed at a resistance level, it could indicate a potential reversal and price drop.
#### **7. Fibonacci Retracement Levels:**
- Use Fibonacci retracement to find key support or resistance levels. If the stock is in an uptrend, key retracement levels are typically at **23.6%, 38.2%, 50%, 61.8%**.
- If the stock is pulling back, check these levels for potential areas to find support.
- **Current Situation:**
- If the stock has risen from ₹230 to ₹270, the key Fibonacci retracement levels to watch for support would be around ₹255 (23.6%), ₹245 (38.2%), and ₹240 (50%).
---
**Disclaimer:**
- I am not a SEBI-registered professional or licensed financial advisor.
- All analysis, recommendations, and opinions provided are based solely on historical price data, patterns, and general market trends.
- Any action you take on the basis of this information is at your own risk. Please consult with a licensed financial advisor before making any investment decisions.
- Technical analysis cannot guarantee future results and may not be accurate in predicting market movements.
- Market conditions and stock prices can be influenced by many factors including external events, news, and economic data, which are beyond the scope of this analysis.
el, feel free to share any real-time data you may have, and I can tailor the analysis accordingly!

Learn stock market from basic to advanceLearning the **stock market** from basic to advanced involves understanding the fundamental principles of how markets operate, how to evaluate stocks, the different types of trading strategies, and risk management techniques. Below is a structured guide to help you progress from beginner to advanced concepts in the stock market:
---
### **Stage 1: Stock Market Basics**
#### 1. **What is the Stock Market?**
- The **stock market** is a place where buyers and sellers trade stocks, which are shares of ownership in companies.
- It operates through exchanges like the **New York Stock Exchange (NYSE)** and **Nasdaq**.
- The market provides companies with a way to raise capital and gives investors a chance to earn returns on their investments.
#### 2. **Basic Terms You Should Know:**
- **Stock**: A share of ownership in a company.
- **Shareholder**: An individual or entity that owns shares in a company.
- **Dividend**: A payment made by a company to its shareholders, usually in cash or additional shares.
- **Ticker Symbol**: A unique identifier for a stock (e.g., **AAPL** for Apple).
- **Market Capitalization (Market Cap)**: The total value of a company’s shares (calculated by multiplying stock price by total shares outstanding).
- **Bull Market**: A market where stock prices are rising or expected to rise.
- **Bear Market**: A market where stock prices are falling or expected to fall.
#### 3. **How to Buy and Sell Stocks**:
- To trade stocks, you need a **brokerage account**. You can use traditional brokers or online brokerage platforms like **Robinhood**, **E*TRADE**, or **TD Ameritrade**.
- Learn the difference between **market orders** (buying/selling at current market prices) and **limit orders** (buying/selling at a specific price).
---
### **Stage 2: Intermediate Concepts**
#### 1. **Types of Stocks**:
- **Common Stocks**: Most common type of stock; provides voting rights and potential for dividends.
- **Preferred Stocks**: Offers dividends but usually no voting rights. Dividends are paid out before common stockholders.
- **Growth Stocks**: Stocks of companies expected to grow at an above-average rate.
- **Value Stocks**: Stocks that are considered undervalued compared to their earnings and growth prospects.
#### 2. **Stock Analysis**:
- **Fundamental Analysis**: Evaluating a company's financial health and growth prospects by looking at metrics like:
- **Earnings per Share (EPS)**: A company's profit divided by the number of outstanding shares.
- **Price-to-Earnings (P/E) Ratio**: A ratio that compares the stock price to the company's earnings.
- **Debt-to-Equity Ratio**: Measures a company's financial leverage.
- **Return on Equity (ROE)**: Measures a company’s profitability in relation to shareholders' equity.
- **Technical Analysis**: Analyzing historical price movements and volume to forecast future price trends using tools like charts and indicators (e.g., Moving Averages, RSI, MACD).
- Learn how to read stock **charts** and understand patterns like **head and shoulders**, **double tops**, and **flags**.
#### 3. **Types of Orders**:
- **Market Order**: Buy/sell at the best available current price.
- **Limit Order**: Buy/sell at a specified price or better.
- **Stop Loss Order**: Order to sell a stock if it reaches a certain price to limit losses.
- **Stop-Limit Order**: Combines a stop loss and a limit order.
#### 4. **Diversification**:
- Diversifying your portfolio means spreading investments across different sectors or asset classes (stocks, bonds, etc.) to reduce risk.
- **ETFs (Exchange-Traded Funds)** and **Mutual Funds** are good ways to diversify as they hold a basket of stocks from different sectors.
---
### **Stage 3: Advanced Concepts**
#### 1. **Advanced Stock Analysis**:
- **Valuation Models**: Understand advanced valuation methods like **Discounted Cash Flow (DCF)**, which estimates the value of a company based on its future cash flows.
- **Relative Valuation**: Comparing a company’s financial ratios to those of similar companies or industry averages.
#### 2. **Technical Analysis (Advanced)**:
- **Chart Patterns**: Dive deeper into chart patterns like **cup and handle**, **triangles**, and **channels**.
- **Candlestick Patterns**: Study candlestick formations like **doji**, **engulfing**, **hammer**, and **shooting star**, which can signal market reversals.
- **Indicators and Oscillators**:
- **Bollinger Bands**: Used to measure volatility and identify overbought/oversold conditions.
- **Moving Average Convergence Divergence (MACD)**: Helps identify potential buy and sell signals based on the convergence and divergence of moving averages.
- **Fibonacci Retracement**: A tool used to identify potential support and resistance levels based on the Fibonacci sequence.
#### 3. **Options Trading**:
- Learn about **call** and **put options**:
- **Call Options**: A contract that gives the holder the right (but not the obligation) to buy a stock at a certain price within a set period.
- **Put Options**: A contract that gives the holder the right to sell a stock at a certain price within a set period.
- Understand **options strategies** like:
- **Covered Calls**: Holding a stock and selling a call option on it.
- **Protective Puts**: Buying a put option to protect against a stock's potential decline.
- **Straddle**: Buying both a call and a put option on the same asset, betting on volatility.
- Study **implied volatility** and how it affects options prices.
#### 4. **Risk Management and Position Sizing**:
- Learn about the **Kelly Criterion**, **position sizing**, and the importance of **capital preservation**.
- **Stop Losses**: How to use stop losses effectively to limit your losses.
- **Risk-to-Reward Ratio**: Analyzing trades to ensure the potential reward justifies the risk.
#### 5. **Trading Psychology**:
- **Emotions and Biases**: Understand psychological factors like **fear**, **greed**, and **overconfidence**, which can affect trading decisions.
- Develop a **trading plan** and stick to it.
- Learn about **loss aversion**, where traders feel the pain of a loss more intensely than the joy of a gain, and how it affects decision-making.
#### 6. **Algorithmic and Quantitative Trading**:
- **Algorithmic trading** involves using computer programs to execute trades based on predefined criteria. Traders write algorithms that can trade at high speeds and execute complex strategies.
- **Quantitative trading** involves using mathematical models to identify trading opportunities based on historical data. This includes machine learning and AI.
---
### **Stage 4: Mastery & Continuous Learning**
#### 1. **Economic Indicators and Macro Trends**:
- Study how **economic data** (GDP, inflation, interest rates) and **central bank policies** (e.g., the Federal Reserve's decisions) impact the stock market.
- Learn about **global economic events** and their effect on domestic markets.
#### 2. **Hedging Strategies**:
- Learn how to **hedge** your portfolio using **options**, **futures contracts**, or other financial instruments to reduce risk.
#### 3. **Advanced Portfolio Management**:
- Build and manage a diversified portfolio using different asset classes (stocks, bonds, commodities, alternatives).
- Understand **Modern Portfolio Theory** and how to balance risk and reward across a portfolio.
#### 4. **Tax Efficiency and Financial Planning**:
- Learn about the tax implications of your trades (capital gains, dividends).
- Explore strategies to minimize tax liabilities, such as tax-loss harvesting.
#### 5. **Staying Updated**:
- Stay informed with **financial news**, **earnings reports**, and **company announcements**.
- Continuously backtest and optimize your strategies, refine your skills, and learn new market trends.
### **Additional Resources**:
- **Books**:
- "The Intelligent Investor" by Benjamin Graham
- "A Random Walk Down Wall Street" by Burton Malkiel
- "Market Wizards" by Jack Schwager
- "How to Make Money in Stocks" by William J. O'Neil

What is database trading ?**Database trading** refers to the use of databases to store, analyze, and manage large volumes of financial market data to inform trading strategies and decisions. Traders, especially quantitative and algorithmic traders, rely heavily on databases to organize and manipulate market data such as stock prices, volume, economic indicators, and other financial metrics. By using database-driven systems, traders can access vast amounts of data quickly, perform complex analyses, and backtest strategies.
### **How Database Trading Works**:
1. **Data Collection and Storage**:
- In database trading, market data is collected from various sources such as exchanges, financial reports, and APIs. This data includes price histories, order book information, trading volume, technical indicators, news sentiment, and more.
- The data is stored in **databases** (such as relational databases like **MySQL**, **PostgreSQL**, or NoSQL databases like **MongoDB**) where it can be structured for easy retrieval, querying, and analysis.
2. **Data Analysis**:
- Traders use databases to organize and query market data. For example, a trader might query the database to retrieve historical price data for a specific asset, calculate moving averages, or identify patterns.
- Advanced analysis is typically carried out using tools like **SQL** for querying databases, and **Python**, **R**, or **MATLAB** for data manipulation, statistical analysis, and developing trading algorithms.
3. **Backtesting**:
- One of the key uses of databases in trading is **backtesting**. Traders use historical data stored in databases to test their trading strategies. They can simulate how a strategy would have performed in the past by applying it to the data and calculating metrics like returns, risk, and drawdowns.
- **Backtesting engines** often pull data from databases and execute simulated trades based on the historical market conditions stored in the database.
4. **Real-Time Data Processing**:
- Some database systems, especially when integrated with **real-time market data feeds**, allow traders to monitor live market conditions and execute trades automatically based on predefined algorithms.
- Databases play a critical role in storing and processing real-time data, ensuring that algorithms can access up-to-date information and respond to market movements promptly.
5. **Machine Learning and AI**:
- **Machine learning algorithms** can be applied to the data stored in databases to identify trends, correlations, or anomalies that can inform trading decisions.
- Traders can use databases to train models on historical data and then deploy these models in live markets to predict price movements or optimize strategies.
---
### **Why Database Trading is Important**:
1. **Efficient Data Management**:
- Financial markets generate massive amounts of data every second. Databases allow traders to **store, organize, and retrieve** this data efficiently, even when dealing with vast datasets across multiple assets and timeframes.
2. **Scalability**:
- Databases can handle **large datasets** with millions of data points. This is crucial for traders who require a scalable solution to process high-frequency trading data, tick-level data, or large historical datasets.
3. **Speed and Accessibility**:
- Trading systems need to be fast, particularly in high-frequency or algorithmic trading. Databases provide a structured and efficient way to store and query data, ensuring that traders can access the data they need quickly to make real-time trading decisions.
- **Low latency** is especially important when trading in fast-moving markets where decisions must be made in fractions of a second.
4. **Backtesting and Strategy Optimization**:
- The ability to backtest trading strategies with historical data is one of the core advantages of database trading. Traders can assess the viability of their strategies over different market conditions before applying them in live trading.
- This allows for **strategy optimization** by tweaking parameters and testing different variations of a strategy to find the most effective approach.
5. **Data Integrity and Accuracy**:
- Databases provide mechanisms for ensuring the **integrity** and **accuracy** of data, which is crucial for making reliable trading decisions. Traders can perform thorough data validation and cleaning before using the data in their models.
6. **Data-Driven Decision Making**:
- Database trading enables **data-driven decision-making** by providing traders with the ability to analyze and interpret large sets of financial data. This minimizes emotional decision-making and helps traders make rational, systematic choices.
---
### **Types of Data Used in Database Trading**:
1. **Market Data**:
- **Price data**: Historical and real-time price information for various assets (stocks, options, forex, etc.).
- **Volume data**: Data related to the number of shares or contracts traded.
- **Bid/Ask data**: The best available prices for buying (bid) and selling (ask) an asset at a given time.
- **Order book data**: Information about the orders waiting to be executed in the market.
2. **Fundamental Data**:
- **Earnings reports**, **balance sheets**, and **cash flow statements** of companies.
- **Economic indicators** such as GDP growth, inflation, interest rates, and employment numbers.
3. **Technical Indicators**:
- Data generated by calculating moving averages, RSI (Relative Strength Index), MACD (Moving Average Convergence Divergence), Bollinger Bands, and other common indicators used for technical analysis.
4. **Sentiment Data**:
- Data extracted from **news feeds**, **social media**, and **financial reports** to gauge market sentiment.
- Sentiment analysis can help predict how market participants might react to news events or earnings announcements.
5. **Alternative Data**:
- **Geolocation data**, **weather data**, and other unconventional datasets that might provide an edge in predicting market moves.
---
### **How Database Trading Can Be Profitable**:
1. **Automated Trading Strategies**:
- Traders can design **algorithmic trading strategies** that use data stored in the database to execute trades automatically based on certain criteria. By leveraging historical data, these strategies can identify patterns and opportunities that would be hard for human traders to spot.
2. **High-Frequency Trading (HFT)**:
- High-frequency traders rely on **fast, automated decision-making** systems that use real-time data stored in databases. By processing large volumes of data quickly, high-frequency trading algorithms can capture small price movements across numerous assets, leading to profitability through sheer volume of trades.
3. **Risk Management**:
- By leveraging databases for real-time data analysis, traders can implement **dynamic risk management** systems that adjust position sizes, stop losses, and take profits based on market conditions. This helps protect profits and minimize losses.
4. **Predictive Analytics**:
- Machine learning models and predictive analytics can be applied to the data in the database to forecast price movements, asset correlations, and volatility patterns. Traders can use these insights to make informed decisions about entry and exit points.
5. **Improved Strategy Development**:
- With access to vast amounts of data, traders can continuously test, optimize, and improve their strategies. This allows them to stay ahead of market trends and make adjustments to their trading algorithms when necessary.
6. **Diversification**:
- Traders can use databases to analyze a wide range of assets, strategies, and timeframes. This allows them to implement **diversified strategies** and reduce the overall risk of their trading portfolio.
---
### **Challenges of Database Trading**:
1. **Data Quality and Integrity**:
- If the data stored in the database is incomplete, inaccurate, or inconsistent, it can lead to incorrect trading decisions. Ensuring data quality is paramount to successful database trading.
2. **Complexity and Maintenance**:
- Database-driven trading systems require regular maintenance, updates, and tuning. Traders need to manage both the infrastructure (databases, servers, etc.) and the software (trading algorithms, data processing pipelines) to ensure the system runs efficiently.
3. **Computational Power**:
- Analyzing large volumes of data in real-time can require significant computational resources. For high-frequency or machine learning-based strategies, having access to powerful servers or cloud-based infrastructure is crucial.
4. **Latency**:
- In fast-moving markets, even small delays in data processing can affect trading outcomes. High-frequency and algorithmic trading strategies require **low-latency systems** to ensure that orders are executed quickly and accurately.
### **Summary**:
**Database trading** is a powerful approach for managing, analyzing, and executing trades using vast amounts of financial data. It provides traders with a structured and efficient way to store, analyze, and access data, which is essential for developing profitable trading strategies. By using databases, traders can automate their strategies, backtest their models, and analyze large datasets in real time to gain a competitive edge in the market.
