Shortsetup

Rising Wedge Chart Pattern On All TF - GBPUSDIt's important to note that the behavior of the GBPUSD pair can be influenced by a wide range of factors such as global economic conditions, political developments, supply and demand, and market sentiment. Therefore, it's important to do your own research, analyze the market conditions, and consult with a qualified financial advisor before making any investment decisions.
However, I can provide an explanation of the chart pattern you mentioned, which is the rising wedge pattern. A rising wedge is a bearish chart pattern that occurs when an asset's price is trading within an upward sloping channel but with a contracting range. This pattern is characterized by a series of higher highs and higher lows that form two converging trendlines that slope upward.
The rising wedge pattern is formed when the price reaches a resistance level and starts to consolidate, with the highs getting lower and lower while the lows maintain their level, indicating that the buyers are losing momentum. Once the price breaks below the lower trendline of the wedge pattern, it can indicate a trend reversal, and traders may consider shorting the asset.
However, it's important to note that the rising wedge pattern is not foolproof, and false breakouts can occur. Additionally, it's essential to use risk management techniques, such as setting stop-loss orders, to limit potential losses if the trade does not go as expected.
In summary, the rising wedge pattern is a bearish chart pattern that can occur in the GBPUSD pair or any other asset, and it indicates a potential trend reversal. However, investors should conduct thorough research and analysis and consult with a financial advisor before making any investment decisions based on chart patterns.

Diagonal formation in USDJPY; Elliotical ApproachHello Traders!
1. We see a clear 5-wave impulsive move forming a leading/ending diagonal.
2. It could be Wave 1 or Wave A.
3. Targets and stop have been marked on the chart.
Do use proper risk management.
Happy Trading!
Profits,
Market's Mechanic.

TITAN- Hidden Bearish Divergence SELL!Attached: TITAN Daily Price Chart as of 22nd March 2023
Price has triggered a SELL Signal today on account of the following reasons:
1) Hidden Bearish RSI Divergence as RSI puts in a Higher High but Price puts in a Lower High
2) Price has come back to Retest a Prior Support Zone which now can act as Resistance
3) Dow Theory Structure of Lower Highs and Lower Lows still intact so it is a Down Trend and NO Trend Reversal yet
4) Elliot Wave Count suggest Price is ready to start Wave Z down of its complex correction
Our Plan of Action is:
Short at Current Market Price= 2508
Stop Loss > 2550
for Downside Target Open to 2270

Nifty50 short idea.It seems that nifty50 may fall from here...
according to me the SL should be 17202.95 and TP is 17031...
lets see...

INDIACEMENT SHORTENTRY TARGET SL Mention in the chart.
ALWAYS TAKE TRADE WITH CONFIRMATION
Note : Trading in any financial market is very risky. I post ideas for educational purpose only. It is not financial advice. Do not hold us responsible for any potential loss you may incur. Please consult your financial adviser before trading.

Possible rising wedge formation in EURUSD.Hello Traders!
1. Possible rising wedge in formation.
2. Sell below the Red Line.
Do use proper risk management.
Happy Trading!
Profits,
Market's Mechanic.

EURUSD FORECAST 20TH MARCH 2023We can expect a possible downfall in EURUSD on Monday
Expected Downtrend to 1.06000 Level


BE CAUTIOUS.... QUADRUPLE WITCHING DAY!!We might still be in wave 4 of the Primary Elliot wave.
US markets rallied last night, so we may expect a gap-up opening of around 100 points.
17220 - 17270 zone might act as a strong resistance zone (0.5 to 0.618 Fibonacci retracement of wave 3)
Quadruple witching refers to a date when stock index futures, stock index options, stock options, and single stock futures expire simultaneously. It is generally on the third Friday of March, June, September, and December every year.
Is quadruple witching bullish or bearish?
We learned that volatility is slightly higher than any normal trading day, volume is higher than the normal, the quadruple witching day is a bearish day, the quadruple witching week is bullish, and the last hour of quadruple watching day is bearish. (From tradestation.com)
We didn't have a bullish week, so market movements may be unpredictable. Stong closing above 17270 in 30 min candle (stop loss for a short trade) can be a sign of bullishness.
If the market falls, wave 5 can take nifty to the 16800 level.
Enjoy the volatile ride!

SBILIFE Double top Breakdown ??!!!Chart pattern look interesting for a short trade
Reasons
1. SBILIFE travelling in a Descending channel pattern ( hourly time frame)
2. Now, it has formed a DOUBLETOP pattern (with a perfect High & Lower High as the two tops )
3. Lower low too formed on Friday, increasing our probability and thus Breakdown!!!
4. SL & Target levels mentioned @ chart as horizontal dashed lines(red & green)
5. 2 hr candle escaping out of the channel(yellow) can be less risky SL.
6. On 15th Feb(wed), Sbilife formed a Superb Bullish Engulfing day candle, but couldnot sustain. ... showing the BEARS STRENGTH!!!!
7. 1113(1st target) level small gap remains unfilled!!!
Let's wait and watch how it moves!!!!
NOTE- Just sharing my view......not a tip nor advice!!!!

Nifty Positional Short Trade Setup!Nifty Currently Trading Descending Channel, Making Lower High Lower Low. Sell Nifty ~ 17410, With Stop ~ 17580, Target ~ 16900, 16800. Expected Target 4 ~ 5 Trading Day's.


Time to go short on BTC ?With Bitcoin trading around a key resistance level and facing rejection from it on the daily timeframe, now might be a good time to consider shorting the popular cryptocurrency. While Bitcoin has experienced some significant price increases over the past year, there are indications that this momentum may be slowing down. With Bitcoin showing signs of lower excitement from investors, it may be wise to consider shorting it for the medium term.
One strategy for shorting Bitcoin would be to maintain a stop loss on the long side, which would help to limit potential losses in the event that Bitcoin rebounds and continues to climb. Additionally, it's important to carefully monitor the market and look for any potential signs of a trend reversal, as this could signal a shift in the direction of Bitcoin's price movement.
Furthermore, the recent rejection of Bitcoin from the key resistance level has resulted in the formation of a potential double top pattern on the daily timeframe. This pattern is often considered a bearish signal and could indicate that Bitcoin's upward momentum may be coming to an end. As a result, shorting Bitcoin at this time may offer an attractive opportunity for traders looking to capitalize on the potential price decrease.
It's worth noting, however, that shorting Bitcoin does come with inherent risks, as the cryptocurrency market can be notoriously volatile. As such, it's essential to carefully manage risk by maintaining strict stop losses and monitoring the market for any potential shifts in Bitcoin's price movement. By doing so, traders can position themselves to potentially profit from Bitcoin's current market conditions, while also minimising their exposure to potential losses.
Overall, while there is always a degree of risk involved in any investment strategy, shorting Bitcoin at this time could potentially provide a solid return for traders who are willing to take on the risk. By keeping a close eye on the market and staying vigilant in the face of any potential changes, investors can position themselves to take advantage of this exciting opportunity.

Mphasis Positional Short Trade Setup!Mphasis Breakdown Trendline Support With Huge Candle And Weak Rising Volume Appears On Daily Chart. Short Near ~ 2090, 2100, With Stop ~ 2145, Target ~ 1950, 1930. Expected Target March Expiry.

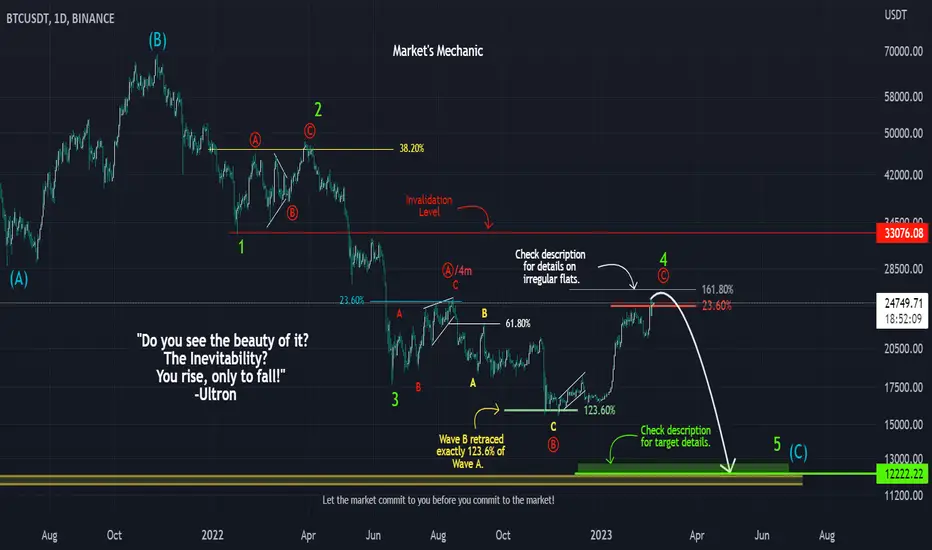
'You Rise, Only to Fall!' Elliotical Approach to BTCUSDT.Hello Traders!
"Do you see the beauty of it? The Inevitability? You rise, only to fall!"
As Ultron has pointed out, at times, markets rise, only to fall, what we traders call a 'retracement'. The bullish retracement of BTC is almost at its fag end.
1. We'll begin from the All-Time-High of about $69000. From there, we see the first 5-wave impulse down and then an ABC correction. That means, we have clear Waves 1 and 2.
2. Again, we see a 5-wave impulse in the form of Wave 3 and then again an ABC correction forming what we thought was Wave 4 (called Wave 4m from now on) .
3. There is a wonderful Rule of Alternation given in Elliot Wave theory. Wave 2 and Wave 4 will differ in at least one of the following ways if not all; PRICE, INTERNAL STRUCTURE, and/or TIME . There are a couple of other things as well but these 3 remain prominent.
4. Now, Wave 2 and Wave 4m took almost the same time and also had the same price value. Of course, the internal structures were different and that would have done it, but we didn't see the next 5-wave impulse down as the final fifth wave after 4 clear waves.
5. In such scenarios, we give the market time to unfold. Time is a very important key to market movement. We stay away until we understand what's really going on.
6. The market went further down and made a new low of around 15500 in 3 waves (marked with yellow ABC) . The move up breaking the high formed by 4m, confirmed that the correction was still going on. Wave 4m was just Wave A of actual Wave 4.
7. The 3 yellow ABC waves, were Wave B of Wave 4. They also happened to retrace exactly 123.6% of Wave A (4m) . This gave us the hint that an irregular flat correction was taking place.
8. What is an Irregular Flat Correction? The image has been attached. Please refer.
9. Wave C, ideally, should not cross 161.8% of Wave A. There can be a scenario of an extra elongation of Wave C but that is very very rare.
10. Coming to the Target Zone now. Wave 5 can be equal to Wave 1 through wave equality. That gives us a target of around 12222. We also have an important support for BTC at that price level. Once Wave 4 is finally complete, a parallel channel drawn through Waves 2, 3, and 4 should give us an approximate target of Wave 5.
11. The invalidation level for this analysis has been shown on the chart. Wave 4 should not enter the price territory of Wave 1. If it does, we'll have to re-analyze. Although, since it's a large C wave, the possibility of a diagonal exists (where Waves 1 and 4 can coincide), it doesn't seem to be in the picture yet.
12. It is expected that the market will break its current high on 25250 once before beginning the impulse down.
Do use proper risk management.
Happy Trading!
Profits,
Market's Mechanic.

Bitcoin Strong Bearish Reach 18000$Bitcoin makes proper Double Top Pattern formation and Last week's price break the 20400 Nike line
So, According to the Technical, it will go 18000$ in the upcoming week's

banknifty shortAs per market structure
banknifty should go down
so short banknitfy if breish cnadel form near resitance box
!good_luck!!!!!!

Ethereum Short Position . 1 Day ChartEntry 1475-1427$
Target 1012$
Dynamic Stoploss 1671$
All the Best

btcusdt shortbtcusdt consloding in beraish flag and has break double top on 5 min timefrane
good short trade once it break channel with god volumes and candel
3
short it till the below target sl as per your iwish

xauusd short tradexauusd making lower highs
it gone retrace its 50 percent level on 1d timerframe
it is on its 200 ema on 15 min
good short short below the line on the basic of closeing
!!!!good_luck.....!!!!!!!
