Take Liquidity or Become Liquidity In this video I am talking about a Solid concept / strategy know as Liquidity .
General trends of the markets in terms of index are discussed in this videos and no bias or directions are given
Stockmarkets

Bank Nifty spot 59610.45 by Daily Chart view - Weekly UpdateBank Nifty spot 59610.45 by Daily Chart view - Weekly Update
- Support Zone 58850 to 59350 for Bank Nifty
- Resistance Zone 59900 to ATH 60437.35 for Bank Nifty
- Bank Nifty seems more matured then Nifty to contain the unwarranted Geo-Political scenario and trending up for New ATH

How to Save yourself from a FAKEOUT - Learn this MethodI made educational content videos for trading
In this video I am telling about how to Identify a fakeout with this simple trick .

Resistance to Flip + Equilibrium Mastery: Pure Price ActionLeft Chart (Monthly TF):
- Classic resistance-turned-support flip. Price tested this level multiple times historically (data >3 months old), holding firm as dynamic support. Proof that prior barriers evolve with pure price behaviour.
Right Chart (Weekly TF):
- Equilibrium at 0.5: Stock has danced around this pivot, building multiple resistances above/below—trading in balance like clockwork.
- Parallel Channel Magic( Red lines ): Counter-trendline + parallel upper line forms a textbook channel, showcasing how price respects geometry over time.
- Respected Demand Zone (Green): Multiple bounces here confirm its strength—demand alive and kicking historically.
Disclaimer: This is for educational purposes only, showcasing historical price action (>3 months old). Not financial advice, trade recommendations, or predictions. Always DYOR and trade at your own risk.

Price action understanding that will change the way you tradeI make educational content videos for swing trading . In this video I have used concepts like Trendlines, Counter trendlines, zones, Support and Resistance, Market fall, Targets and Exit plan for any trade setup and most importantly use of lines with multi time frame analysis .
Charts used are 3 months or older

Candlestick Secrets Traders Never Tell YouDiscover candlestick patterns hidden in plain sight and master their true power like never before
Charts used in this Video are over 3 months old

Beginner to Pro: Master Any Trade with This Step‑By‑Step PlanI make educational content videos for swing / positional trading .
Charts used in the video are 3 months old for explanation using Bar replay feature of Trading view.

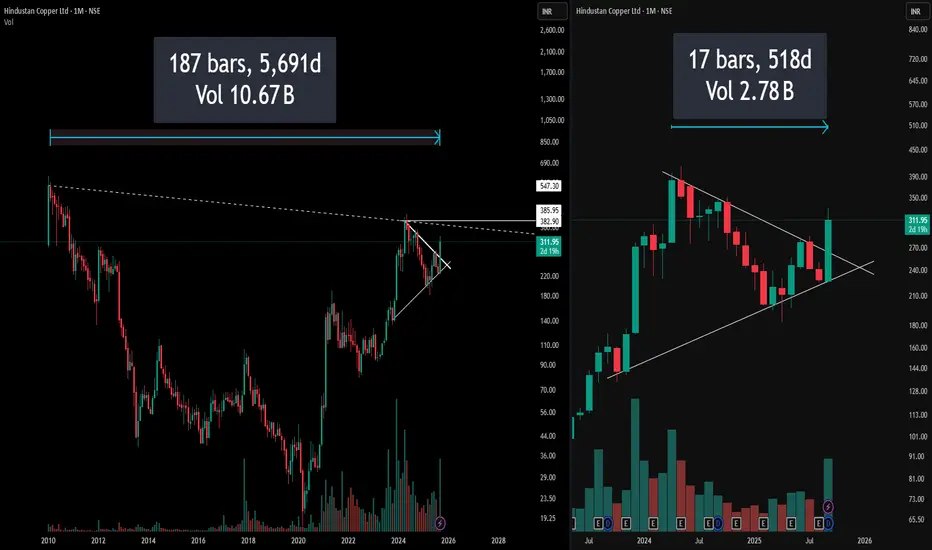
5000 Days vs 500 Days of Data : Which is better ?Most traders jump straight into attractive chart patterns and impulsively take trades, ignoring the bigger picture. Here’s a powerful case study
Left Side: Full Monthly Chart with Hidden Resistance
On the left, the chart captures over a decade of price action, immediately drawing attention to a long-standing downward-sloping resistance stretching from all-time highs. This hidden resistance line is not visible on the usual zoomed-in view, yet it presents a formidable barrier that traders often neglect.
(Pro Insight: Always extend trendlines and resistance zones till the inception of the instrument for real swing perspective)
(Risk Reminder: What looks like a clear breakout on a recent timeframe may actually be approaching a multi-year resistance trap)
Right Side: Symmetrical Triangle – The Pattern Focus
The right segment restricts focus to the last few years, zooming in on a visually perfect symmetrical triangle. While the setup looks neat and promising—indicating contraction and likely expansion ahead—this trimmed view risks obscuring the bigger, hidden resistance directly overhead.
Disclaimer: This post reflects technical views for educational purposes only, not investment advice. Always perform your own due diligence before trading.
Secret Observations That Made Me a Better TraderDiscover the hidden market manipulation techniques institutional traders use to control price action, plus my observations, these secret patterns helps make you a better trader and get more observant using trading view tools and charts
Data used is 3 months old . This content is for educational and entertainment purposes only.

Buy, Sell or Skip? Read Breakouts and VolumesExplore how to judge breakouts using TradingView's bar replay, leveraging 3-month-old charts and price action principles that apply from 5-min to monthly timeframes. Sharpen your technical edge—educational insights only.
Disclaimer: This content is for educational purposes and not financial advice. Always do your own research before making trading decisions.

Stock-wise Investigation: Breakouts or Support? ( MTF )Using 3-month-old chart data, this video explores how stocks tend to favor breakouts or support zones, with key technical terms to sharpen your pattern recognition skills—purely educational in nature.

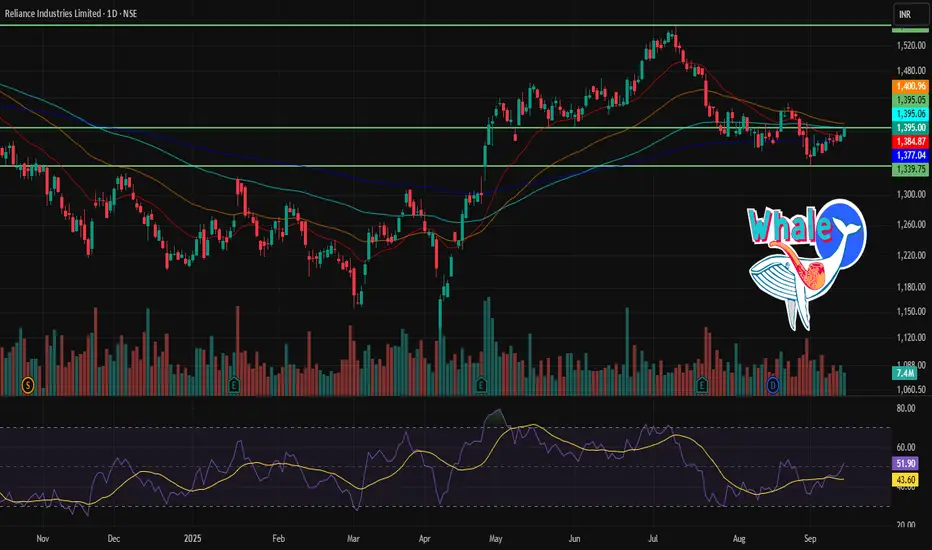
RELIANCE 1D Time frame🔢 Current Level
Trading around ₹1,395
🔑 Key Resistance & Support Levels
Resistance Zones:
~ ₹1,400 – ₹1,410 (near-term resistance)
~ ₹1,420 – ₹1,430 (stronger resistance above)
Support Zones:
~ ₹1,380 – ₹1,370 (first support)
~ ₹1,360 – ₹1,350 (secondary support)
📉 Outlook
Bullish Scenario: Holding above ₹1,400 could push price toward ₹1,420 – ₹1,430.
Bearish Scenario: A fall below ₹1,370 may drag it toward ₹1,350 or lower.
Neutral / Range: Likely to trade between ₹1,370 – ₹1,420 until a breakout or breakdown occurs.
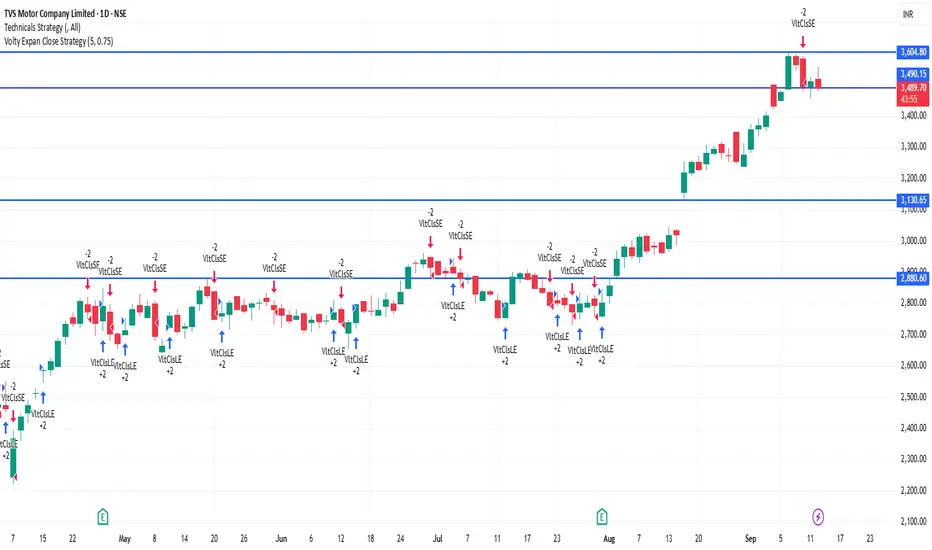
TVSMOTOR 1D Time frame🔢 Current Level
Trading around ₹3,490 – ₹3,526
🔑 Key Resistance & Support Levels
Resistance Zones:
₹3,550 – ₹3,556 (near-term resistance; breakout above this may lead to further upside)
₹3,600 (psychological resistance)
₹3,650 (stronger resistance above)
Support Zones:
₹3,510 – ₹3,520 (immediate support; failure to hold above this may lead to a decline)
₹3,480 – ₹3,490 (short-term support; a break below this could indicate weakness)
₹3,400 – ₹3,450 (deeper support zone if price dips further)
📉 Outlook
Bullish Scenario: If TVS Motor holds above ₹3,520, upward momentum may continue. Break above ₹3,556 can open the way toward ₹3,600+.
Bearish Scenario: If it falls below ₹3,480, risk increases toward ₹3,400 – ₹3,450.
Neutral / Range: Between ₹3,520 – ₹3,556, TVS Motor may consolidate before a directional move.
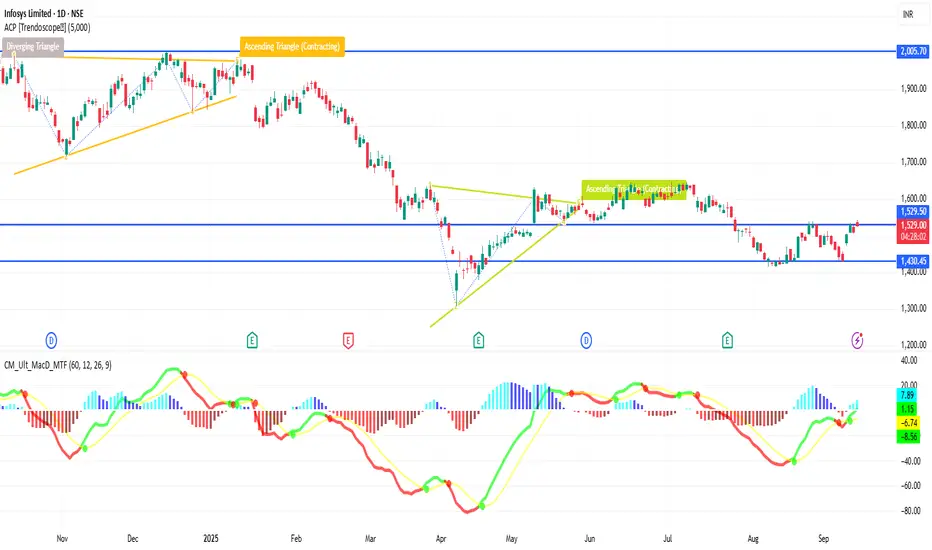
INFY 1D Time frame🔢 Current Level
INFY is trading around ₹1,510 – ₹1,529
🔑 Key Resistance & Support Levels
Resistance Zones:
₹1,518 – ₹1,520 (near-term resistance; breakout above this may lead to further upside)
₹1,530 (stronger resistance above)
Support Zones:
₹1,484 – ₹1,485 (immediate support)
₹1,481 (stronger support if price dips further)
₹1,470 – ₹1,472 (deeper support zone)
📉 Outlook
Bullish Scenario: If INFY holds above ₹1,485, upward momentum may continue.
Breakout Scenario: A move above ₹1,520 can open the way toward ₹1,530+.
Bearish Scenario: If it falls below ₹1,481, risk increases toward ₹1,470 – ₹1,472.
SENSEX 1D Time frame🔢 Current Level
Sensex is around ₹81,800 – ₹81,818
🔑 Key Resistance & Support Levels
Resistance Zones
~ ₹81,900 – ₹82,200 (recent highs / selling pressure zone)
~ ₹82,500 (stronger resistance above)
Support Zones
~ ₹81,300 – ₹81,400 (immediate support)
~ ₹81,100 (stronger support if price dips further)
~ ₹80,800 – ₹80,900 (deeper support zone)
📉 Outlook
If Sensex holds above ~ ₹81,400, bullish scenario remains alive.
Break above ~ ₹82,200 can open upside toward ~ ₹82,500+.
If it loses ~ ₹81,300, then downward risk increases, possibly toward ~ ₹81,100 or lower.

Buy,Retest or Wait? Backtesting Charts with Bar Replay!Using TradingView’s Bar Replay, I break down an old chart and reveal the exact logic behind whether it was a buy, sell,retest or skip trade. Perfect for traders who want to sharpen entry-decisions with real market context.

HDFCBANK 1D Time frame📍 Current Price Action
Current Price: ~₹968
Day Range: ₹960 – ₹975
Trend: Neutral to mildly bullish
⚙ Technical Indicators
RSI (14): ~53 → neutral momentum
MACD: Slightly positive → mild upside bias
ADX (14): ~32 → moderate trend strength
MFI (Money Flow Index): Mid-range → balanced buying/selling pressure
📊 Moving Averages
Short-term (5, 10, 20-day): Price trading above → bullish signals
Medium to Long-term (100, 200-day): Mixed to weak → acting as resistance
📉 Support & Resistance
Immediate Support: ₹960 – ₹965
Next Support Zone: ₹940 – ₹950
Immediate Resistance: ₹970 – ₹975
Next Resistance: ₹985 – ₹990
🧠 Summary
HDFC Bank is in a neutral to mildly bullish zone on the daily chart. Price is holding above short-term averages, but longer-term averages are acting as resistance. If the stock sustains above ₹975, it may move toward ₹985–₹990. Failure to hold ₹960 could drag it toward ₹940–₹950.

TATACONSUM 1D Time frame📍 Current Price Action
Current Price: ~₹1,105
Day Change: +0.3% approx
52-Week Range: ₹882 – ₹1,234
⚙ Technical Indicators
RSI (14): ~62-65 → bullish momentum
MACD: Positive → upside bias intact
ADX (14): Above 50 → strong trend strength
Stochastic / Williams %R: In overbought zone → short-term pullback risk
📊 Moving Averages
Short-term (5, 10-day): Bullish, price trading above
Medium-term (20, 50-day): Bullish, trend supportive
Long-term (100, 200-day): Bullish, strong structure
📉 Support & Resistance
Immediate Support: ₹1,080 – ₹1,090
Next Support Zone: ₹1,060 – ₹1,030
Immediate Resistance: ₹1,115 – ₹1,125
Major Resistance (52-week high): ₹1,230+
🧠 Summary
Tata Consumer is bullish on the daily chart. Indicators and moving averages show strong momentum, though overbought signals suggest chances of consolidation or mild pullback. Holding above ₹1,080 keeps the uptrend intact. A breakout above ₹1,125 can open the way toward ₹1,230+.

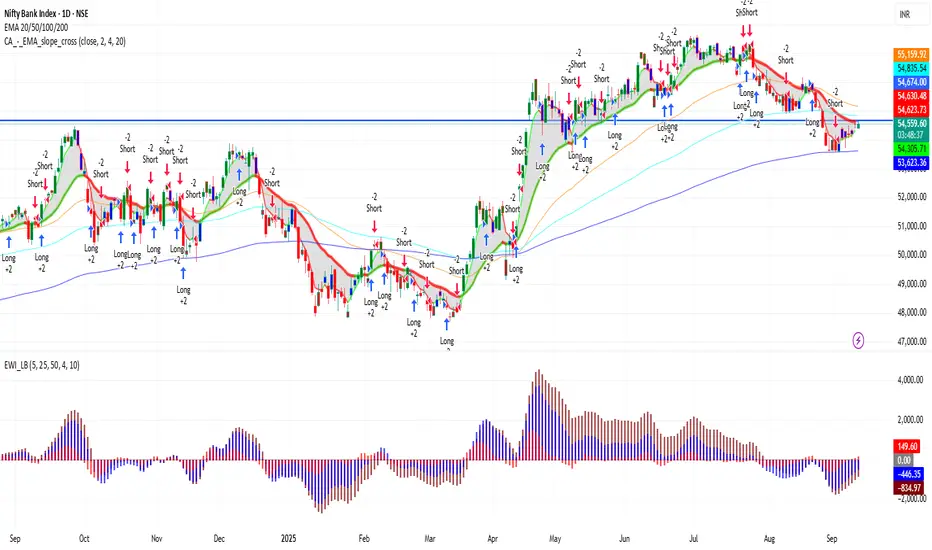
BANKNIFTY 1D Time frame📊 Current Snapshot
Current Price: ₹54,536.00
Day’s Range: ₹54,400 – ₹54,705
52-Week Range: ₹47,702.90 – ₹57,628.40
Previous Close: ₹54,216.10
Opening Price: ₹54,554.75
Market Cap: Approx. ₹3.78 lakh crore
Volume: ~77,647 contracts
📈 Trend & Indicators
Trend: Neutral to mildly bullish; trading near 50-day and 200-day moving averages.
RSI (14): 60 – Neutral; no immediate overbought or oversold conditions.
MACD: Positive → indicates bullish momentum.
Moving Averages: Short-term moving averages suggest neutral to slightly bullish outlook.
🔮 Outlook
Bullish Scenario: Break above ₹54,705 with strong volume could target ₹55,000.
Bearish Scenario: Drop below ₹54,400 may lead to further decline toward ₹54,000.
Neutral Scenario: Consolidation between ₹54,400 – ₹54,705; breakout needed for directional move.
📌 Key Factors to Watch
Banking Sector Performance: As BANKNIFTY comprises major banking stocks, sector-specific developments can influence index movement.
Economic Indicators: Changes in interest rates or inflation can impact index performance.
Global Cues: Developments in global markets can affect investor sentiment.
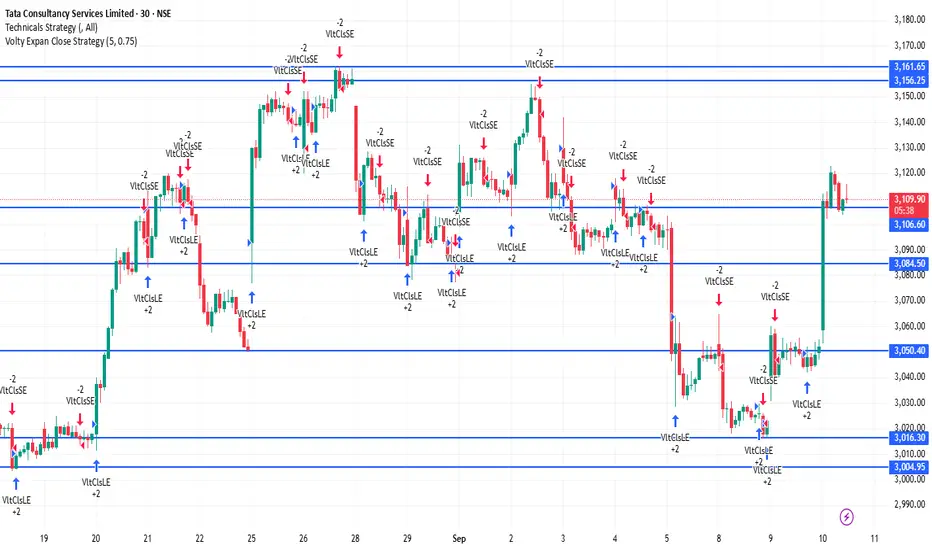
TCS 30Minutes Time frameTCS – 30-Minute Time Frame Important Levels (Current Estimate)
Support Zones
₹3,080 – ₹3,090 → Immediate intraday support
₹3,050 – ₹3,060 → Stronger support level where dip-buying may emerge
₹3,020 – ₹3,030 → Major support; a breakdown here may indicate intraday weakness
Resistance Zones
₹3,130 – ₹3,140 → Immediate intraday resistance
₹3,160 – ₹3,170 → Strong resistance zone; a breakout may extend upward momentum
₹3,200 – ₹3,210 → Major resistance; surpassing this can fuel a more sustained rally
Intraday Trend Outlook (30M Chart)
The trend appears mildly bullish as long as TCS holds above ₹3,080.
A clear move above ₹3,140 can open the path toward ₹3,160–₹3,200.
If it falls below ₹3,050, price may pull back toward ₹3,020, and a break under that could signal further downside.
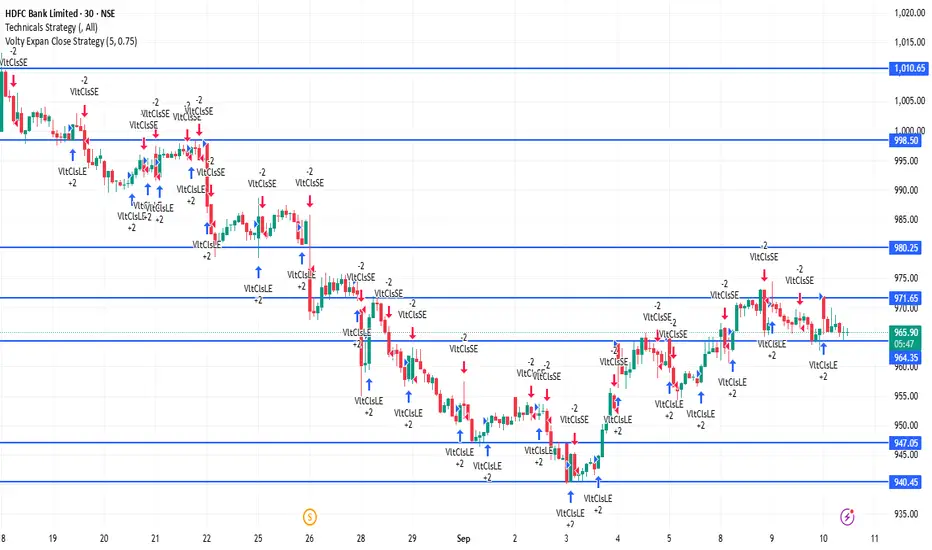
HDFCBANK 30Minutes Time frameHDFC Bank – 30M Important Levels (Current)
These levels are calculated using today’s intraday pivot data and provide reliable reference points for short-term trading.
Pivot Point (Mid-Level): ~₹967
First Resistance (R1): ~₹972
Second Resistance (R2): ~₹979
First Support (S1): ~₹960
Second Support (S2): ~₹955
These intraday pivots help highlight key zones where intra-day price action often stalls, reverses, or accelerates.
Intraday Trend Outlook (30M Chart)
Above ₹972: Bullish momentum may continue, with potential upside toward ~₹979.
Between ₹960 – ₹972: Neutral-to-bullish range; watch for sustain or reversal.
Below ₹960: Bearish pressure may build, potentially testing down to ~₹955.
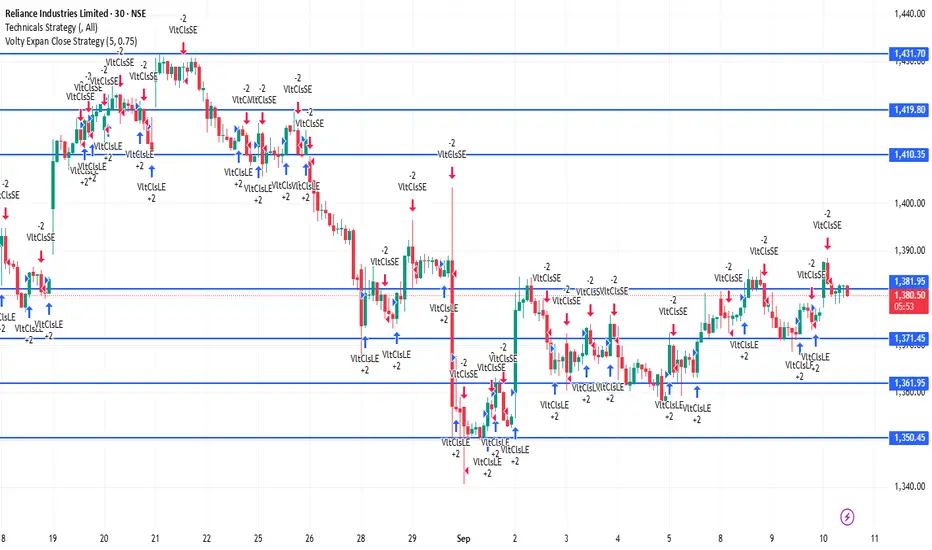
RELIANCE 30Mitunes Time frame📊 Reliance Industries (30M Chart)
Current Zone: Trading around ₹1,380–₹1,382.
🔻 Support Levels:
₹1,375 → Immediate intraday support
₹1,369–₹1,370 → Strong support zone
₹1,362–₹1,363 → Major support
🔺 Resistance Levels:
₹1,382–₹1,383 → Immediate hurdle
₹1,387–₹1,388 → Strong resistance zone
₹1,394–₹1,395 → Major resistance
📈 Trend Outlook (30M):
Above ₹1,383 → Momentum stays bullish, price may push toward ₹1,388–₹1,395.
Between ₹1,369–₹1,382 → Neutral to slightly bullish consolidation zone.
Below ₹1,369 → Weakness may drag price toward ₹1,363 or lower.
State Bank Of India ---- Deep Analysis________________________________________
Technical Research Report on SBI (NSE: SBIN)----------
Segment: Equity – Large Cap
Sector: Banking – PSU
Analyst: Hitesh Tailor
Date: July 29, 2025
Time Frames Analyzed: Daily Time Frame
________________________________________
1. Performance Summary--------------
State Bank of India (SBIN) is currently at a key technical levels. The stock recently showed a bearish divergence on the RSI while approaching an extreme orderblock near ₹840.60. A rejection from this level with divergence confirmation indicates potential downside towards the imbalance zone and deeper OB + FVG zones. Currently trading around ₹798.30, the bias is cautious bearish for swing traders.
________________________________________
2. Stock Profile--------------
Parameter Details
Company Name State Bank of India (SBI)
Ticker Symbol SBIN (NSE)
Sector PSU Banks
Market Cap ₹6.5+ Lakh Crores (approx.)
52 Week High/Low ₹899.65 / ₹666.30
CMP (as of July 29, 2025) ₹799.20
________________________________________
3. Chart Setup & Timeframe Analysis----------
A. Daily Timeframe
• Trend: Recent lower high and lower low structure (LL)
• Pattern: Bearish RSI divergence + rejection from Order Block (OB) zone
• Support Zone: ₹770 – ₹760 (Gap imbalance support zone)
• Resistance Zone: ₹840.60 – ₸899.65 (OB and extreme resistance)
• Price Action View: Price rejected from OB with clear bearish divergence and a breakdown below short-term structure. Weakness expected until FVG zone.
B. Weekly Timeframe
• Trend Continuity: Mixed. Long-term trend intact, but facing supply pressure near 52-week highs
• Price Relative to EMA: Trading near 200 EMA; watching for hold or breakdown
C. Intraday 1H Timeframe
• Outlook: Price showing LH-LL structure. Short-term liquidity grab may occur before downside continuation.
________________________________________
4. Technical Indicators-----------------
Indicator Observation
Moving Averages Price below 20 EMA but above 200 EMA – Neutral to Bearish
RSI (14) ~42 with bearish divergence (daily)
MACD -- Not analyzed
Volume -- Not Analyzed
Bollinger Bands -- Not Analyzed
________________________________________
5. Key Technical Levels------------
Type Price (₹)
Immediate Support 770.00
Major Support 700.00 (OB + FVG)
Resistance 1 840.60
Resistance 2 899.65
CMP 798.30
________________________________________
6. Trade Idea / Recommendation-------------
Swing Sell Setup (1–2 Weeks)
• Sell Zone: ₹800 – ₹820
• Target 1: ₹770.00
• Target 2: ₹700.00
• Stop Loss: ₹845.00
• Risk-Reward Ratio: Approx. 1:2.5
Bias: Bearish below ₹820. Reversal confirmation only above ₹840.60.
________________________________________
7. Risk Factors------------
• Positive PSU bank sector news or surprise earnings could invalidate downside
• Global risk-on events may cause aggressive short-covering
• RBI interventions or policy rate changes
________________________________________
8. Conclusion------------
SBI appears technically weak after facing rejection from a strong supply zone marked by an extreme orderblock and bearish RSI divergence. Price is below short-term EMAs and breaking structure levels, pointing towards downside potential. Traders can consider short trades with a strict stop loss and monitor price behavior near imbalance and FVG zones.
________________________________________
Disclaimer: This Technical Research Report is made for Educational Purpose Only. Do not consider it as any Investment idea. I'm not SEBI Registered Research Analyst. Consult your Registered Financial Advisor Before Investment.
-------------------------------------------------------------------------------------------------------------------
Your Views or Comments are Most Welcome.
Hit like if you find these insights helpful.
-------------------------------------------------------------------------------------------------------------------
Regards,
Hit_Analyst
