HINDUNILVR: Smart Money Accumulation Zone After CHoCH?📘 HINDUNILVR (HUL) — Technical Analysis | Structure Shift & Golden Retracement Setup
(Timeframe: Daily)
HINDUNILVR is currently trading around ₹2,265 after a prolonged corrective phase.
The chart reflects a Change of Character (CHoCH) followed by a controlled retracement into a high-probability demand zone, where the next directional move is likely to emerge.
🔍 Market Structure & Price Action
The stock previously witnessed a strong bullish extension, reaching the 113%–128% Fibonacci extension zone, indicating an overextended move.
Post extension, price showed loss of bullish momentum, leading to a CHoCH — a clear signal of shifting market control.
CHoCH highlights early trend transition and often leads to range-bound or corrective price action, rather than an immediate trend reversal.
📌 CHoCH helps traders prepare for structural transitions before confirmation from higher highs.
📐 Fibonacci & Wave Context
The decline from point A to B appears corrective, not impulsive.
Price has now entered the Golden Retracement Zone (50%–78%) of Wave A.
This zone is typically where Wave B or Wave 2 attempts to develop.
Institutional participants often accumulate positions here due to favorable risk–reward.
📌 Failure to hold this zone often results in a deeper correction or trend reversal.
🎯 Key Levels from the Chart
Major Demand Zone: ₹2,230 – ₹2,200
Invalidation Level: Day close below ₹2,200
First Target: ~₹2,630 (≈ 78% retracement of Wave AB)
Second Target: ₹2,826 – ₹2,888
🧭 Trading Strategy (Swing / Positional)
Look for long opportunities only inside the ₹2,230–₹2,200 zone.
Prefer confirmation signals such as:
– Bullish rejection wicks
– Higher-low formation
– Minor CHoCH on lower timeframes
Avoid aggressive entries without confirmation.
🛑 Risk Management
Strict stop loss: Day close below ₹2,200
A close below this level indicates weak demand and opens the risk of extended downside correction.
Partial profit booking recommended near Target 1.
Trail stop aggressively if price sustains above ₹2,630.
📚 Educational Notes
Golden Retracement (50%–78%) is where institutions seek value-based entries.
CHoCH ≠ Trend Reversal — it signals momentum loss, not instant bearishness.
Confirmation always comes from structure + demand holding, not prediction.
🔮 Probable Scenarios
Bullish Case:
Holding above ₹2,200 → Base formation → Gradual recovery toward ₹2,630 → ₹2,826–2,888.
Bearish Case:
Day close below ₹2,200 → Demand failure → Deeper corrective phase.
📌 Conclusion
HINDUNILVR is positioned at a critical inflection zone.
Risk is clearly defined, while upside potential remains asymmetric.
This is a wait-for-confirmation accumulation setup, not a chase trade.
⚠ DISCLAIMER
I am not a SEBI-registered analyst.
This analysis is for educational purposes only and should not be considered investment advice.
Always use your own analysis and risk management.
Stockpicks

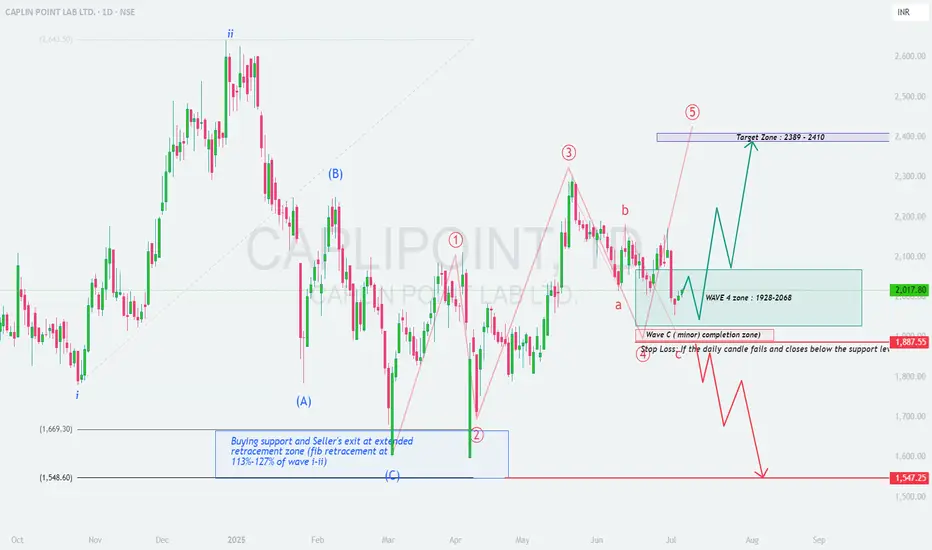
CAPLIPOINT : A Textbook Elliott Wave Correction Unfolding
\ Timeframe:\ Daily
\ Structure:\ Corrective to Impulsive
\ Type:\ Educational Swing Setup
---
🔍 \ 1. Context and Background:\
CAPLIPOINT has exhibited a classic 5-wave impulsive rally followed by a correction phase, aligning neatly with \ Elliott Wave Theory\ . Currently, the stock appears to be in \ Wave 4 correction\ – often a shallow, sideways or ABC-type pattern – preparing for a potential \ Wave 5 impulse\ .
---
📈 \ 2. Wave Structure Breakdown:\
* \ Wave 1 to Wave 3\ completed with good strength.
* \ Wave 3\ peaked near \ ₹2390\ , showing signs of extension.
* The ongoing \ Wave 4 correction\ seems to be forming a textbook \ ABC pattern\ :
* \ Wave A and Wave B\ completed.
* \ Wave C\ likely completed or very close to completion inside the support zone.
---
🟦 \ 3. Wave 4 Correction Zone – ₹1928 to ₹2068:\
This zone offers a \ high-probability reversal area\ supported by:
* \ 38.2%–50% Fibonacci retracement\ of Wave 3.
* Confluence with \ previous consolidation\ support.
* Price action showing \ long wicks and small candles\ , signaling accumulation or demand.
---
🟥 \ 4. Wave C and Critical Support – ₹1887:\
* ₹1887 is likely the \ end of Wave C\ and the complete ABC correction.
* Based on:
* \ 113%–127% Fibonacci extension\ of Wave A (classic C-wave completion area).
* Strong \ volume spike and price rejection\ near this zone.
---
🟪 \ 5. Wave 5 Target Projection – ₹2389 to ₹2410:\
Projected using:
* \ Fibonacci extension\ of Wave 1 from Wave 4 low.
* \ Measured move technique\ .
* Target aligns with previous resistance around \ Wave 3 top at ₹2390\ .
---
🛑 \ 6. Stop Loss & Invalidation Level:\
* \ Invalidation below ₹1887\ on a daily close.
* A close below this would signal a potential \ deeper correction\ toward ₹1547–1660 zone.
---
✅ \ 7. Strategic Swing Trade Plan:\
* \ Entry Zone:\ ₹1930 – ₹2065
* \ Stop Loss:\ ₹1887 (daily close basis)
* \ Target 1:\ ₹2250
* \ Target 2:\ ₹2389–2410 (projected Wave 5 zone)
---
### 🧠 \ 8. Why This Setup is Educational:\
* \ Textbook Elliott Wave Pattern:\ Classic 5-wave setup with ABC correction.
* \ Fibonacci Confluence:\ Retracement and extensions align perfectly.
* \ Price Action Validation:\ Support zone showing bullish characteristics.
* \ Defined Risk-Reward:\ Excellent R\:R with tight SL.
* \ Momentum Potential:\ Wave 5 often brings sharp, fast moves—ideal for swing setups.
---
📌 \ Conclusion:\
CAPLIPOINT is completing a clean \ Wave 4 correction\ and preparing for its \ final impulsive Wave 5\ . If \ ₹1887\ holds, the stock may target \ ₹2389–2410\ in the coming sessions. A technically rich and structurally strong swing opportunity for serious traders and wave enthusiasts.
ZENTEC: Wave 4 Correction Complete – Ready for the Next wave?ZEN TECHNOLOGIES LTD (NSE: ZENTEC) – Daily Chart Analysis 🚀
Elliott Wave Structure | Fibonacci Retracement | Swing Targets
1. Why This Setup? 🤔
ZEN Technologies is showing a classic Elliott Wave structure, and the recent price action suggests a high-probability bullish reversal. Here’s why:
Wave 4 Correction Completed: The stock has retraced between the 38.2% (₹1,899) and 61.8% (₹1,671) Fibonacci levels of Wave 3, which is a textbook correction zone for Wave 4.
ABC Pattern: The correction unfolded as an ABC pattern, with the (C) leg finding support in the golden fib zone.
Change of Character (CHoCH): Multiple CHoCH points on the chart indicate a shift from bearish to bullish sentiment, suggesting that sellers are exhausted and buyers are stepping in. 🟢
2. Key Levels & Trade Plan 📊
Current Price: ₹1,880
Support Zone: ₹1,899–₹1,671 (38.2%–61.8% retracement of Wave 3) 🟢
First Swing Target Zone: ₹2,487–₹2,658 🟢
Second Target Zone: ₹2,849–₹3,085 (113%–127% extension of last major swing) 🟢
Why these targets?
The first target zone aligns with the projected completion of Wave 5, based on previous impulse waves.
The second target zone is calculated using the 113%–127% Fibonacci extension of the last major swing, a common area for extended moves in strong trends.
3. Risk Management 🛡️
Entry: Accumulate near current levels or on dips into the support zone. 🟢
Stop Loss: Daily close below ₹1,670 (61.8% retracement) to protect capital. 🔴
Targets:
1️⃣ First Target: ₹2,487–₹2,658 🟢
2️⃣ Second Target: ₹2,849–₹3,085 🟢
4. Technical Summary & Cautions 🟠
The completion of Wave 4 correction sets the stage for a potential Wave 5 rally .
Bullish momentum is likely to pick up above ₹1,900, with strong upside potential towards the target zones.
Caution: If price closes below ₹1,670 on a daily basis, the bullish setup is invalidated and further downside is possible. 🟠
Watch for confirmation candles and volume spikes for added conviction! 📈
Conclusion:
ZEN Technologies is offering a high-probability swing setup after a healthy correction. The risk/reward is attractive for positional traders, provided stops are respected. The technicals suggest a new uptrend could be starting, with clear targets and a logical stop loss. 🟢
Like & Follow for more setups! 👍✨
#ZENTEC #ElliottWave #SwingTrade #TechnicalAnalysis #TradingView #Stocks #NSE #Fibonacci #Breakout #StockMarket 🚀
HILTON : Reversal confirmed?
## 📘 \ HILTON METAL FORGING – Potential Reversal Setup Based on Elliott Wave Completion\
\ Timeframe:\ Daily
\ Structure:\ Completed 5-Wave Impulse (Bearish) → Recovery in Progress
\ Type:\ Swing Trade Setup | Wave Theory Based
---
### 🔍 \ 1. Context and Background:\
HILTON has completed a \ five-wave impulsive decline\ from highs of \~₹190 to a bottom near ₹50, signaling the end of a strong downtrend.
According to \ Elliott Wave Principles\ , after a completed 5-wave impulse, a corrective \ ABC structure\ (retracement) generally follows.
Current chart indicates that \ Wave 5 is complete\ and recovery is underway in the form of Wave A → B → C.
---
### 🔢 \ 2. Wave Count Overview:\
* \ Wave 1:\ Initial sharp decline
* \ Wave 2:\ Pullback to previous support
* \ Wave 3:\ Extended and steep fall
* \ Wave 4:\ Retracement to 50%-61.8% Fib zone (₹119.99–₹130.94)
* \ Wave 5:\ Final sell-off completing around ₹50–52 zone with capitulation
\ Note:\ Volume on Wave 5 bottom shows signs of exhaustion and early accumulation.
---
### 🧩 \ 3. Current Structure – Recovery Begins:\
* The chart marks the \ first rally without volume\ (Wave A)
* Followed by a correction forming \ Wave B (intermediate zone: ₹58–67)\
* Now tracking potential for Wave C upside, targeting key retracement zones
---
### 🎯 \ 4. Trade Levels and Projections:\
* \ Entry Zone:\ ₹58–67 (Wave B demand zone)
* \ First Target:\ ₹56–62 (gap-fill and prior resistance – conservative swing)
* \ Second Target:\ ₹132–142 (Extended retracement of Wave 4) – for positional traders
* \ Stop Loss:\ Below ₹56 (especially if the recovery wave fails or structure breaks)
---
### 🔍 \ 5. Technical Confluences:\
* \ Wave 4 retracement zone:\ ₹119.99–130.94 = 50–61.8% of Wave 3
* \ Extended retracement target:\ ₹132–142 (potential C-wave projection)
* \ Volume Analysis:\ Low volume rally followed by corrective dip shows early signs of base building
---
### ✅ \ 6. Strategic Notes:\
* \ This setup is ideal for swing or short-term positional traders\ aiming for 1:2+ RR
* Structure aligns with post-impulsive recovery behavior as per Elliott Wave
* \ Low-risk accumulation\ possible near ₹58–62 with defined SL
* Best trades come from structure + sentiment shift – both are visible here
---
### 📌 \ Conclusion:\
HILTON METAL appears to have \ completed its 5-wave downtrend\ and is entering a corrective phase.
The current \ Wave B zone (₹58–67)\ offers a good risk-managed opportunity to participate in the \ Wave C upside\ toward ₹132–142.
Traders must monitor price action and volume closely around the current level and protect downside with a stop below ₹56.

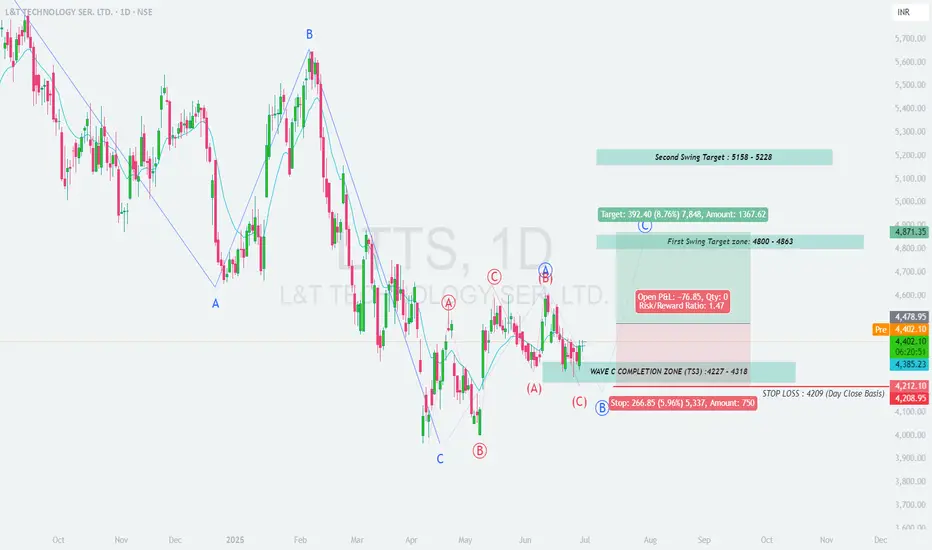
LTTS : Completing Wave B or Starting Corrective Wave 5?
## 📊 **LTTS Daily Chart Analysis**
### 🧩 **Price Structure Overview**
* The chart shows a completed **ABC correction** pattern.
* Price has recently bounced from a key \ support demand zone\ , marked by the blue and yellow boxes.
* A bullish wave structure is potentially forming, indicating trend reversal.
---
## 📉 **Support Zones**
* 📌 \ Primary Support Zone:\ ₹4280–₹4320 (yellow box)
* 📌 \ Structure Support (TS3 \ ):\ \~₹4225
Price recently reacted from these support areas with higher lows, hinting at buying interest and strength building.
---
## 📈 **Immediate Resistance / Supply Zones**
* 🟨 \ Minor Resistance Zone:\ ₹4620–₹4700 (yellow box)
* 🟦 \ Primary Resistance Zone / Target 1:\ ₹4800–₹4863
* 🟩 \ Extended Upside Target Zone:\ ₹5450–₹5650 (green box)
---
## 📝 **Trade Idea: Positional Long**
### ✅ \ Entry:\
* Around CMP (₹4405) or on dips towards ₹4300–₹4320 with bullish confirmation.
### 🎯 \ Targets:\
* \ T1:\ ₹4620
* \ T2:\ ₹4800–₹4863
* \ T3 (Extended):\ ₹5450–₹5650 (if trend sustains)
### ❌ \ Stop Loss:\
* Daily close below \ ₹4225\ (below TS3 low)
---
## 🧠 **Trade Logic & Strategy**
* Price has respected the support zones and formed a possible reversal structure.
* If the stock breaks above the ₹4620–₹4700 zone, it can accelerate toward the ₹4800+ levels.
* Conservative traders can enter after a daily close above ₹4620.
---
## 📌 **Conclusion**
LTTS is setting up for a potential **bullish swing move**.
A structure-based entry near support with defined SL offers a favorable **risk-to-reward** setup for positional traders.
Weakly Technical Analysis - Oriental Rail Infrastructure LimitedOriental Rail Infrastructure Limited (ORIL), formerly known as Oriental Veneer Products Limited, is a public limited company incorporated on March 8, 1991, and listed on the Bombay Stock Exchange (BSE: 531859) since July 24, 1996. Based in Thane, Maharashtra, ORIL is a key supplier to Indian Railways.
🇮🇳Chart for your reference

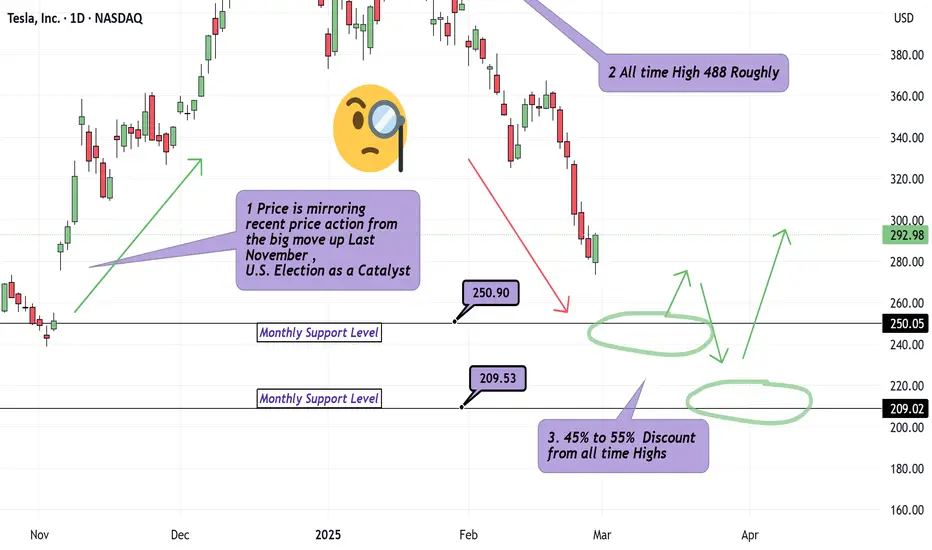
What is an Appropriate Tesla Discount? Multiple Timeframes!Hello Traders.. It's been too long.
We are back with our first analysis in over 4 months. We answer : What is an appropriate price to either jump on the train or scale into original positions on Tesla? Jumping in around 250, probably decent for at least a 4Hr to Daily Chart Swing. Safer Longs appear to be around 209 as I have outlined with green arrows, labeling the multiple pivots in the recent 5 Year range on Tesla. Tesla is coming down alongside the broader Indices which can be expected. Just because Friday Feb 28th showed us a Solid Hammer looking candle suggesting strong buying power, this does not mean much to me for 3 reasons.
1) This price action has developed in the middle of the move up we observed during Election week late last year.
2) The candle closed without a top wick and so the next daily candle , in theory, has no range to fill moving forward.
3) Momentum at the moment is also Bearish.
Discipline Traders! Leave a comment or Boosted rocket if you'd like to see similar analysis.
Mark Minervini: Master of Trend Following and Risk Management!Mark Minervini: Master of Trend Following and Stock Market Success
Hello everyone! Today, we’re diving into the world of Mark Minervini , a U.S. stock trader and author who has made a significant impact in the trading world. Known for his trend-following strategies and risk management mindset , Minervini is widely respected for his disciplined approach to the market.
Mark Minervini’s philosophy is built around timing the market right, managing risk, and investing in stocks with momentum . His success can be attributed to his ability to combine technical analysis , fundamental analysis , and strict risk management into a coherent strategy.
Mark Minervini’s Key Trading Principles
Buy High, Sell Higher: Minervini’s strategy is focused on buying stocks at breakout points , when they are moving above previous highs, signaling strong momentum and potential for larger gains.
Look for Stocks with Strong Fundamentals and Technicals: He believes in a balanced approach, using both fundamental analysis and technical indicators to identify stocks that have the potential to deliver strong returns.
The 90-90 Rule: Minervini’s 90-90 rule suggests that 90% of the time, the market moves with the top 10% performing stocks , and those top-performing stocks often deliver massive returns.
Cut Losses Quickly and Let Profits Run: A central principle of Minervini’s strategy is risk management . He advocates cutting losses quickly and letting profits run , ensuring that small losses don’t turn into bigger ones.
Risk Management Mindset: Mark Minervini stresses the importance of having a risk management mindset when trading. Managing risk is just as important as identifying profitable trades. He advises traders to always protect capital , as this is the foundation of long-term success in the market.
Stay Disciplined and Follow a System: Minervini’s success is rooted in his disciplined approach. He sticks to his rules and doesn’t deviate from his proven system, regardless of market fluctuations.
Mark Minervini’s Iconic Trades
✔ Stock Breakouts: Minervini made a fortune by buying stocks at breakout points where stocks are showing strong upward momentum.
✔ Growth Stocks in Bull Markets: He focuses on identifying high-growth stocks in strong bull markets, which consistently outperform the broader market.
✔ Precise Entry Points: Minervini does not just buy any stock but waits for specific technical patterns that suggest high-probability entry points.
What This Means for Traders:
By following Minervini’s principles, traders can:
Focus on high-performing stocks with upward momentum that break above key resistance levels.
Prioritize risk management and always be ready to cut losses to protect your capital.
Stay disciplined and follow a systematic approach that relies on precise entry points and controlled risk.
Leverage both technical and fundamental analysis to make smarter, more informed decisions.
Outcome:
Mark Minervini’s success is a result of his comprehensive approach to trading , which includes precise entry points, strong risk management, and a disciplined mindset. Traders who follow these principles can improve their results and take their trading to the next level.
What do you think of Mark Minervini’s trading approach ? Have you implemented any of his strategies in your own trades? Share your thoughts in the comments below!

Vijay Kedia: The Master of Long-Term Value Investing!Vijay Kedia: The Master of Long-Term Value Investing
Hello everyone! Today, I’m diving into the investment journey of Vijay Kedia , one of the most successful investors in India. Known for his long-term value investing , Kedia has achieved impressive returns by focusing on undervalued stocks with great potential. His disciplined approach and patience have been key to his success, and his mantra truly reflects his investing philosophy:
“Invest like a bull, sit like a bear, and watch like an eagle.”
This timeless philosophy teaches us that success comes from buying right, being patient, and waiting for the market to reward you . Let’s explore some of Kedia’s best multibagger holdings and how they played a major role in his wealth creation.
Vijay Kedia’s Multibagger Holdings
Vijay Kedia’s investing style revolves around finding hidden gems in the stock market with long-term growth potential. Here are some of the iconic stocks that have given him multibagger returns:
Cera Sanitaryware:-
Kedia’s investment in Cera Sanitaryware delivered over 100x returns. He spotted its potential early on when others missed it, believing in companies with a strong brand, high demand, and solid growth fundamentals.
Atul Auto:-
Atul Auto , a manufacturer of three-wheelers, gave nearly 30x returns. Kedia’s bet on its robust business model and market position paid off as the company became a sector leader.
Titan Company:-
Titan Company is a multibagger in Kedia’s portfolio. He recognized its potential in the watch and jewelry market long before it became a household name. The stock has delivered massive returns due to its brand strength and consistent growth .
Procter & Gamble Hygiene:-
Kedia’s investment in Procter & Gamble Hygiene highlighted his strategy of investing in companies with strong market dominance and global reach. The stock has significantly appreciated over time, giving Kedia impressive returns.
V-Guard Industries:-
V-Guard Industries has been another outstanding multibagger. Kedia saw its potential in the growing infrastructure and industrial sector in India, making it a solid long-term investment.
What We Can Learn from Vijay Kedia’s Investment Journey
Vijay Kedia’s approach to investing is grounded in several key principles that every trader and investor should consider:
Focus on the Long Term: Kedia believes in buying great businesses and holding them forever. The idea is not to chase short-term gains but to invest in companies that will compound over time.
Strong Fundamentals and Management Quality: For Kedia, management quality is paramount. He invests in companies with ethical, efficient management that focuses on creating long-term value for shareholders.
Patience Pays Off: Kedia’s ability to wait for the right opportunities to mature has been key to his success. His investments often take time to realize their true value, but patience rewards those who stick with their strategy.
Trust Your Analysis, Don’t Follow Trends: Kedia stresses the importance of individual analysis and not following market trends blindly. He chooses stocks based on fundamentals, not market hype.
Outcome:
Vijay Kedia’s investment philosophy is a great lesson for traders and investors alike. Investing with patience, focusing on quality stocks, and staying true to your research can create tremendous wealth over time. Kedia’s portfolio is a testament to the power of long-term value investing, and his story continues to inspire the next generation of investors.
What do you think of Vijay Kedia’s approach to investing ? Have you invested in any of his recommended stocks? Share your thoughts in the comments below!

Love is in the Air: Top Wedding Stocks in this season◉ Abstract
The Indian wedding industry is a huge part of the economy, worth about ₹10 lakh crore (around $130 billion), making it the fourth largest industry in India after food and groceries. Families spend a lot on weddings, often around ₹12 lakh (about $15,000), which is more than what they spend on their children's education. Every year, India sees around 80 lakh to 1 crore weddings, mostly during the busy season from October to December.
This industry includes important sectors like jewelry, clothing, hospitality, and travel, with bridal jewelry making up over half of all jewelry sales. As incomes rise and people spend more on luxury weddings, the industry is expected to grow even more, supported by government efforts to promote India as a top wedding destination.
Read full analysis here:
◉ Introduction
The Indian wedding industry is a vibrant and expansive sector, estimated to be worth approximately ₹10 lakh crore (around $130 billion), making it the fourth largest industry in India, following food and groceries. This industry is characterized by its cultural significance and economic impact, driving consumption across various sectors.
◉ Overview of the Indian Wedding Industry
● Economic Significance
➖ The Indian wedding economy is a major driver of economic activity, with families spending substantial amounts on weddings, often exceeding expenditures on education for children. On average, an Indian wedding costs around ₹12 lakh (approximately $15,000).
➖ The industry is projected to grow significantly, with estimates suggesting it could expand by 3.7 times over the next five years due to rising incomes and changing consumer preferences.
● Wedding Season Dynamics
➖ India hosts about 80 lakh to 1 crore weddings annually, primarily peaking between October and December. This period coincides with festive seasons, further boosting spending.
➖ Weddings in India are known for their grandeur and can include elaborate celebrations lasting several days, often with thousands of guests.
◉ Three Major Sectors Within the Industry
The Indian wedding industry encompasses various sectors that contribute to its overall growth:
i. Jewellery:
➖ This sector is the largest beneficiary, with bridal jewellery accounting for over 50% of all jewellery sales in India.
Stock to keep on radar from this sector:
1. Titan NSE:TITAN
2. Kalyan Jewellers NSE:KALYANKJIL
3. Senco Gold NSE:SENCO
ii.Apparel:
➖ Weddings contribute to around 10% of the apparel market, with significant demand for bridal wear.
Stock to keep on radar from this sector:
1. Vedant Fashions NSE:MANYAVAR
2. Aditya Birla Fashion & Retail NSE:ABFRL
3. Arvind Fashions NSE:ARVINDFASN
4. Raymond NSE:RAYMOND
iii.Travel and Hospitality:
➖ Destination weddings are gaining popularity, leading to increased demand for hotels and travel services.
Stock to keep on radar from this sector:
1. The Indian Hotels NSE:INDHOTEL
2. EIH Limited NSE:EIHOTEL
3. Chalet Hotels NSE:CHALET
4. Interglobe Aviation NSE:INDIGO
◉ Future Prospects
The Indian wedding industry is expected to continue its robust growth trajectory due to:
● Increasing disposable incomes among the younger population.
● A growing trend towards luxury spending on weddings.
● Government initiatives like the "Wed in India" campaign aimed at promoting India as a premier wedding destination globally.
◉ Conclusion
In conclusion, the Indian wedding industry not only holds significant cultural importance but also serves as a powerful economic engine impacting various sectors across the country. As consumer preferences evolve and economic conditions improve, this industry is poised for substantial growth in the coming years.

IREDA -INVESTMENT OPPORTUNITY IREDA is down 15-20% from it's high but it's financials are strong.
Price action on charts also trying to say it can move upside but confirmation will be when price test it's previous resistance and hold that levels and break resistance.
If this price action is formed on charts then price will move towards its major resistance.

HCLTECH - STOCK ON RADAR#HCLTECH
Day Trendlyne Momentum Score
66.3
Score is 66.29, stock is technically moderately strong. Stocks with score between 60 and 70 are considered as technically Moderately Strong.
Day RSI(14)
RSI is 67.8, RSI below 30 is considered oversold and above 70 overbought.
HCL Technologies Ltd. has made a new 52 week high today.

National Aluminium Company Ltd. (EDUCATIONAL PURPOSE ONLY)There is no guarantee in Stock market and Nothing over week.
STOCK TO STUDY (EDUCATIONAL PURPOSE ONLY, NOT BUY OE SELL RECOMMENDATIONS)
National Aluminium Company Ltd.
TARGET RS 223
CMP RS 222.92
ENTRY RANGE RS 220-226
STOP LOSS RS 200
Disclaimer: I am not Sebi Registered.

Dr. Lal Pathlabs Ltd (EDUCATIONAL PURPOSE ONLY)There is no guarantee in Stock market and Nothing over week.
STOCK TO STUDY (EDUCATIONAL PURPOSE ONLY, NOT BUY OE SELL RECOMMENDATIONS)
Dr. Lal Pathlabs Ltd
TARGET RS 3670
CMP RS 3495.30
ENTRY RANGE RS 3460-3530
STOP LOSS RS 3240
Disclaimer: I am not Sebi Registered.

Angel One Ltd - Breaking Barriers, Eyeing the Next MoveWe’ve got a breakout on our hands with Angel One Ltd! The yellow line in the chart is a counter-trendline that’s been rejecting price action multiple times. But now, we’re seeing some serious strength as the stock has blasted through it with authority. This signals a potential shift in momentum.
Supporting this move is the green trendline, showing that the stock is not just breaking out—it’s bouncing off a solid foundation of support. The market clearly respects this level, adding confidence to the bullish outlook.
But here’s where it gets interesting—I've added two white dotted lines, my "hidden hurdles." These are potential areas of resistance that might slow the stock down for a bit. Don't be surprised if we see some consolidation around this zone.
Now, check out the red box, which hints at a possible short-term pullback or sideways movement—just a breather before the next leg up! After this, I'm eyeing a strong bullish candle (marked by the green box) to close above resistance, setting the stage for an exciting trade opportunity.
The final piece of the puzzle? I’ll be planning my risk-reward strategy only after that confirmation candle is locked in. For now, I’m keeping this one on my radar—this stock could be setting up for something big!

PIDILITE INDUSTRIES LIMITED (EDUCATIONAL PURPOSE ONLY,)There is no guarantee in Stock market and Nothing over week.
STOCK TO STUDY (EDUCATIONAL PURPOSE ONLY, NOT BUY OE SELL RECOMMENDATIONS)
PIDILITE INDUSTRIES LIMITED
TARGET RS 3530
CMP RS 3363.45
ENTRY RANGE RS 3330-3395
STOP LOSS RS 3215
Disclaimer: I am not Sebi Registered.

GRANULES INDIA LIMITED (EDUCATIONAL PURPOSE ONLY)There is no guarantee in Stock market and Nothing over week.
STOCK TO STUDY (EDUCATIONAL PURPOSE ONLY, NOT BUY OE SELL RECOMMENDATIONS)
GRANULES INDIA LIMITED
TARGET RS 585
CMP RS 556.10
ENTRY RANGE RS 550-562
STOP LOSS RS 530
Disclaimer: I am not Sebi Registered.

NESTLE INDIA LIMITED ( EDUCATIONAL PURPOSE ONLY)There is no guarantee in Stock market and Nothing over week.
STOCK TO STUDY (EDUCATIONAL PURPOSE ONLY, NOT BUY OE SELL RECOMMENDATIONS)
NESTLE INDIA LIMITED
TARGET RS 2835
CMP RS 2699.55
ENTRY RANGE RS 2670-2725
STOP LOSS RS 2500
Disclaimer: I am not Sebi Registered.

JSW STEEL LIMITED (EDUCATIONAL PURPOSE ONLY)There is no guarantee in Stock market and Nothing over week.
STOCK TO STUDY (EDUCATIONAL PURPOSE ONLY, NOT BUY OE SELL RECOMMENDATIONS)
JSW STEEL LIMITED
TARGET RS 980
CMP RS 932.80
ENTRY RANGE RS 922-945
STOP LOSS RS 910
Disclaimer: I am not Sebi Registered.


HINDALCO INDUSTRIES LIMITED (EDUCATIONAL PURPOSE ONLY)There is no guarantee in Stock market and Nothing over week.
STOCK TO STUDY (EDUCATIONAL PURPOSE ONLY, NOT BUY OE SELL RECOMMENDATIONS)
HINDALCO INDUSTRIES LIMITED
TARGET RS 720
CMP RS 685.10
ENTRY RANGE RS 678-692
STOP LOSS RS 635
Disclaimer: I am not Sebi Registered.

Amazing swing trading idea for 23 August I make educational content videos for swing / positional trading

MCX (EDUCATIONAL PURPOSE ONLY)There is no guarantee in Stock market and Nothing over week.
STOCK TO STUDY (EDUCATIONAL PURPOSE ONLY, NOT BUY OE SELL RECOMMENDATIONS)
Multi Commodity Exchange of India Ltd.
TARGET RS 4870
CMP RS 4636.35
ENTRY RANGE RS 4590-4685
STOP LOSS RS 4302
Disclaimer: I am not Sebi Registered.
