Geopolitical & US Macro WatchWhat Is Geopolitical & US Macro Watch?
This is a two-part term:
1. Geopolitical Watch
This refers to tracking and analyzing global political situations that can impact trade, oil, currency, defense, or investor confidence. Examples include:
Wars or conflicts (Ukraine-Russia, Israel-Gaza, China-Taiwan)
Global oil sanctions
Strategic alliances (e.g., BRICS+ expansion, NATO decisions)
Diplomatic tensions between countries
These events influence:
Crude oil prices
Foreign exchange rates
FII flows (Foreign Institutional Investment)
Global demand-supply outlooks
2. US Macro Watch
This focuses on tracking economic developments in the United States, the world's largest economy. Key areas to watch include:
Inflation reports (CPI, PCE)
US Federal Reserve interest rate decisions
Jobs data (non-farm payrolls, unemployment rate)
Retail sales, housing starts
US GDP growth
U.S. debt levels and political decisions on trade/tariffs
Because the US dollar is the world's reserve currency, and because Wall Street often sets the tone for global markets, these macro signals directly affect India’s equity market, bond yields, and rupee valuation.
🧠 Why Does This Matter to Indian Traders & Investors?
You may ask—“Why should I care about some news in the U.S. or Europe when I’m only buying shares of Indian companies?”
Here’s the reality:
Over 50% of the daily movement in Indian indices like Nifty and Sensex is now influenced by global cues.
Foreign investors (FIIs), who own a huge portion of Indian stocks, take buy/sell decisions based on global trends, not just local stories.
US interest rates affect where FIIs want to put their money—if US bonds are yielding more, they might pull out of India.
Crude oil, which India imports heavily, is priced globally—if a war breaks out, oil shoots up and hits inflation in India.
In short: What happens outside India often decides how India trades.
🔥 Major Geopolitical Risks in 2025
Let’s look at some real-world developments that have been shaking or supporting markets this year:
1. Russia-Ukraine Conflict (Still Ongoing)
Even in 2025, the war isn’t over.
It affects wheat prices, natural gas, and military spending globally.
India has been balancing ties with both Russia and the West, but disruptions affect commodity markets, logistics, and inflation.
2. Middle East Tensions (Gaza, Iran, Red Sea Attacks)
Ongoing conflicts have kept crude oil prices elevated.
Shipping through the Suez Canal and Red Sea has become riskier, increasing global logistics costs.
This directly affects India’s import bill, trade deficit, and rupee stability.
3. US–China Trade Friction
The US has imposed tech restrictions on China; China is retaliating.
If tensions escalate further, it will impact the global supply chain, especially for semiconductors, electronics, and electric vehicles.
Indian tech companies (like TCS, Wipro) may see ripple effects due to changes in global outsourcing dynamics.
4. Taiwan Risk
Any Chinese military action on Taiwan could be catastrophic for markets, especially in electronics and semiconductors.
Since semiconductors power everything from phones to EVs, even a threat here affects stocks globally.
📊 Key US Macro Trends Impacting Markets in 2025
1. US Inflation is Cooling, But Not Gone
After peaking in 2022, inflation has come down, but in 2025, it’s still sticky.
That means the Federal Reserve (US central bank) is not cutting rates as aggressively as markets hoped.
➡️ When the Fed keeps rates high:
US bond yields rise
FIIs pull money out of emerging markets like India
Nifty and Sensex feel the pressure
2. US Job Market Is Strong
A robust job market signals continued economic expansion, good for global demand.
This is why metals, IT, and manufacturing stocks in India rally when US jobs data is good.
3. The Fed’s Interest Rate Policy
The biggest global event each month is the Fed meeting.
If they cut rates, stocks rally globally.
If they pause or raise rates, money flows into safe assets like gold or the US dollar—hurting Indian equities.
Real-Time Example: July 2025
In July 2025, Indian markets have been:
Rallying due to strong US jobs data and earnings
Cautious due to potential Trump-era tariffs on countries buying Russian oil
Watching closely for US inflation print and Fed meeting signals
GIFT Nifty shows bullish strength in pre-market hours when the US ends green. But we’ve also seen sell-offs on days of oil spikes or war-related news.
🧭 How to Track These Developments (Even If You’re Busy)
Here’s a simple checklist for staying informed:
✅ Every Morning
Check GIFT Nifty
Read major global headlines (US data, oil prices, geopolitics)
Note the USDINR trend
Watch India VIX
✅ Every Week
Look at US job reports, inflation (CPI), and Fed speeches
Follow crude oil and gold charts
Track FII/DII activity
Keep an eye on shipping, metals, and defense-related stocks
✅ Final Thoughts
"Geopolitical & US Macro Watch" is not just a fancy term—it's a crucial lens for today’s markets. The biggest stock market moves often come not from company news but from macroeconomic surprises or global tensions.
In 2025, being globally aware gives you an edge:
You’ll avoid panic on news-driven crashes
You’ll better understand why your portfolio is up or down
You’ll identify trade setups ahead of others
👉 Think global, act local—that’s the new mantra for smart Indian investors.
If you want daily or weekly updates summarizing these events and their impact on Indian markets, let me know—I’ll be happy to prepare a custom watchlist or dashboard for you
Stocks!
LEARN INSTITUTIONAL TRADING✅ What is Institutional Trading?
Institutional trading focuses on understanding how big money flows in the market. Institutions trade in huge quantities, and their strategies revolve around manipulating prices to collect liquidity, triggering stop-losses, and creating false breakouts. Retail traders often lose money because they follow trends without understanding the market structure set by these institutions.
✅ What You Will Learn in Institutional Trading
1. Smart Money Concepts (SMC):
Learn how smart money (institutions) traps retail traders using fake breakouts, stop hunts, and liquidity grabs.
2. Market Structure:
Higher Highs (HH), Higher Lows (HL), Lower Highs (LH), Lower Lows (LL)
Break of Structure (BOS) and Change of Character (CHOCH)
This helps you predict market direction with logic, not emotions.
3. Order Blocks:
These are zones where institutions place large orders. You’ll learn how to identify them and trade with the big players.
4. Liquidity Pools:
Find out where stop-losses and pending orders are sitting in the market so you can trade smartly by targeting liquidity zones.
5. Entry & Exit Strategies:
Master high-probability entry techniques and learn proper risk management like institutional traders.
✅ Why Learn Institutional Trading?
Retail Trading Institutional Trading
Random entries Planned entries based on logic
Easily manipulated Trades follow the footprint of big players
Low win rate Higher win rate with patience
Emotional trading Rule-based, stress-free trading
✅ Benefits of Mastering Institutional Trading
🎯 Accurate Trades – Follow the market makers.
💸 Better Risk-Reward – Small stop-loss, bigger targets.
⏰ Trade Less, Earn More – No overtrading, only quality setups.
🧠 No Indicators Needed – Pure price action and market reading.
✅ Who Can Learn Institutional Trading?
✅ Beginners who want to start right.
✅ Retail traders who keep losing.
✅ Part-time traders looking for consistency.
✅ Anyone serious about becoming a profitable trader.
✅ Final Words:
Institutional trading teaches you how to trade with the smart money instead of against it. Once you master these strategies, you will understand market moves like a professional and make more consistent profits

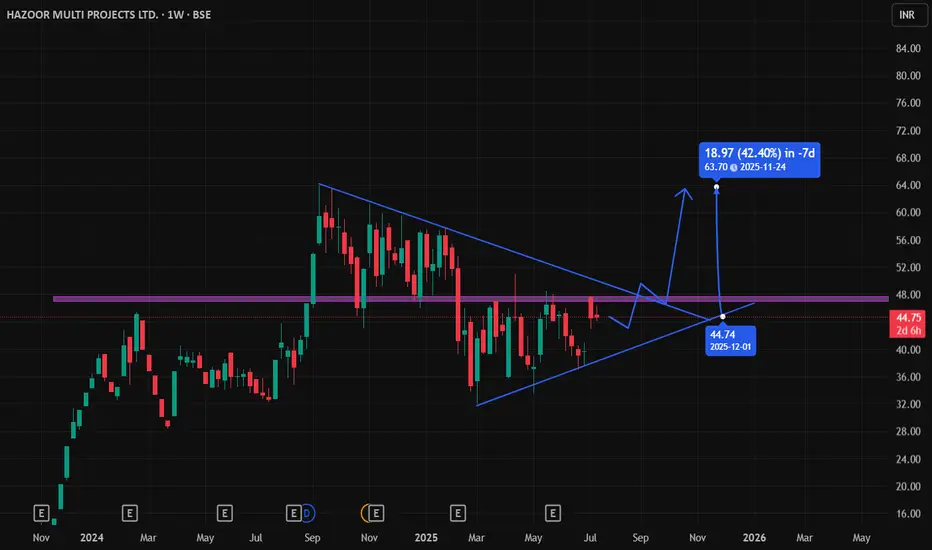
Hazoor Multi Projects Ltd – Long Bias Price Action SetupHazoor Multi Projects has recently shown a strong bullish structure, suggesting accumulation and breakout potential. After a steady phase of consolidation, the stock has formed a clean sequence of higher lows — a clear sign of demand stepping in at every dip.
A strong bullish candle has broken through a key resistance zone, closing well above recent highs with little to no upper wick. This kind of breakout, especially following tight range contraction, often indicates a shift in control from sellers to buyers.
Price is now stabilizing above the breakout level, showing signs of acceptance and strength rather than immediate rejection. The recent price action suggests that previous resistance has flipped into support, offering a solid foundation for a potential move higher.
The stock also appears to be building a fresh base just above the breakout point, hinting at trend continuation. As long as price holds above this new support, the bias remains bullish.
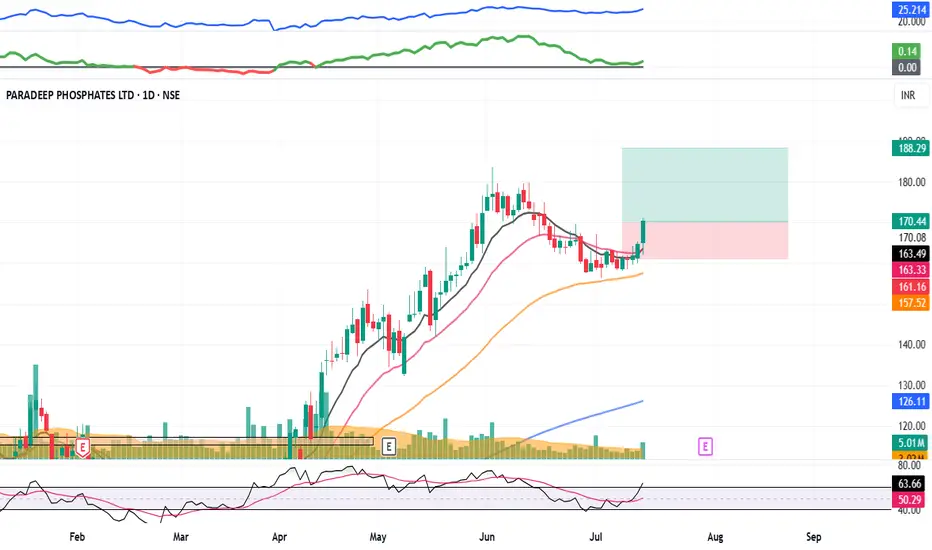
PARADEEP : Momentum Pick#PARADEEP #swingtrade #trendingstock #momentumtrade
PARADEEP : Swing Trade
>> Low PE Stock
>> Good Retracement and consoldation
>> Stock Ready for next leg of Rally
>> Good Strength & Volume
>> Risk Reward Favourable
Swing Traders can lock profit at 10% and keep Trailing
Please Boost, comment and follow us for more Learnings
Disc : Charts shared are for learning purpose only, not a Trade recommendation. Do your own research and consult your financial advisor before taking any position.
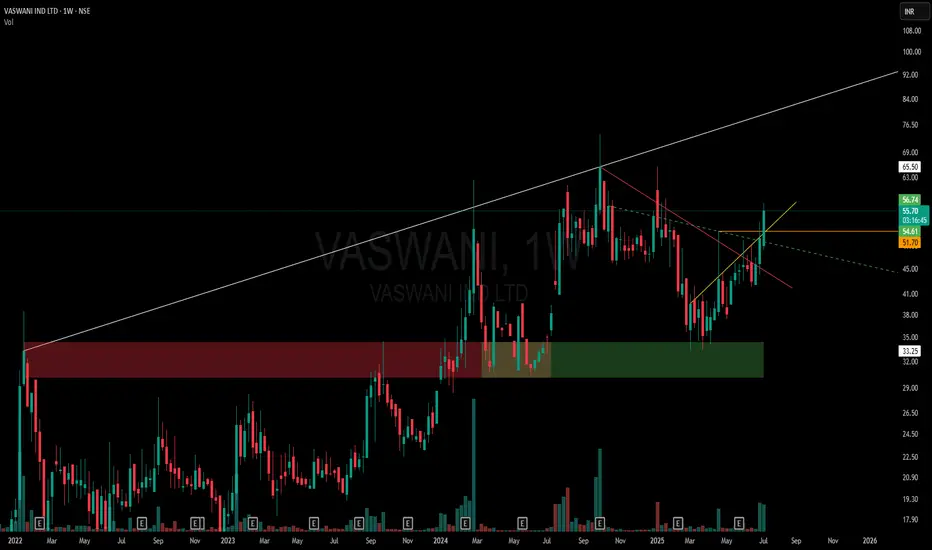
One-Sided Broadening Pattern | Pure Price Action Storytelling🔹 White Line: Captures the expanding higher-high resistance zone — part of the broader one-sided broadening pattern. Each new high is breaching the prior, giving the top side its expanding identity.
🔹 Horizontal Zone (Red to Green Shift): What once acted as a strong supply zone now flipped to a demand zone — price has respected this region multiple times, marking its evolution.
🔹 Red Line: A clean Counter-Trendline (CT) containing multiple touches, recently broken.
🔹 Yellow Line: A hidden diagonal resistance — tight and respected — offering another layer of confluence.
🔹 Green Dotted Line: Subtle hidden support built over time — watch how the structure was reacting along this line.
🔹 Orange Line: Marks wick-based rejection from a recent swing — subtle but clear evidence of supply exhaustion on that specific level.
🧠 This chart is not about predictions — it's about how beautifully price respects structure when drawn with logic and precision. Just charting. Just behavior. Just price.
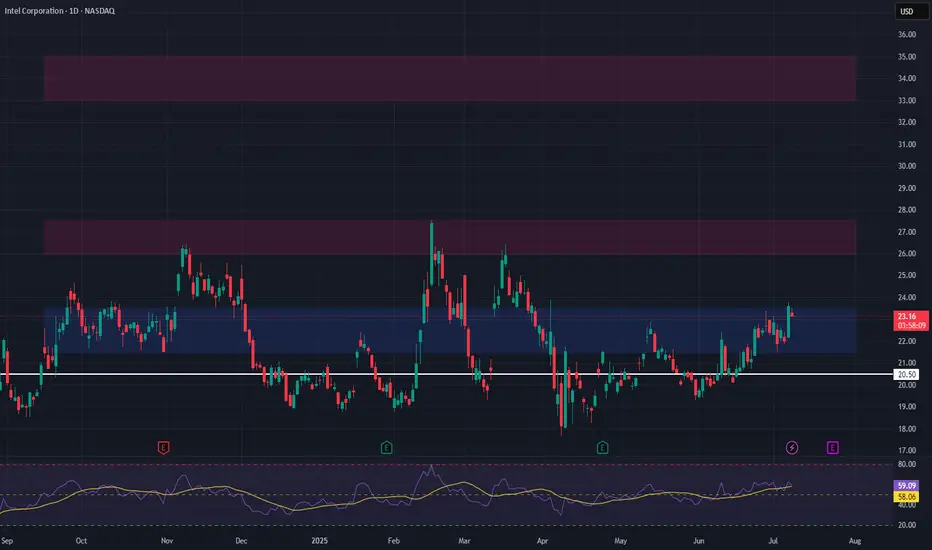
INTC Long Swing Setup – Break & Retest of Key ResistanceWe’re watching Intel NASDAQ:INTC for a clean break and retest of the $23.50 resistance level. A confirmed flip of this zone into support would signal trend strength and trigger a long spot entry.
📌 Trade Setup:
• Entry Zone: Around $23.50 (after confirmation as support)
• Take Profit Targets:
o 🥇 $26.00 – $27.50
o 🥈 $33.00 – $35.00
• Stop Loss: Daily close below $22.50
Zyduslife with negative divergenceZyduslife breached the supporting trendline, while a negative divergence with RSI for a bearish signal.
Entry, stop, and targets are all mentioned in the chart.

HILTON : Reversal confirmed?
## 📘 \ HILTON METAL FORGING – Potential Reversal Setup Based on Elliott Wave Completion\
\ Timeframe:\ Daily
\ Structure:\ Completed 5-Wave Impulse (Bearish) → Recovery in Progress
\ Type:\ Swing Trade Setup | Wave Theory Based
---
### 🔍 \ 1. Context and Background:\
HILTON has completed a \ five-wave impulsive decline\ from highs of \~₹190 to a bottom near ₹50, signaling the end of a strong downtrend.
According to \ Elliott Wave Principles\ , after a completed 5-wave impulse, a corrective \ ABC structure\ (retracement) generally follows.
Current chart indicates that \ Wave 5 is complete\ and recovery is underway in the form of Wave A → B → C.
---
### 🔢 \ 2. Wave Count Overview:\
* \ Wave 1:\ Initial sharp decline
* \ Wave 2:\ Pullback to previous support
* \ Wave 3:\ Extended and steep fall
* \ Wave 4:\ Retracement to 50%-61.8% Fib zone (₹119.99–₹130.94)
* \ Wave 5:\ Final sell-off completing around ₹50–52 zone with capitulation
\ Note:\ Volume on Wave 5 bottom shows signs of exhaustion and early accumulation.
---
### 🧩 \ 3. Current Structure – Recovery Begins:\
* The chart marks the \ first rally without volume\ (Wave A)
* Followed by a correction forming \ Wave B (intermediate zone: ₹58–67)\
* Now tracking potential for Wave C upside, targeting key retracement zones
---
### 🎯 \ 4. Trade Levels and Projections:\
* \ Entry Zone:\ ₹58–67 (Wave B demand zone)
* \ First Target:\ ₹56–62 (gap-fill and prior resistance – conservative swing)
* \ Second Target:\ ₹132–142 (Extended retracement of Wave 4) – for positional traders
* \ Stop Loss:\ Below ₹56 (especially if the recovery wave fails or structure breaks)
---
### 🔍 \ 5. Technical Confluences:\
* \ Wave 4 retracement zone:\ ₹119.99–130.94 = 50–61.8% of Wave 3
* \ Extended retracement target:\ ₹132–142 (potential C-wave projection)
* \ Volume Analysis:\ Low volume rally followed by corrective dip shows early signs of base building
---
### ✅ \ 6. Strategic Notes:\
* \ This setup is ideal for swing or short-term positional traders\ aiming for 1:2+ RR
* Structure aligns with post-impulsive recovery behavior as per Elliott Wave
* \ Low-risk accumulation\ possible near ₹58–62 with defined SL
* Best trades come from structure + sentiment shift – both are visible here
---
### 📌 \ Conclusion:\
HILTON METAL appears to have \ completed its 5-wave downtrend\ and is entering a corrective phase.
The current \ Wave B zone (₹58–67)\ offers a good risk-managed opportunity to participate in the \ Wave C upside\ toward ₹132–142.
Traders must monitor price action and volume closely around the current level and protect downside with a stop below ₹56.

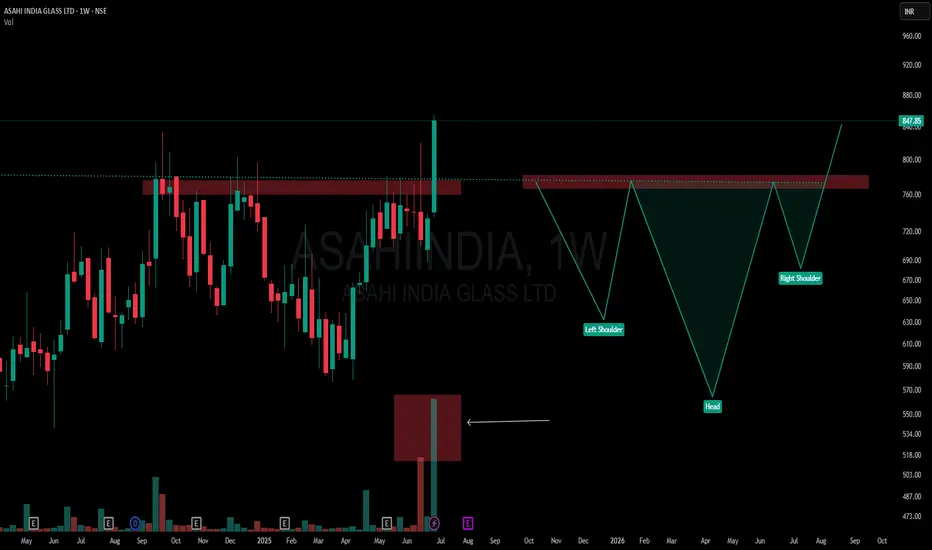
When Textbook Meets Extremes: Perfect Inverted Head and Shoulder📌 ASAHI INDIA GLASS | Weekly Timeframe
🧩 Pattern Breakdown (from a textbook lens):
-Left Shoulder: Formed after the Sept–Nov 2024 rejection
-Head: Created around Feb–May 2025 with a deeper dip
-Right Shoulder: Built through June 2025
-Neckline: ₹750–₹760 zone, tested multiple times
-Breakout Candle: High conviction — wide-bodied, strong close, with 17.61M volume
📘 According to classical technical analysis, Inverted Head & Shoulders patterns often signal a trend reversal. What's notable here is the context — the structure has developed after a sustained move upward, not from a bear phase.
🎯 The candle breaks above a long-standing supply zone with size, volume, and conviction — yet its location at the top makes it structurally interesting and unusual when viewed through traditional pattern psychology.
🚫 This is not a tip, call, or directional bias — just a visual log of structure and volume behavior.
💬 Chart interpretations welcome in comments.
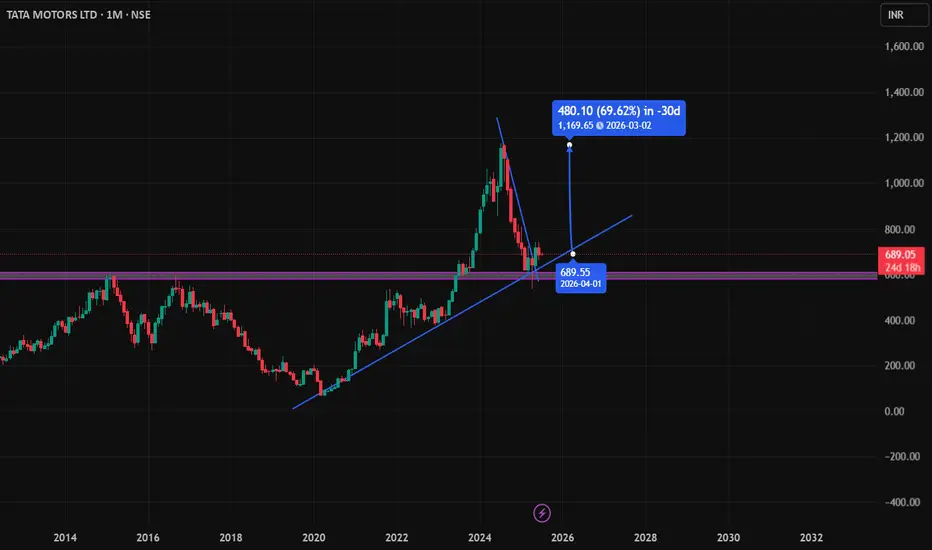
Tata Motors Long SetupTata Motors has confirmed a breakout from its recent downtrend, indicating a potential reversal. The breakout is supported by the formation of a strong bullish candle right at a key support zone, signaling renewed buying interest. This setup suggests favorable risk-reward for a long position, especially with increasing volume and momentum backing the move. Traders can consider entering above the breakout candle with a stop loss below the support.
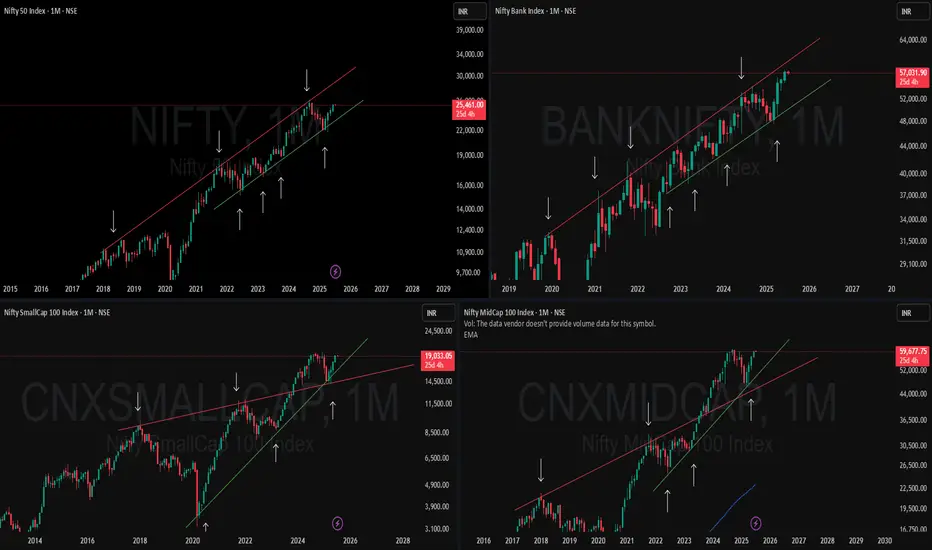
How These 2 Lines Caught Every Major Move in All 4 Indices! 📈 Keep It Simple, Keep It Powerful
When price action starts making sense, you’ll realize how far a single Support and Resistance line can take you.
🟥🟩 NIFTY & BANKNIFTY – Two clear examples of parallel channel trends, marching higher with clean Higher Highs and Higher Lows.
🟩🟥 MIDCAP & SMALLCAP – Not just catching up, but breaking out of Multi-Timeframe contraction patterns with strength — a sign of broader market participation.
They're now retesting and reclaiming previous highs after a much-needed breather.
💡What this chart tells us:
-Trendlines aren't just lines—they’re psychological guides to institutional and retail behavior.
-All four indices are moving in structured, rhythmic patterns.
-Simplicity works best. The markets speak clearly when you know what to listen for.
Gabriel India Limited - Breakout Setup, Move is ON..#GABRIEL trading above Resistance of 518
Next Resistance is at 673
Support is at 415
Here are previous charts:
Chart is self explanatory. Levels of breakout, possible up-moves (where stock may find resistances) and support (close below which, setup will be invalidated) are clearly defined.
Disclaimer: This is for demonstration and educational purpose only. This is not buying or selling recommendations. I am not SEBI registered. Please consult your financial advisor before taking any trade.

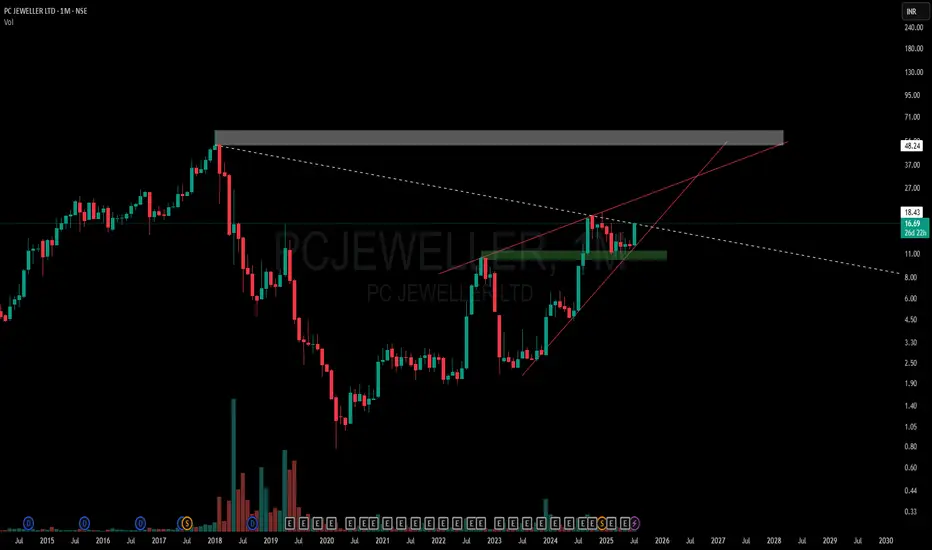
PC Jeweller at a Make-or-Break Zone: Structure Never Lies🔸 A long-standing Multi-Timeframe Compression Trendline (white dotted) remains active, and price is currently retesting this zone.
🔸 The grey supply zone marks the all-time high resistance, while the green box shows a recent zone that flipped from supply to demand — supported by a strong base formation.
🔸 A hidden structural pattern is emerging —
• One line forming a (HL - Hidden Line ) acts as rising resistance
• The other trendline offers solid ascending support
🔸 Price is getting tighter within this converging structure, while respecting historic levels.
📌 No forecast here — just highlighting key levels and behavior for context-driven traders.
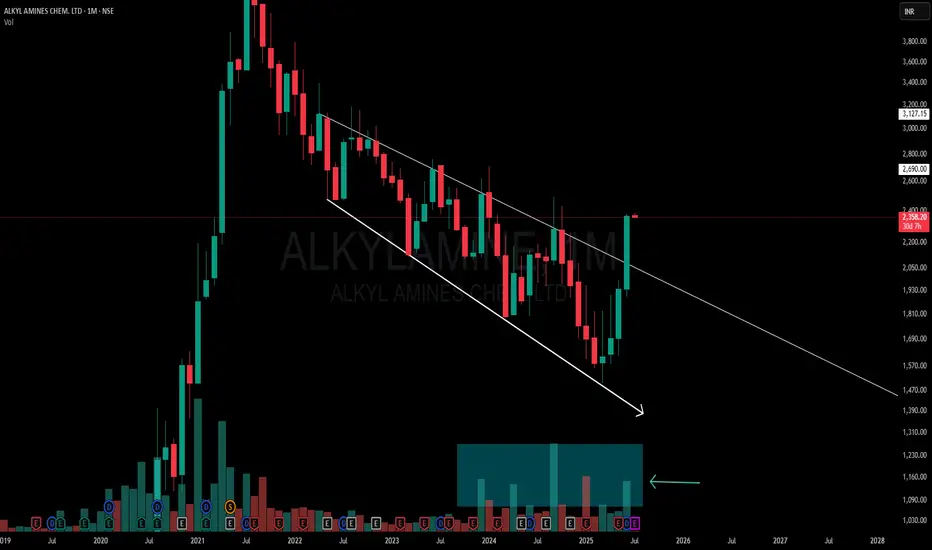
Powerful Monthly Channel | Clean Price Structure Across📉 Description:
-This is a classic example of a broadening falling channel on the Monthly Time Frame (MTF), where the counter-trendline (CT) has just been taken out by a strong bullish candle. Volume confirms the strength
📌What makes this setup particularly interesting:
-MTF structure: Despite a series of lower lows on the monthly, it has respected the broad structure of the falling channel throughout.
-WTF/DTF structure: Weekly and Daily timeframes are making higher lows (HLs),
-Price behavior: Clean reaction to the trendline and no choppiness around breakout — this reflects a well-absorbed selling zone
⚠️ This is not a forecast, not a call or tip — just me charting what I see. Drop any doubts in the comments.
“Wait for Retest” – The Hardest Thing for Impatient Traders!Hello Traders!
How many times have you seen a perfect breakout… jumped in instantly… and then watched price pull back, hit your stop-loss, and reverse back up? You’re not alone. “Waiting for the retest” is one of the most powerful but emotionally difficult habits to build in trading — especially for impatient traders. Let’s break down why it matters and how to use it with discipline.
Why Retests Matter in Breakout Trading
Confirmation of Breakout Strength: A breakout followed by a retest shows the level is truly flipping from resistance to support (or vice versa), validating the move.
Stops Get Triggered on Fakeouts: Impulsive entries during breakout candles often lead to stop-hunting or false breakouts.
Better Risk-Reward Ratio: Waiting for the retest often gives you a tighter stop-loss and bigger upside, improving your overall risk-to-reward.
Why It’s Hard for Traders to Wait
Fear of Missing Out (FOMO): Traders fear they’ll miss the entire move if they don’t jump in on the breakout candle.
Lack of Patience or Planning: Without a pre-defined rule or system, emotions take over and lead to impulsive entries.
Overtrading Mindset: Many traders feel the need to “do something” instead of letting the setup come to them.
Rahul’s Tip
Let the market prove itself before you act. If the retest doesn’t happen, it wasn’t your trade. But if it does, it’s confirmation. That’s when you strike with confidence.
How to Master Retest Trading
Set Alerts at Key Zones: Use trading platforms to alert you when price comes back to retest the breakout or breakdown level.
Use Candlestick Confirmation: Look for bullish reversal candles at retest zones (like bullish engulfing, hammer, etc.) before entering.
Combine with Volume & Structure: Confirm that volume supports the breakout and retest isn't a weak bounce.
Conclusion
“Waiting for the retest” is about discipline, not prediction. Master this skill, and you’ll enter with more clarity, better risk control, and higher probability trades. Don’t let impulse rob you of smart setups. Be patient — your best entries will wait for you.
Have you been caught by a fake breakout recently? Share your experience in the comments and let’s grow together!
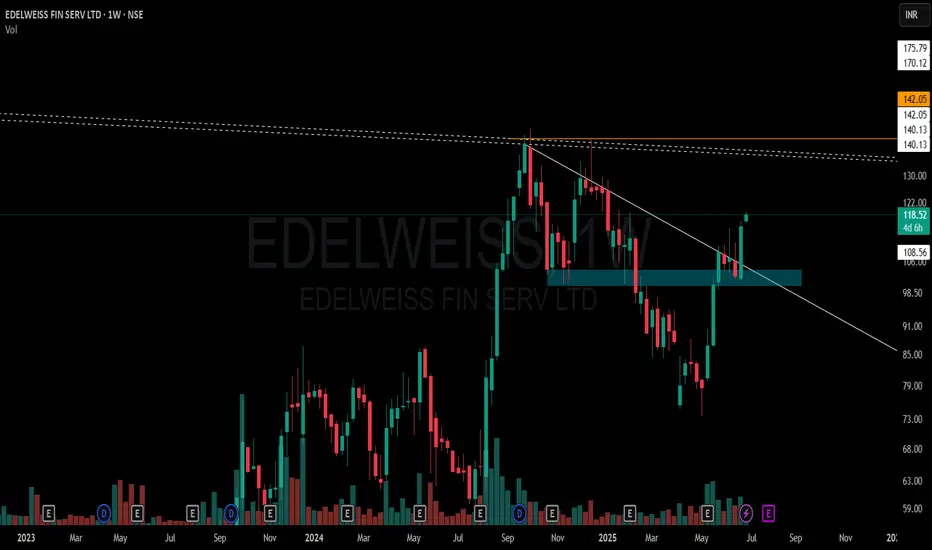
EDELWEISS FIN SERV LTD – Weekly Structure A few key observations on this weekly chart without any forecast bias:
🔹 White Solid Trendline – Marks the active CT (counter-trend) level which has now been decisively taken out.
🔹 Blue Zone – A previously tested supply and demand area has been regained and price is now sustaining above it.
🔹 White Dotted Lines – Multiple short-term weekly hindrances lie just above, acting as micro-resistances.
🔹 Orange Line – Reflects multi-timeframe level confluence and a known volume cluster region to watch ahead.
🔹 Volume has seen a healthy pickup during this breakout, suggesting participation.
📌 Not a recommendation. Just sharing chart structure and price behavior.
HINDCOPPER | Supply-Demand Flip & Structure This chart shows a clean structural shift on the weekly timeframe for Hindustan Copper Ltd (NSE: HINDCOPPER):
🔷 Blue Zone: A key Supply-to-Demand Flip area. Price reacted strongly from this zone after multiple touches, showing its relevance.
📉 CT Line (Compression Trendline): Price was getting compressed under this trendline. It's now visibly breached.
➡️ Arrow Zone: Highlights a smaller supply-demand zone, formed after consolidation and breakout. Marked for structural clarity.
Volume also shows higher activity during this move, indicating strength behind the recent price action.

AUBANK back to All Time High.AUBANK is a few points away from the price where it started.
The trading strategy is to wait for the resistance range 250-246.90 for a retest of the all-time high and upper targets of 261.50 to 268 as new highs.
Upon rejection or confirmation of rejection of this resistance level, prices will fall to 231 and 221, respectively, as T1 and T2.

How I Read Price Action Like a Pro (Most Miss This Step)The REAL Way to Read Price Action — No Indicators, Just Logic
I make educational content videos for swing trading .

Why Traders Repeat the Same Mistake – Even After Learning It?Hello Traders!
Have you ever promised yourself never to make the same trading mistake again — only to repeat it the very next week? You’re not alone. Many traders fall into the same traps over and over, even after they've studied the market and analysed their errors. Let’s break down why this happens , and how to break the cycle for good.
The Psychology Behind Repeating Mistakes
Emotions Override Logic: Even with knowledge, fear, greed, and FOMO (Fear of Missing Out) can hijack decision-making during live trades.
Lack of Process: Knowing the mistake is one thing. Having a written system or checklist to avoid it is another. Most traders skip this step.
No Real Accountability: Without a trading journal or a coach, it’s easy to forget or justify repeated bad behaviour.
Instant Gratification Bias: Humans are wired for short-term rewards. That’s why revenge trading or over-leveraging feels “right” in the moment, even when we know it’s wrong.
Rahul’s Tip
You can’t grow as a trader until you respect your own rules like a professional . Treat trading like a business — track, reflect, and correct every decision.
How to Break the Cycle
Use a Trading Journal: Write down every trade—entry, exit, emotion, and lesson. Over time, patterns become obvious and fixable.
Create a Pre-Trade Checklist: Don’t trade until your setup and risk criteria are met. This helps remove impulsive entries.
Limit Screen Time: More screen time often leads to more mistakes. Only watch the market during high-probability setups.
Have an Accountability Partner: Whether a mentor or trading buddy — feedback makes you honest and consistent.
Conclusion:
Learning is not enough. Rewiring behaviour is the real challenge. If you’re repeating mistakes, it’s not because you’re not smart — it’s because you haven’t built systems that protect you from your own emotions. Fix that, and your results will transform.
What’s the mistake you’ve repeated the most in your journey? Drop it in the comments so we can all learn and grow together!
Laurus Labs Limited - Breakout Setup, Move is ON...#LAURUSLABS trading above Resistance of 553
Next Resistance is at 699
Support is at 420
Here are previous charts:
Chart is self explanatory. Levels of breakout, possible up-moves (where stock may find resistances) and support (close below which, setup will be invalidated) are clearly defined.
Disclaimer: This is for demonstration and educational purpose only. This is not buying or selling recommendations. I am not SEBI registered. Please consult your financial advisor before taking any trade.

OPTIEMUS | Reclaiming Zones, Respecting Trendlines🟩 Price is navigating a critical structure:
White Line = Major CT (Control Trendline) — currently acting as resistance.
White Zone = MTF Supply ➡ Demand Flip Zone — price is holding above it.
Blue Zone = WTF Demand Pocket — also reclaimed recently.
📌 After reclaiming both the blue and white zones, price is now consolidating just under the CT, possibly coiling up.
🧠 Not a prediction. No tips. Just structure-based storytelling.

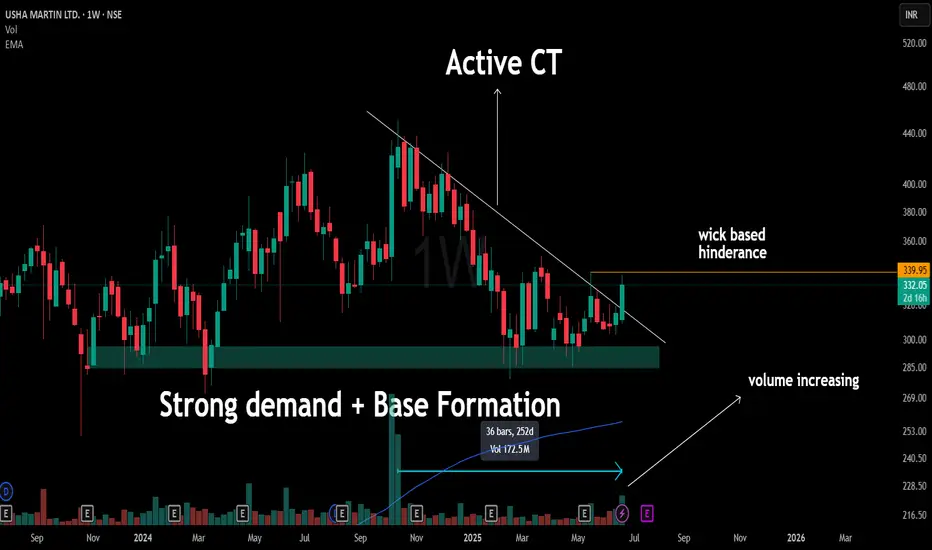
USHA MARTIN – Weekly Structure SnapshotA clean White CT that had acted as a multi-month resistance is now being engaged. Price is attempting to push above it, but the current candle is still developing — small-bodied so far, which is typical during early phases of structural tests on the weekly timeframe (WTF).
🟧 Just above lies a wick-based hindrance — a level that previously reacted with strong rejection. It's also where the current active CT had its last struggle, making it a structurally relevant zone, not something to ignore.
The base that formed in the ₹270–290 region stands out — multiple rejections without deeper breakdowns, a sign of demand stability. Volume expansion this week is notable — especially after 252 days of subdued activity — marking a shift in participation worth observing.
📌 This is not a prediction. Not a forecast. Not a trading call.
Just a structural walkthrough of what price is doing — and where attention has historically been paid.
Let the price write the story — our job is to read structure, not write headlines.