Stock Market Trading (Equities)Introduction
Stock market trading, often referred to as equity trading, is the buying and selling of shares of publicly listed companies through a regulated marketplace known as a stock exchange. Equities represent ownership in a company, and shareholders are entitled to a portion of the company's profits in the form of dividends and capital gains. Stock trading serves as a fundamental component of financial markets, providing liquidity, capital formation, and investment opportunities for individuals, institutions, and corporations alike.
The stock market is often perceived as a barometer of the economy, reflecting investor sentiment, corporate performance, and broader macroeconomic trends. Trading in equities is both an art and a science, combining analytical rigor, strategy, and psychological discipline.
Key Participants in Stock Market Trading
Retail Investors: Individual traders who buy and sell stocks for personal investment or short-term trading profits. Retail investors account for a significant portion of trading volume in major stock exchanges.
Institutional Investors: Entities such as mutual funds, hedge funds, insurance companies, and pension funds that invest large sums of money in equities. Their trades can significantly impact stock prices due to the size of their transactions.
Market Makers & Brokers: Market makers provide liquidity by quoting both buy and sell prices, facilitating smoother trading. Brokers act as intermediaries between investors and the exchange, executing orders on behalf of clients.
Regulators: Regulatory authorities like the Securities and Exchange Board of India (SEBI) in India or the U.S. Securities and Exchange Commission (SEC) ensure fair practices, transparency, and protection for investors.
Types of Equity Trading
Equity trading can broadly be categorized into long-term investing and short-term trading, each with distinct objectives and strategies.
Long-Term Investing:
Investors hold stocks for an extended period, usually years, aiming to benefit from dividends and capital appreciation. This strategy is based on fundamental analysis, which evaluates a company's financial health, growth potential, and market position. Long-term investors are less concerned with short-term price fluctuations and focus on the company's intrinsic value.
Short-Term Trading:
Traders aim to profit from price volatility within short periods, ranging from seconds (high-frequency trading) to days or weeks. This category includes:
Day Trading: Buying and selling stocks within the same trading session.
Swing Trading: Holding stocks for several days or weeks to capture intermediate-term trends.
Scalping: Executing multiple trades in a day to profit from small price movements.
Fundamental Analysis
Fundamental analysis involves evaluating a company's underlying financial health and growth potential to estimate its intrinsic value. Key aspects include:
Financial Statements:
Income Statement: Evaluates profitability through revenue, expenses, and net profit.
Balance Sheet: Assesses the company's assets, liabilities, and equity.
Cash Flow Statement: Analyzes liquidity and operational efficiency.
Ratios & Metrics:
Price-to-Earnings (P/E) Ratio: Measures stock valuation relative to earnings.
Return on Equity (ROE): Indicates profitability for shareholders.
Debt-to-Equity Ratio: Shows financial leverage and risk.
Macro & Industry Analysis:
Economic indicators like GDP growth, interest rates, and inflation impact stock performance.
Industry trends, competitive landscape, and regulatory policies influence individual company prospects.
Fundamental analysis is particularly favored by long-term investors seeking stable returns based on sound business fundamentals.
Technical Analysis
Technical analysis focuses on stock price movements and trading volume to predict future price trends. Traders use historical data and chart patterns to identify entry and exit points. Key tools include:
Charts: Line charts, candlestick charts, and bar charts provide visual representations of price movements.
Indicators:
Moving Averages: Identify trends by smoothing out price fluctuations.
Relative Strength Index (RSI): Measures overbought or oversold conditions.
MACD (Moving Average Convergence Divergence): Helps detect trend reversals.
Patterns: Head-and-shoulders, double tops/bottoms, and trendlines are common patterns used to anticipate price behavior.
Technical analysis is commonly applied by short-term traders and those seeking to exploit market psychology and price momentum.
Stock Market Orders
Traders and investors execute trades through different types of orders:
Market Order: Executes immediately at the current market price.
Limit Order: Executes only at a specified price or better.
Stop-Loss Order: Automatically sells a stock when it reaches a predetermined price to limit losses.
Stop-Limit Order: Combines stop-loss and limit orders for controlled execution.
Choosing the right type of order is crucial for managing risk and optimizing profits.
Risk Management in Equity Trading
Equity trading carries inherent risks, including market risk, company-specific risk, and liquidity risk. Effective risk management strategies include:
Diversification: Spreading investments across sectors, industries, and asset classes to reduce exposure to a single stock.
Position Sizing: Allocating a fixed portion of capital to each trade based on risk tolerance.
Stop-Loss Strategies: Limiting losses by setting predefined exit points.
Hedging: Using derivatives like options and futures to protect against adverse price movements.
Risk management is essential to survive in volatile markets and preserve capital.
Stock Market Strategies
Traders and investors employ various strategies depending on their objectives:
Value Investing: Buying undervalued stocks with strong fundamentals, aiming for long-term growth.
Growth Investing: Focusing on companies with high growth potential, even if currently overvalued.
Momentum Trading: Capitalizing on strong trends, buying rising stocks and selling before a reversal.
Dividend Investing: Targeting stocks that provide regular income through dividends.
Algorithmic Trading: Using automated systems and algorithms to execute trades at high speed and efficiency.
Behavioral Aspects of Trading
Psychology plays a crucial role in stock trading. Emotional biases such as fear, greed, overconfidence, and herd mentality can impact decision-making. Successful traders cultivate discipline, patience, and emotional control to make rational decisions.
Regulation and Compliance
Stock markets operate under strict regulations to ensure transparency and investor protection. Key regulatory practices include:
Listing Requirements: Companies must meet financial and disclosure standards to be listed on exchanges.
Insider Trading Regulations: Prevent individuals with non-public information from exploiting unfair advantages.
Market Surveillance: Exchanges monitor trading activity to detect manipulation and fraud.
Disclosure Norms: Companies must regularly disclose financial results, material events, and corporate governance practices.
In India, SEBI oversees the functioning of stock exchanges, brokers, and listed companies to maintain a fair and efficient market.
Technological Impact
Modern equity trading is heavily technology-driven. Online trading platforms, mobile apps, and algorithmic trading systems have democratized access, enabling retail investors to participate with ease. Artificial intelligence, machine learning, and data analytics are increasingly used to identify patterns, forecast trends, and automate trading strategies.
Conclusion
Stock market trading in equities is a dynamic and multifaceted activity, offering opportunities for wealth creation and capital growth. Success in trading requires a blend of analytical skills, strategic planning, risk management, and psychological discipline. Understanding fundamental and technical factors, along with macroeconomic and behavioral elements, equips traders and investors to navigate market volatility effectively.
While trading involves risks, disciplined approaches, continuous learning, and adherence to regulatory norms can significantly enhance the probability of long-term success. Whether one aims for long-term investment growth or short-term trading profits, equities remain a cornerstone of financial markets, providing avenues for participation in the wealth generated by companies and economies.
In essence, stock market trading is not merely about buying low and selling high; it is an intricate process of research, analysis, timing, and emotional control, offering immense learning opportunities and financial rewards for those who approach it with knowledge, patience, and strategy.
Stocksanalysis

Understanding Stock Market TradingBasics of Stock Trading
At its core, stock trading involves purchasing a company’s equity, known as a share, with the expectation that its value will increase over time, providing capital gains or dividend income. Shares represent ownership in a company, giving shareholders certain rights, such as voting at annual general meetings and receiving dividends. The stock market operates under the principles of supply and demand. When demand for a stock increases, its price rises; when supply exceeds demand, the price falls.
There are two main types of stock market participants: retail investors (individuals) and institutional investors (mutual funds, banks, hedge funds, etc.). Retail investors often trade in smaller volumes and rely on personal research or brokerage platforms, whereas institutional investors handle large volumes of trades and have significant market influence.
Stock Exchanges and Trading Platforms
Trading occurs on stock exchanges—centralized platforms where buyers and sellers meet. Globally, major exchanges include the New York Stock Exchange (NYSE), NASDAQ, London Stock Exchange (LSE), and India’s National Stock Exchange (NSE) and Bombay Stock Exchange (BSE). These exchanges enforce strict regulations to ensure transparency, fair pricing, and investor protection.
In addition to traditional exchanges, trading has evolved through online brokerage platforms and mobile apps, which provide real-time market data, charts, and research tools. These platforms allow investors to place different types of orders, such as market orders, limit orders, and stop-loss orders, enabling greater control over trading strategies.
Types of Stock Market Trading
Stock trading is broadly categorized based on the time horizon and strategy:
Day Trading:
Day traders buy and sell stocks within the same trading day, aiming to profit from short-term price fluctuations. They rely heavily on technical analysis, charts, and real-time data. This type of trading is high-risk and requires quick decision-making and strict risk management.
Swing Trading:
Swing traders hold stocks for a few days to weeks, attempting to capture price movements during trends. This approach balances the intensity of day trading with a longer-term perspective and often uses a combination of technical and fundamental analysis.
Position Trading:
Position traders adopt a long-term approach, holding stocks for months or years. Their focus is on the underlying fundamentals of companies, economic trends, and growth potential rather than short-term market fluctuations.
Scalping:
Scalping is a high-frequency trading strategy where traders make numerous trades within minutes or seconds to capture small price differentials. It demands high precision, speed, and low transaction costs.
Fundamental and Technical Analysis
Successful stock trading relies on analysis, which can be divided into fundamental and technical approaches:
Fundamental Analysis:
This involves evaluating a company’s financial health, management, industry position, and growth prospects. Key metrics include earnings per share (EPS), price-to-earnings (P/E) ratio, revenue growth, profit margins, and debt levels. Macroeconomic factors like interest rates, inflation, and GDP growth also influence fundamental analysis. Investors using this method aim to identify undervalued stocks that are likely to grow over time.
Technical Analysis:
Technical analysis studies historical price movements and trading volumes to forecast future trends. Traders use charts, patterns, and indicators such as moving averages, Relative Strength Index (RSI), and Bollinger Bands. This method is widely used in short-term trading strategies like day trading and swing trading.
Many traders combine both methods to maximize insights. For instance, a swing trader may use fundamental analysis to select stocks and technical analysis to determine entry and exit points.
Derivatives and Advanced Trading
Beyond buying and selling stocks, traders can use derivatives such as options, futures, and contracts for difference (CFDs) to hedge risks or speculate.
Options give the right, but not the obligation, to buy or sell a stock at a predetermined price.
Futures are contracts to buy or sell an asset at a future date at a fixed price.
CFDs allow traders to speculate on price movements without owning the underlying asset.
These instruments amplify both potential profits and risks, requiring thorough understanding and careful risk management.
Risk Management and Psychology
Trading involves risk, as prices can fluctuate due to market volatility, economic events, or unexpected company performance. Effective risk management strategies include:
Setting stop-loss orders to limit potential losses
Diversifying across sectors and asset classes
Using position sizing to prevent excessive exposure
Equally important is trading psychology. Emotional control is critical, as fear and greed can drive impulsive decisions. Successful traders cultivate discipline, patience, and the ability to stick to their trading plans even under market stress.
Regulation and Compliance
Stock markets are heavily regulated to protect investors and maintain fair trading. Regulatory bodies, such as the Securities and Exchange Commission (SEC) in the U.S. and the Securities and Exchange Board of India (SEBI), enforce rules on transparency, insider trading, market manipulation, and reporting. Compliance ensures investor confidence and smooth functioning of markets.
Trends and Technology in Trading
Modern stock trading has been transformed by technology. Algorithmic trading and high-frequency trading leverage computers to execute trades at extremely high speeds based on predefined rules. Artificial intelligence and machine learning are increasingly used to analyze market data, detect patterns, and optimize trading strategies. Moreover, mobile trading apps and robo-advisors have democratized access, allowing even small investors to participate actively in markets.
Sustainability and ESG (Environmental, Social, and Governance) investing are also emerging trends, where traders consider non-financial factors while making investment decisions.
Conclusion
Stock market trading is both an art and a science. It provides opportunities for wealth creation, liquidity, and portfolio diversification, but it is not without risks. Success depends on a combination of knowledge, strategy, discipline, and emotional resilience. Whether you are a long-term investor focusing on fundamentals or a short-term trader analyzing technical charts, understanding market dynamics, regulatory frameworks, and risk management principles is essential.
The stock market reflects the broader economy and human behavior, making it a fascinating yet challenging domain. With the right approach, education, and patience, trading can be a rewarding avenue for financial growth and personal development.

Buy APL Apollo TubesShort Term Trading Advice by Goodluck Capital
Buy APL Apollo Tubes
● Buy Range- 1940 - 1960
● Target- 2060 - 2080
● StopLoss- below 1890
● Upside Potential- 6% -7%
● Approx trade duration 12 - 14 days

Buy Multi Commodity Exchange of IndiaShort Term Trading Advice by Goodluck Capital
Buy Multi Commodity Exchange of India
● Buy Range- 10475 - 10575
● Target- 11000 - 11200
● StopLoss- below 10180
● Upside Potential- 5% -6%
● Approx trade duration 12 - 14 days

HINDUNILVR: Smart Money Accumulation Zone After CHoCH?📘 HINDUNILVR (HUL) — Technical Analysis | Structure Shift & Golden Retracement Setup
(Timeframe: Daily)
HINDUNILVR is currently trading around ₹2,265 after a prolonged corrective phase.
The chart reflects a Change of Character (CHoCH) followed by a controlled retracement into a high-probability demand zone, where the next directional move is likely to emerge.
🔍 Market Structure & Price Action
The stock previously witnessed a strong bullish extension, reaching the 113%–128% Fibonacci extension zone, indicating an overextended move.
Post extension, price showed loss of bullish momentum, leading to a CHoCH — a clear signal of shifting market control.
CHoCH highlights early trend transition and often leads to range-bound or corrective price action, rather than an immediate trend reversal.
📌 CHoCH helps traders prepare for structural transitions before confirmation from higher highs.
📐 Fibonacci & Wave Context
The decline from point A to B appears corrective, not impulsive.
Price has now entered the Golden Retracement Zone (50%–78%) of Wave A.
This zone is typically where Wave B or Wave 2 attempts to develop.
Institutional participants often accumulate positions here due to favorable risk–reward.
📌 Failure to hold this zone often results in a deeper correction or trend reversal.
🎯 Key Levels from the Chart
Major Demand Zone: ₹2,230 – ₹2,200
Invalidation Level: Day close below ₹2,200
First Target: ~₹2,630 (≈ 78% retracement of Wave AB)
Second Target: ₹2,826 – ₹2,888
🧭 Trading Strategy (Swing / Positional)
Look for long opportunities only inside the ₹2,230–₹2,200 zone.
Prefer confirmation signals such as:
– Bullish rejection wicks
– Higher-low formation
– Minor CHoCH on lower timeframes
Avoid aggressive entries without confirmation.
🛑 Risk Management
Strict stop loss: Day close below ₹2,200
A close below this level indicates weak demand and opens the risk of extended downside correction.
Partial profit booking recommended near Target 1.
Trail stop aggressively if price sustains above ₹2,630.
📚 Educational Notes
Golden Retracement (50%–78%) is where institutions seek value-based entries.
CHoCH ≠ Trend Reversal — it signals momentum loss, not instant bearishness.
Confirmation always comes from structure + demand holding, not prediction.
🔮 Probable Scenarios
Bullish Case:
Holding above ₹2,200 → Base formation → Gradual recovery toward ₹2,630 → ₹2,826–2,888.
Bearish Case:
Day close below ₹2,200 → Demand failure → Deeper corrective phase.
📌 Conclusion
HINDUNILVR is positioned at a critical inflection zone.
Risk is clearly defined, while upside potential remains asymmetric.
This is a wait-for-confirmation accumulation setup, not a chase trade.
⚠ DISCLAIMER
I am not a SEBI-registered analyst.
This analysis is for educational purposes only and should not be considered investment advice.
Always use your own analysis and risk management.

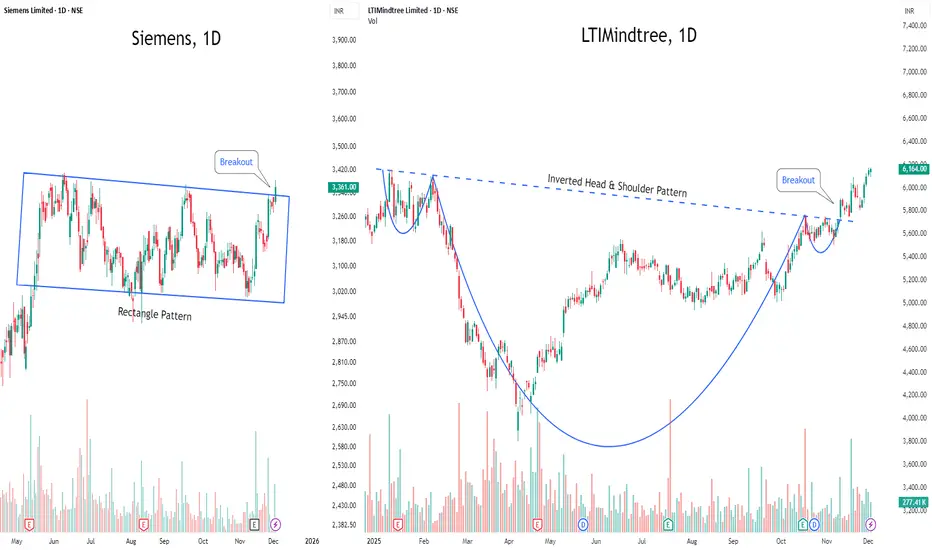
Breakout Radar: Two Stocks Turning Up the Heat This Week1️⃣ SIEMENS NSE:SIEMENS — Quiet No More
After chilling inside a rectangle range, SIEMENS just stepped out with a clean breakout.
The consolidation phase is done — now the chart is hinting at fresh upside energy. Momentum is officially back on the table. ⚡📈
2️⃣ LTIMINDTREE NSE:LTIM — Reversal Royalty
This one spent weeks building a textbook Inverted Head & Shoulder — and now it’s broken the neckline with style.
The breakout looks solid, and the stock is gearing up for a potential upside rally. 🚀💫
🔥 Two strong chart setups.
🔥 Two momentum-packed breakouts.
Perfect picks for traders eyeing action this week.
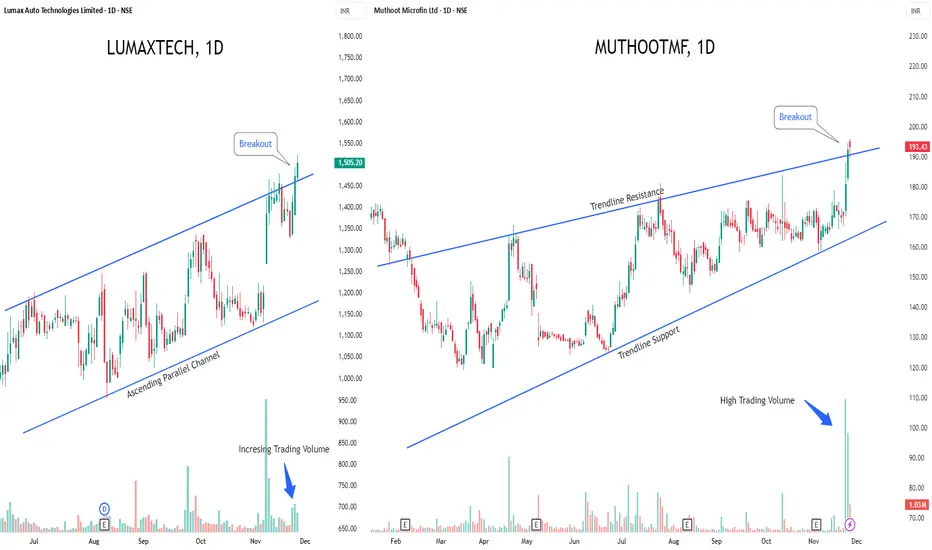
LUMAXTECH & MUTHOOTMF - Breakout Stocks to Watch This Week!1️⃣ Lumax Auto Technologies NSE:LUMAXTECH — Fresh Breakout Alert
Lumax is riding a strong uptrend and has cleanly broken above the upper boundary of its ascending parallel channel.
If this breakout sustains, the stock could see a sharp upside rally ahead.
Rising volumes are confirming strong buyer interest, giving this move an extra edge.
2️⃣ Muthoot Microfin NSE:MUTHOOTMF — Failed Rising Wedge, Strong Reversal Setup
A failed rising wedge pattern is playing out as the price has broken above the trendline resistance, flipping the structure into a bullish signal.
Even better — heavy volume buildup is reinforcing the strength of this emerging reversal.
⚡Both counters show early signs of momentum — watch for follow-through!
How to Read Candlestick Patterns like a PRO - Price action I make educational content videos for swing / positional trading - breaking down price action movements into simpler steps to make you guys understand the concepts .
Charts used are 3 months or older .

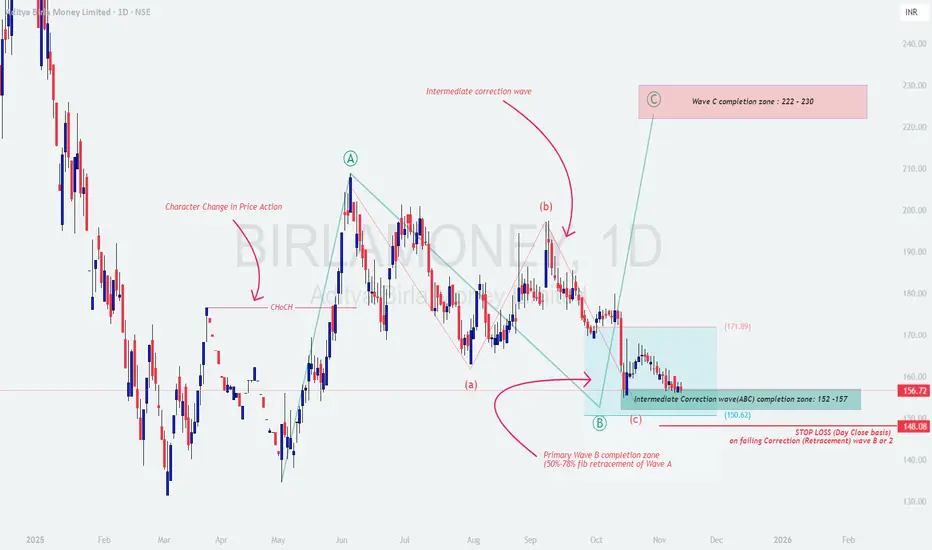
BIRLAMONEY – Wave C Rally Loading?🧠 Chart Context & Wave Structure
The chart displays a classic Elliott Wave corrective setup after a strong impulsive rally (Wave A).
Following the impulsive move, price entered a multi-stage correction, forming a clear (a-b-c) structure within Wave B.
Key Observations:
📈 Character Change in Price Action (ChoCH) signaled the initial shift from bearish to bullish structure.
Wave A marked a strong impulsive leg confirming bullish sentiment.
The ongoing Wave B correction is now nearing completion within the 50%-78% Fibonacci retracement zone of Wave A.
The Intermediate correction (ABC) seems to be completing between ₹152 – ₹157, aligning with strong confluence support.
📚 Educational Insights
1️⃣ Character Change in Price Action (ChoCH):
Marks the structural shift from lower highs/lows to higher highs/lows — the first clue of trend reversal.
2️⃣ Fibonacci Retracement Principle:
Most corrective waves retrace 50%–78.6% of the prior impulsive leg.
This “Golden Pocket” zone often acts as a high-probability reversal area where smart money accumulates.
3️⃣ Wave Structure Psychology:
Wave A: Impulsive rally driven by renewed optimism.
Wave B: Corrective pullback – often mistaken as a bearish reversal.
Wave C: Next impulsive leg resuming the primary uptrend; often equals or exceeds Wave A in magnitude.
🎯 Price Projection & Prediction
Wave B completion zone: ₹152 – ₹157 ✅
Wave C potential target zone: ₹222 – ₹230 🎯
Invalidation / Stop-Loss zone: Below ₹148 (Closing basis) 🚫
If price sustains above ₹157 and breaks ₹171.89, it strengthens the bullish probability for Wave C extension.
💡 Trading Strategy (Educational Purpose Only)
1️⃣ Entry Plan:
Watch for bullish reversal patterns (Hammer, Bullish Engulfing, or Double Bottom) near ₹152–₹157.
Aggressive Entry: Partial accumulation in this zone.
Conservative Entry: Wait for breakout confirmation above ₹165–₹171.89 zone.
2️⃣ Targets:
🎯 Target 1: ₹190 (Intermediate resistance)
🎯 Target 2: ₹222 – ₹230 (Wave C completion zone)
3️⃣ Stop-Loss:
Keep Closing basis SL below ₹148, as a break below it invalidates the current corrective completion structure.
⚖️ Risk Management Tips
Risk only 1–2% of your total trading capital per trade.
Avoid aggressive averaging during corrections.
For options traders — enter directional positions only after structure confirmation.
Combine structure + volume confirmation for high-probability setups.
Remember: Elliott Waves show probability, not certainty.
🧩 Summary & Conclusion
Aditya Birla Money appears to be completing its intermediate corrective Wave (ABC) within the ₹152–₹157 zone — a strong support confluence area.
If the structure holds, a potential impulsive Wave C rally could unfold toward ₹222–₹230 in the coming weeks.
Patience and confirmation will be key before entering this potential move.
⚠️ Disclaimer
I am not a SEBI-registered analyst.
This analysis is purely for educational and informational purposes only and should not be taken as investment advice.
Please consult your financial advisor before making any trading decisions.
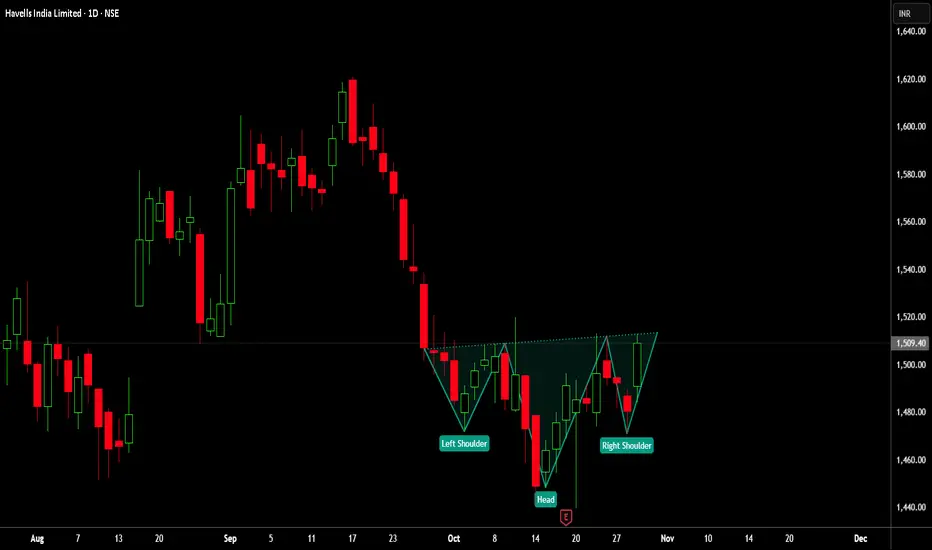
HAVELLS 🧩 Havells India – Inverse Head & Shoulders Breakout Formation (Bullish Reversal Setup)
🧠 Description:
The Havells India Ltd (Daily) chart is displaying a potential Inverse Head & Shoulders pattern — a classic bullish reversal formation often seen near market bottoms.
🏗️ Pattern Structure:
The Left Shoulder formed in early October 2025.
The Head was completed near mid-October with a strong rejection candle around ₹1,440.
The Right Shoulder is now shaping up with consistent higher lows, showing accumulation signs.
The Neckline Resistance lies near ₹1,515–₹1,520.
A breakout and daily close above the neckline could trigger further upside momentum.
📊 Technical Highlights:
RSI: Recovered from oversold zone and sustaining above 50 — confirming bullish momentum.
Volume: Gradual rise in volume indicates possible institutional participation.
Trend Structure: Formation of higher highs and higher lows post-head formation.
🔑 Key Levels:
📍 Neckline Zone: ₹1,515–₹1,520
📍 Breakout Confirmation: Daily close above ₹1,520
📍 Immediate Target: ₹1,560
📍 Extended Target: ₹1,600–₹1,625
📍 Stop Loss: Below ₹1,470 (Right Shoulder low)
🧭 Trading Plan:
✅ Entry: On sustained move or daily close above ₹1,520
🔒 Stop Loss: Below ₹1,470
🎯 Targets: ₹1,560 → ₹1,625
📈 View:
Bullish (Swing/Positional) — If the neckline breakout sustains, Havells India could see momentum continuation toward higher resistance levels.
📰 Watchlist Note:
Keep this setup under your watchlist for breakout confirmation.
Always Do Your Own Research (DOYR) before acting.
❌ No Buy/Sell Recommendation.
🙏 Thank You for Reading!
👍 BOOST if you found this useful.
📌 FOLLOW for more market setups.
💬 COMMENT below with your analysis or feedback.
⚠️ Disclaimer:
I am not a SEBI REGISTERED RESEARCH ANALYST AND INVESTMENT ADVISER.
This analysis is intended solely for informational purposes and should not be interpreted as financial advice.
Please consult a qualified financial advisor or conduct thorough research before making investment decisions.
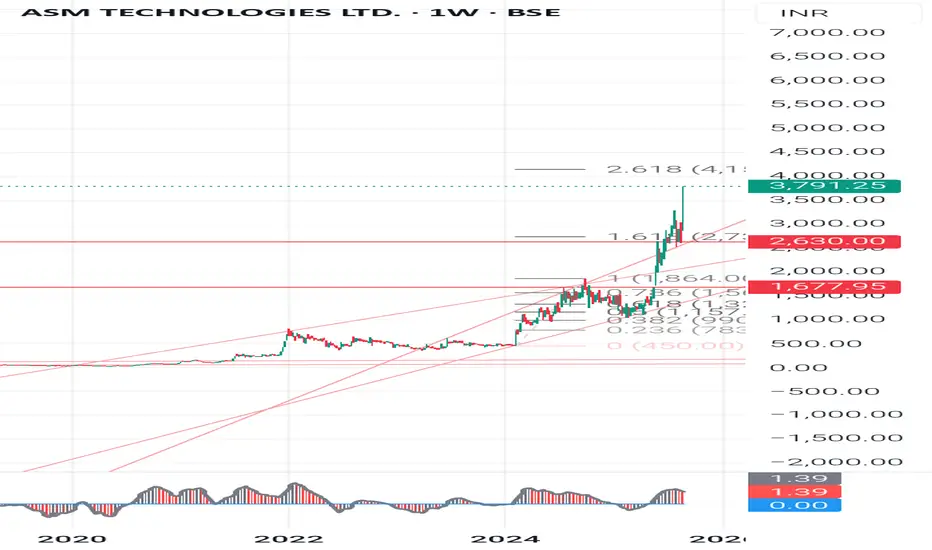
Stock Analysis: Asm technologies ASM Technologies Ltd.- technical chart and fundamentals for student learnings.
Technical & Chart Pattern Analysis (Weekly Chart)
Current Price (CMP): 1,520
Recent Move: Sharp rally from -500 in mid-2024 to a peak of -3,800 (multi-bagger move within months).
Chart Pattern Observations
1. Parabolic Rally: Price rose almost vertically - unsustainable in the short term - healthy correction likely.
2. Strong Resistance Zones:
-1,675 (immediate resistance & supply zone)
-2,630 (major resistance, recent support turned resistance)
-3,800 (swing top, all-time high)
3. Strong Support Zones:
-1,450-1,500 (immediate support, CMP zone)
- 1,250 (next support)
- 950 (major strong support, base of previous rally)
4. Candlestick Observations:
The last few weekly candles show long wicks at the top - profit booking and selling pressure.
Current trend shows bearish engulfing signals near top - short-term correction expected.
🎯Perfect Entry Points for Swing / Positional
Safe Accumulation Zone: 1,250-1,450 (near support, risk-reward favorable).
Aggressive Buy Zone: 1,650-1,700 (if stock reclaims and sustains above with volume).
Breakout Zone for Big Upside: 2,650+ weekly close - can attempt 3,200-3,800 again.
Swing Analysis:
Stock is in post-parabolic correction - Expect sideways consolidation between 1,250-2,000 for some weeks/months.
Good for gradual SIP-style accumulation instead of lump sum buy.
Fundamental Snapshot (ASM vs Competition)
Metric (FY24-25) ASM Technologies Tata Elxsi KPIT Tech L&T Tech
Market Cap -800 Cr -55,000 Cr -30,000 Cr -55,000 Cr
PE Ratio -60+ (very high) -75 -65 -55
Debt/Equity Low (Good) Low Low Low
Revenue Growth (3Y CAGR) High (-30-35%) -18% -20% -15%
Profit Margins 8-10% 20%+ 15-18% 15-20%
Dividend Yield Nil 0.8% 0.5% 0.7%
👉 Observation:
ASM is a small-cap, high-growth, high-risk IT engineering services company.
Valuation is stretched (like peers) but earnings base is tiny compared to Tata Elxsi or KPIT.
High volatility due to low liquidity in stock.
Key Learnings for Students
1. Parabolic moves always correct - don’t chase at top, wait for pullbacks.
2. Support & Resistance levels guide entry/exit - better risk-reward at support zones.
3. Volume + Candlestick confirmation is important before entering.
4. Fundamentals matter in long run - Always check PE ratio, debt levels, margins, and growth.
5. Small-cap IT can give multibaggers but carry high volatility - only invest money you can hold for 3-5 years.
👉Disclaimer:
This analysis is for educational purposes only. Not a SEBI-registered advisory. Please consult your financial advisor before making any investment/trading decision.
#ASMTechnologies #StockAnalysis #SwingTrading #ChartPatterns #SupportResistance #CandleStickAnalysis #TechnicalAnalysis #FundamentalAnalysis #InvestingForBeginners #StockMarketEducation #MultibaggerStocks #LongTermInvesting
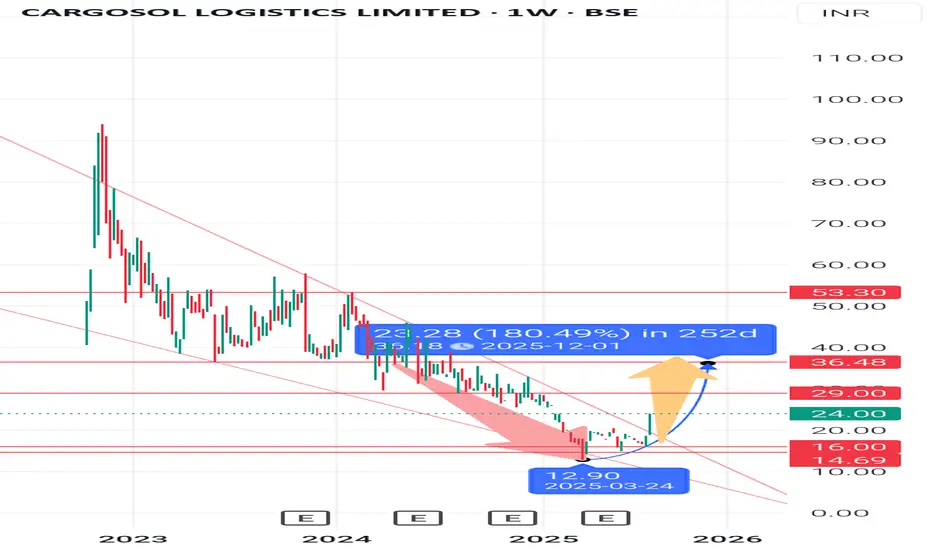
Cargosol Logistics Ltd: Technical+ fundamental breakdownTechnical + fundamental breakdown for Cargosol Logistics Ltd., along with student learning points
- Technical & Chart Pattern Analysis
Timeframe Used: Weekly Chart
Trend: Stock has been in a prolonged downtrend from its highs (120+), but formed a base near 12.90 (March 2025) and gave a strong reversal candle.
Candlestick Pattern: Recent bullish engulfing + long lower wick near support shows accumulation and reversal signs.
Channel Breakout: Price has broken out of the falling channel, signaling possible trend reversal.
Support Levels
-20.0 (immediate, psychological round number support)
-16.0 (strong weekly support, retested multiple times)
-12.9 (major bottom, long-term support)
Resistance Levels
29.0 (near-term resistance, supply zone)
36.5 (medium-term target, previous swing high)
53.3 (major resistance, strong profit-booking zone)
Perfect Entry Points
-Accumulation Zone: 16-20 range (ideal for swing traders & positional investors).
-Breakout Entry: If price sustains above 29 with volume, next swing target can be 36-53.
Swing Analysis
-Current upswing from 12.9 - 24 is +85% already.
-Possible retracement to 20 before next leg up.
-If 29 breaks, swing rally towards 36-53 is likely.
Fundamental Comparison (Logistics Sector Peers)
(Values are approximate; students should cross-verify with latest financials)
Company P/E Ratio Debt/Equity ROE (%) Profit Margin Market Cap
Cargosol Logistics 18-20 Low (<0.5) 12-15% 5-6% Small Cap
TCI Express 40+ 0 (Debt-free) 25% 8-10% Mid Cap
Blue Dart Express 60+ 0.7 20% 7-8% Large Cap
Gati Ltd. Negative P/E High Debt -ve ROE Weak Mid Cap
Learning:
-Compared to peers, Cargosol is undervalued (low P/E, decent growth).
-Debt levels are manageable (safer than Gati).
-Still riskier than established players (TCI Express, Blue Dart).
Key Learnings for Students
1. Trendlines & Channels Matter: Downtrend breakout often signals big moves.
2. Candlestick Confirmation: Look for engulfing, hammer, or long-wick candles near support.
3. Volume = Strength: Always confirm breakouts with strong volumes.
4. Fundamentals First:
Check P/E, Debt/Equity, ROE, Margins before investing.
Compare with industry peers.
5. Risk Management: Small caps are volatile, so position sizing is critical.
👉Disclaimer:
This analysis is for educational purposes only. Stock market investments are subject to risks. Do your own research or consult a financial advisor before investing.
#CargosolLogistics #StockMarketIndia #SwingTrading #TechnicalAnalysis #FundamentalAnalysis #LogisticsSector #StudentInvestors #StockEducation #SupportAndResistance #InvestingBasics
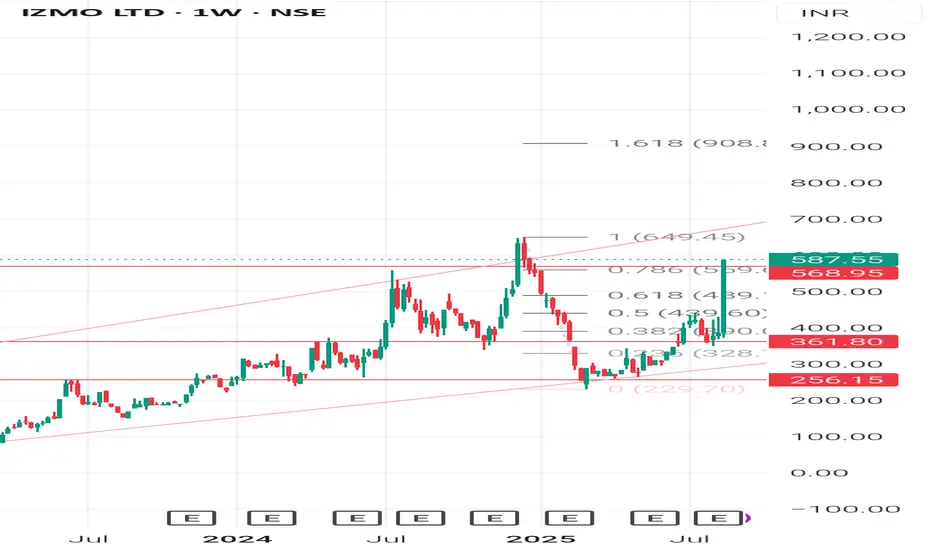
Stock Analysis: IZMO Ltd. based on the chart and fundamentalsStock Analysis: IZMO Ltd. based on the chart and fundamentals:
Technical & Chart Pattern Analysis (Weekly Chart)
Current Price: 587.55 (+19.99% last move - strong momentum).
Fibonacci Levels (retracement from high):
0.382 - 390 (past support, now strong base).
0.5 - 439 (intermediate support).
0.618 - 499 (recent breakout level).
0.786 - 559 (crossed successfully).
1.0 - 649 (major resistance).
1.618 - 908 (next extended target).
Support Levels: 499 - 439 - 390.
Resistance Levels: 649 - 750 - 908.
Candlestick Pattern: Recent weekly candle is a strong bullish marubozu (no wick, full green), indicating aggressive buying and potential continuation of trend.
Swing Analysis: Stock bounced strongly from 256 (swing low) and has reclaimed key retracement levels, showing a trend reversal with momentum.
Chart Pattern:
Broke out of falling consolidation with volume.
Trading inside a long-term upward channel.
Target zones: 649 (supply zone) - If broken, 900 becomes visible.
Fundamental Snapshot - IZMO vs Competitors
Ratio / Metric IZMO Ltd. KPIT Tech Tata Elxsi
P/E (TTM) -23x -45x -65x
ROE -17% -20% -28%
Debt-to-Equity Low (<0.2) Low Low
Revenue Growth (YoY) Strong double-digit Moderate Stable
Market Cap -Small-cap Mid-cap Mid-cap/Large-cap
Learning: IZMO trades at a lower P/E compared to KPIT/Tata Elxsi, indicating undervaluation relative to peers if growth sustains. However, liquidity and volatility risk is higher since IZMO is a small-cap.
🎓 Student Learnings from This Chart
1. Fibonacci Retracement works well in identifying support/resistance during upswings.
2. Volume + bullish marubozu candles = trend confirmation.
3. Small-cap IT/auto-tech companies can give sharp rallies but also sharp corrections - risk management is critical.
4. Always compare fundamentals with peers - Lower P/E can mean undervaluation OR slower growth.
5. Invest gradually (SIP style) instead of chasing a rally after 20%+ up moves.
👉Disclaimer
This analysis is for educational purposes only. It is not investment advice. Stock markets are subject to risks. Please consult your financial advisor before investing.
#StockMarketIndia #TechnicalAnalysis #FundamentalAnalysis #SwingTrading #ChartPatterns #CandlestickPatterns #StudentInvestors #LongTermWealth #SmallCapStocks #InvestingBasics
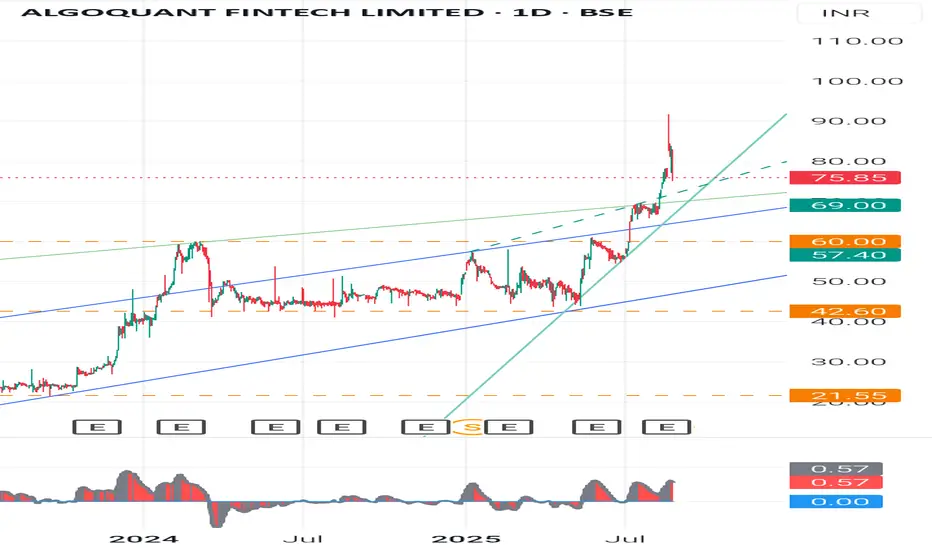
Stock Analysis - chart pattern analysis & fundamepinchStock Analysis - step by step for Algoquant Fintech Ltd.
Chart & Price Action Analysis (Weekly Chart)-:
-Current Price: 78.95 (-3.84%)
+Recent Move: Stock gave a strong breakout above its long consolidation channel ( 42- 69).
-Candlestick: The latest candle is a long wick candle after a strong breakout - This signals profit booking after a sharp rally.
- Support Levels
69 - Recent breakout retest zone
60 - Strong support from previous swing highs
42.6 - Major base support (long-term)
- Resistance Levels
85- 88 - Immediate resistance (due to long upper wick supply)
100+ - Psychological round level
120 - Next major target if momentum sustains
🕯️ Candlestick & Swing Analysis
Pattern: Breakout candle with long wick - suggests short-term profit booking, but trend remains positive.
Swing Trend: Stock formed higher highs & higher lows since mid-2023, a sign of strong uptrend.
Risk: If it falls below 69 on weekly closing, trend may weaken.
- Fundamental Comparison (with Fintech peers like Infibeam Avenues, IndiaMart, and small fintech players)
Metric Algoquant Fintech Infibeam Avenues IndiaMart Intermesh
P/E Ratio Very High (Loss-making / low EPS stage) -38x -45x
Revenue Growth Very high (small base effect) Moderate Stable
Debt Low Low Very Low
Business Stage Emerging (High growth, high risk) Mid-sized, stable Established, B2B stronghold
👉 Learning: Algoquant is in an early stage compared to peers - higher growth potential but also higher risk.
📘 Basic Learnings for Students (Investment Education)
1. Candlestick Learning - Long upper wicks after breakout = profit booking - watch for retest of breakout levels.
2. Swing Analysis - Trend is up as long as higher highs-higher lows structure is maintained.
3. Chart Pattern - Breakout from long channel = momentum can continue if volumes sustain.
4. Fundamental Insight - Always compare with industry peers on P/E, revenue growth, debt, margins.
5. Risk Management - In emerging companies, volatility is high. Always keep a stop-loss.
⚠️ Disclaimer
This analysis is for educational purposes only. It is not investment advice. Stock markets are subject to risks. Please do your own research (DYOR) or consult a SEBI-registered advisor before investing.
#Algoquant #FintechStocks #StockMarketIndia #TechnicalAnalysis #CandlestickPatterns #SwingTrading #InvestingForBeginners #FundamentalAnalysis #StockMarketEducation #DYOR
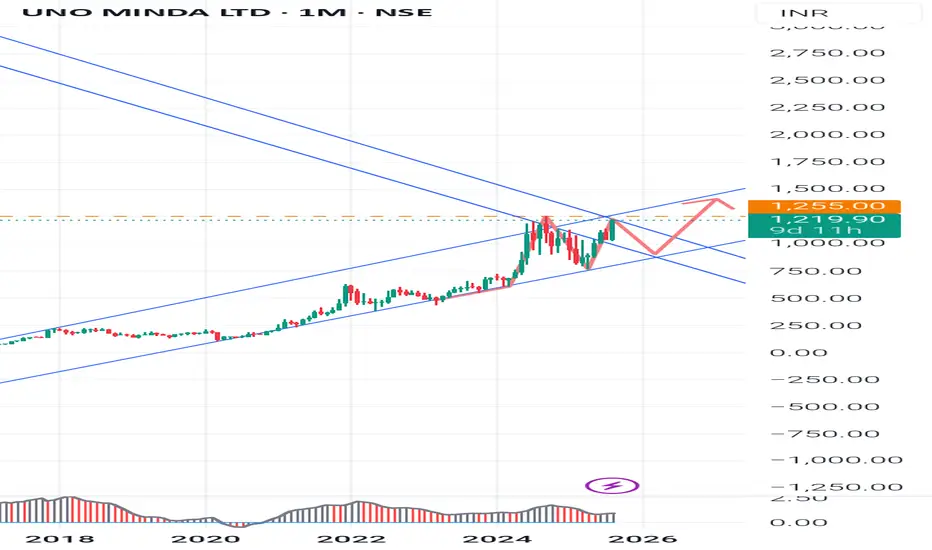
UNO Minda Ltd Stock - Chart Analysis (August 2025)UNO Minda Ltd Stock - Chart Analysis (August 2025)
1. Chart Pattern Insights
Trend: The long-term chart shows a consistent uptrend since 2017, with price largely respecting an upward-sloping channel. Recent price movement is testing the upper boundary.
Pattern: The marked wedge/triangle pattern indicates possible volatility and upcoming breakout.
If price sustains above 1,255, the next bullish target is around 1,400.
Support-:
A breakdown below the lower wedge/channel suggests a test of 1,000 support.
Support Levels: 1,000–1,020 ; next strong support at 768 (previous major low).
Resistance Levels: 1,255 (recent high and pivot); 1,400 (target in bullish scenario), then 1,600 (next significant resistance).
Pivot Points: Weekly pivots confirm 1,255 as a resistance and 1,085-1,140 zone as a key support area.
Volume: Increasing volume on upmoves supports bullish momentum.
2. Stochastic RSI (8, 13, 21) Insights
Strength: Use these settings to assess overbought/oversold zones. A reading above 80 suggests overbought (possible reversal or consolidation), below 20 is oversold (potential buying opportunity).
Momentum: If Stochastic RSI crosses above 50 and price breaks recent resistance, it confirms bullish momentum. Divergence between price and Stochastic RSI often precedes reversals.
3. Fundamental Ratios (2025)
Metric
UNO Minda
Motherson Sumi
Suprajit Engg.
Industry Avg.
P/E (TTM)
75.75
50
40
35
P/B
12.37
8
6
5
ROE
17.5%
12%
11%
13%
ROCE
18.8%
14%
13%
14%
Dividend Yield
0.18%
>0.30%
0.40%
0.35%
OPM
12%
10%
13%
11%
Debt/Equity
0.5
0.7
0.3
0.6
UNO Minda boasts higher profitability (ROCE, ROE, OPM) but is more expensive (higher P/E/PB), reflecting market optimism for its growth.
4. Key Learnings for Students
Charts Teach Structure: Price channels, wedges, and pivot points help spot trend directions. Always align investment with trend- buy in uptrend, sell or avoid in downtrend.
Support & Resistance are Crucial: Identify historical price levels where stock reversed before. These are good zones for setting stop-loss or target levels.
Momentum Matters: Use Stochastic RSI and volume to confirm price movement strength. Entries on strong momentum and exits on exhaustion zones (overbought/oversold).
Valuation Matters: High P/E/PB signals high growth expectation but potentially overpriced risk.
Profitability Ratios (ROE, ROCE): Go for companies with sustained high profitability and reasonable leverage (Debt/Equity).
Diversification: Compare companies within an industry- never invest based solely on price chart, always check business health and fundamentals.
5. Disclaimer
Stock market investing involves risk. The above analysis is for educational purposes only. Past performance does not guarantee future returns. Always do your own research and consult a financial advisor before making investment decisions.
#StockAnalysis #Fundamentals #TechnicalAnalysis #UNO #AutomobileStocks #StudentInvesting
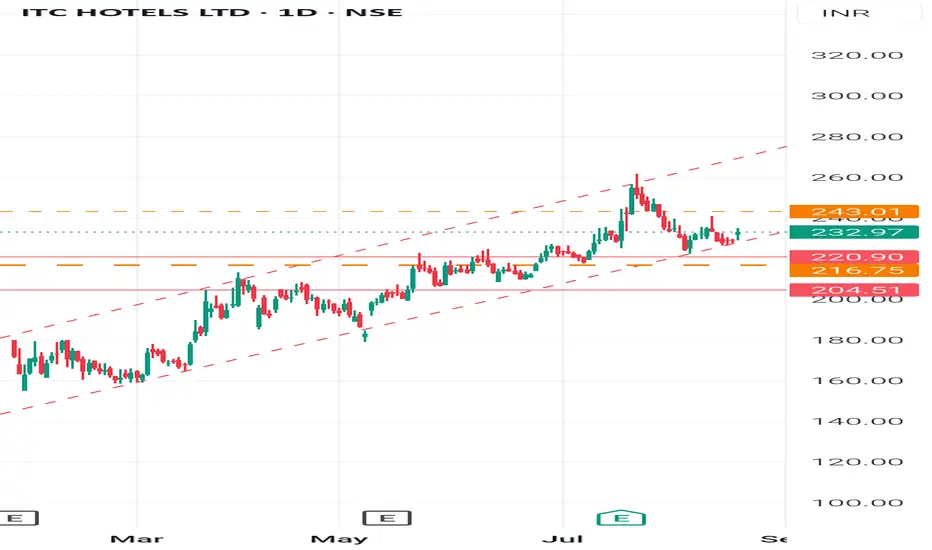
ITC Hotels Ltd - Chart pattern analysisThe full chart pattern analysis for ITC Hotels Ltd. chart you shared 👇
Technical Analysis (Daily Chart)
Current Price: - 233 (+1.82%)
Trend: Stock has been in an upward channel (red dashed lines). After touching - 260+zone, it corrected and is now consolidating.
Support Levels:
- 220.90 (strong support, recent bounce zone)
- 216.75 (channel support)
- 204.50 (major support, breakdown point)
Resistance Levels:
- 243.00 (immediate hurdle, previous swing high)
- 260.00 (upper channel resistance)
- 280+ (if breakout sustains, long-term target)
Pattern: Stock is moving in a rising channel and now forming a sideways consolidation. A close above - 243 can resume uptrend; below - 216 may lead to deeper correction.
Fundamentals Snapshot (Competition vs. ITC Hotels)
(Hotel industry peers: Indian Hotels (Taj), EIH (Oberoi), Lemon Tree, Chalet Hotels)
Company P/E Ratio P/B Ratio Debt/Equity ROE Net Profit Margin
ITC Hotels Ltd - 28x - 3.5x Low - 12% - 8%
Indian Hotels (Taj) - 45x - 6x Low - 14% - 10%
EIH (Oberoi) - 55x - 4.2x Low - 10% - 7%
Lemon Tree Hotels Loss-making recently - High Negative Negative
Chalet Hotels - 75x - 6x Moderate - 9% - 5%
Key Observations:
-ITC Hotels trades at a cheaper valuation (P/E 28x) compared to peers like Taj (45x) and Chalet (75x).
-The balance sheet is debt-light, which is a positive.
+Margins are stable but slightly lower than Taj.
-Strong backing of parent ITC Ltd. makes it relatively safer than standalone hotel chains.
👉Disclaimer-:
This is an educational analysis based on publicly available data and technical charting. It is not financial advice. Please consult your financial advisor before making any investment decisions. Stock markets are subject to risks.
#ITCHotels #StockMarketIndia #TechnicalAnalysis #HotelIndustry #LongTermInvesting #NSEStocks #BSEStocks #SupportAndResistance #SmartInvesting #StockMarketEducation
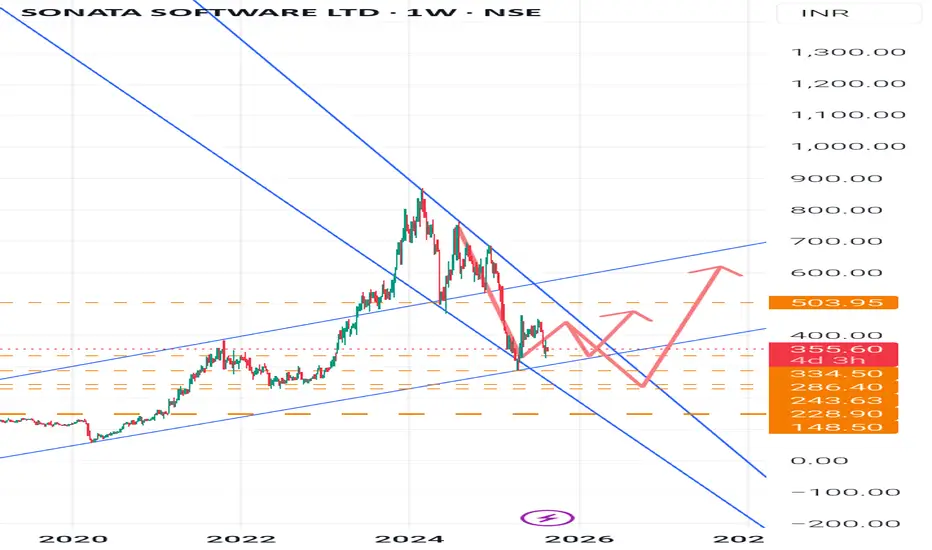
Sonata Software Ltd- Trend and chart pattern analysisSonata Software Ltd-
technical + fundamental analysis based on chart and industry outlook 👇
Technical Chart Analysis (Weekly Chart)
Current Price: 356.40
Trend: The stock had a steep rally till 1,200 and then corrected sharply into a downtrend channel. Now it is stabilizing and attempting a base formation.
- Support Levels
334 - immediate support
286 - strong support zone
243 - medium-term support
228 - long-term crucial base
148 - major bottom support
- Resistance Levels
400 - near-term hurdle
503 - key weekly resistance (breakout confirmation if crossed)
600 - medium-term target if trend sustains
700+ - only after strong momentum breakout
- Chart Pattern
Stock is currently consolidating between 330-400.
Possible formation of a W-bottom / double bottom, if 330-334 holds.
A sustained move above 503 could trigger a trend reversal rally toward 600-700.
If it breaks below 286, weakness may extend to 243/228 zone.
🏢 Business & Competition
Sonata Software operates in IT services, cloud, and digital transformation. It earns revenues from export-oriented IT services, particularly in Microsoft ecosystem solutions.
- Key Competitors
Mid-cap IT peers: Mphasis, L&T Technology, Persistent Systems, Coforge, Birlasoft, Mindtree (merged into LTIMindtree).
Sonata is relatively smaller in scale compared to peers but has a niche in Microsoft Dynamics 365 solutions.
📈 Fundamental Ratios (Latest available FY24 data)
Market Cap: 9,500 Cr
P/E Ratio: 27 (mid-cap IT avg. 30-35) - slightly undervalued compared to peers
ROE (Return on Equity): 25% - very strong
ROCE (Return on Capital Employed): 30% - efficient capital use
Debt-to-Equity: 0.05 - virtually debt-free
Dividend Yield: 1.5% - decent payout for investors
Revenue Growth (3Y CAGR): 15-18%
EPS Growth (3Y CAGR): 20%
👍 Investment View
Technicals: Base building in progress. Sustaining above the 400-503 zone is crucial for the next uptrend.
Fundamentals: Strong ROE/ROCE, debt-free, consistent dividend payer. Attractive in mid-cap IT basket.
Risks: Global IT slowdown, client concentration risk, strong USD-INR dependency.
👉Disclaimer
This analysis is for educational & informational purposes only.
It is not financial advice or a buy/sell recommendation.
Stock markets are subject to risks - please consult your financial advisor before making any investment decisions.
#sonatasoftware #trendanalysis #chartpattern
Ola Electric - stock analysis: updateUpdated : In the last analysis,
The support of 39 still working.
As it stays intact we may expect following, combining technical chart view + some key fundamental investing ratios as well-
Technical Analysis (Weekly Chart)
Current Price: ₹41.31 (+2.00%)
Trend: Stock has been in a steep downtrend since listing (from near ₹120 levels). Recently showing signs of base formation around ₹38-₹42.
Chart Pattern:
Price moving in a falling wedge / downtrend channel.
Multiple attempts to break out above ₹46-₹47 resistance.
Long-term bottoming signs visible.
Key Support Levels
₹39 (major base support)
₹35 (breakdown risk below this)
₹30 (worst-case scenario)
Key Resistance Levels
₹46.3 (immediate resistance)
₹54.2 (supply zone)
₹68.3 (medium-term breakout target)
₹106.9 (long-term resistance if strong rally sustains)
Trading View:
If price holds above ₹39-41, it can attempt a bounce toward ₹54 to ₹68.
Sustained close above ₹68 may open rally toward ₹100+.
If it breaks below ₹39, risk of further fall toward ₹35-30.
Fundamental Snapshot (as per recent financials of Ola Electric)
Note: Ola Electric is a newly listed company (IPO in 2024), so fundamentals are still stabilizing.
Market Cap: ₹36,000 Cr (mid-cap, growth-oriented).
Revenue (FY24): ₹5,000 Cr (fast-growing, >35% YoY growth).
Profitability: Loss-making (negative net profit margin).
P/E Ratio: N/A (since company is loss-making).
P/B Ratio: 6-7 (high valuation compared to traditional auto companies).
Debt-to-Equity: Moderate, backed by fundraises but needs close watch.
EV Industry Growth: Strong demand push by Govt incentives (FAME II, EV subsidies).
Risk Factors:
Still in cash burn mode, uncertain path to profitability.
Competition from Tata Motors EV, TVS iQube, Ather Energy.
Heavy dependency on Govt policy & subsidies.
Conclusion:
Short-Term (Technical): Stock is near bottom support, bounce possible toward ₹54-₹68.
Medium-Term (Investment): Needs consistent revenue growth + reduction in losses for rerating.
Long-Term (5-7 years): Ola Electric could be a disruptor in EV space, but valuation & profitability risk remains high.
Disclaimer:
This analysis is for educational purposes only and not financial advice. Stock markets are risky, especially with new-age loss-making companies like Ola Electric. Please do your own research or consult a SEBI-registered financial advisor before investing.

TITAN company Ltd : ConsolidationTitan : detailed analysis based on the chart pattern
An Overview:
Current Price: ₹3,411
Trend: Long-term bullish,
short-term consolidation/downtrend.
Levels:
Support Levels: ₹2,677 / ₹2,617 / ₹2,535
Resistance: ₹3,886
Bias: Cautiously Bearish unless strong breakout above ₹3,886.
Investors can accumulate onnthese support levels for better results.
Disclaimer: Views are personal, the analysis is only for learning purpose and ideas are not any investment advice. Please consult your investment advisor before making any investments.

Dalmia Bharat: long 2120-2100 stop 2090 Keep eyes on the "Dalmia Bharat" : go long 2120-2100 stop 2090
Eying 2670..2900 in 4- 5 months

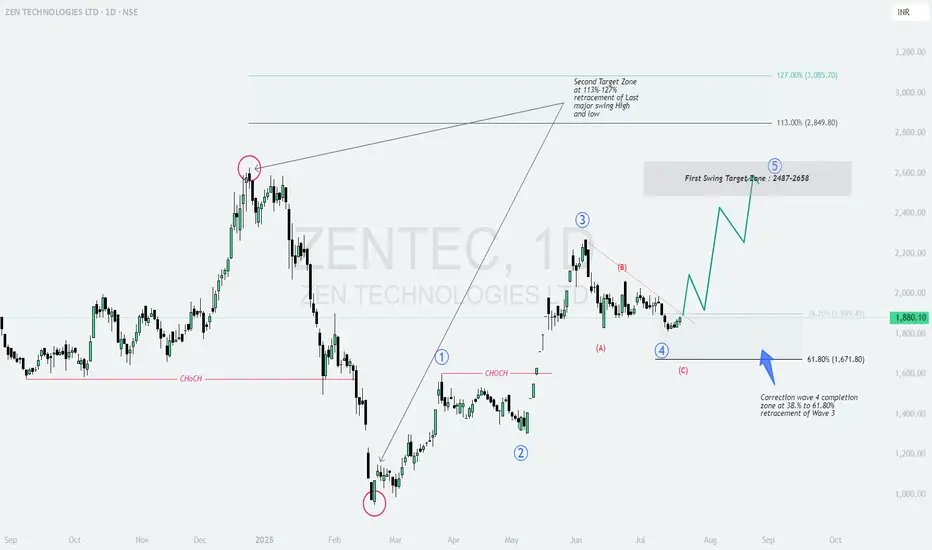
ZENTEC: Wave 4 Correction Complete – Ready for the Next wave?ZEN TECHNOLOGIES LTD (NSE: ZENTEC) – Daily Chart Analysis 🚀
Elliott Wave Structure | Fibonacci Retracement | Swing Targets
1. Why This Setup? 🤔
ZEN Technologies is showing a classic Elliott Wave structure, and the recent price action suggests a high-probability bullish reversal. Here’s why:
Wave 4 Correction Completed: The stock has retraced between the 38.2% (₹1,899) and 61.8% (₹1,671) Fibonacci levels of Wave 3, which is a textbook correction zone for Wave 4.
ABC Pattern: The correction unfolded as an ABC pattern, with the (C) leg finding support in the golden fib zone.
Change of Character (CHoCH): Multiple CHoCH points on the chart indicate a shift from bearish to bullish sentiment, suggesting that sellers are exhausted and buyers are stepping in. 🟢
2. Key Levels & Trade Plan 📊
Current Price: ₹1,880
Support Zone: ₹1,899–₹1,671 (38.2%–61.8% retracement of Wave 3) 🟢
First Swing Target Zone: ₹2,487–₹2,658 🟢
Second Target Zone: ₹2,849–₹3,085 (113%–127% extension of last major swing) 🟢
Why these targets?
The first target zone aligns with the projected completion of Wave 5, based on previous impulse waves.
The second target zone is calculated using the 113%–127% Fibonacci extension of the last major swing, a common area for extended moves in strong trends.
3. Risk Management 🛡️
Entry: Accumulate near current levels or on dips into the support zone. 🟢
Stop Loss: Daily close below ₹1,670 (61.8% retracement) to protect capital. 🔴
Targets:
1️⃣ First Target: ₹2,487–₹2,658 🟢
2️⃣ Second Target: ₹2,849–₹3,085 🟢
4. Technical Summary & Cautions 🟠
The completion of Wave 4 correction sets the stage for a potential Wave 5 rally .
Bullish momentum is likely to pick up above ₹1,900, with strong upside potential towards the target zones.
Caution: If price closes below ₹1,670 on a daily basis, the bullish setup is invalidated and further downside is possible. 🟠
Watch for confirmation candles and volume spikes for added conviction! 📈
Conclusion:
ZEN Technologies is offering a high-probability swing setup after a healthy correction. The risk/reward is attractive for positional traders, provided stops are respected. The technicals suggest a new uptrend could be starting, with clear targets and a logical stop loss. 🟢
Like & Follow for more setups! 👍✨
#ZENTEC #ElliottWave #SwingTrade #TechnicalAnalysis #TradingView #Stocks #NSE #Fibonacci #Breakout #StockMarket 🚀
G G Automotive Gears Ltd One-Page Equity ResearchInvestment Thesis – BUY | Target Price ₹300 | Upside ~24%
India’s only listed pure-play traction–gear specialist with 50-year pedigree and >500 OE customers
Rail & Metro orders at record high; Indian Railways raising locomotive build plan by 27% for FY26, driving multi-year volume visibility
Successful diversification into wind-energy, mining & industrial forgings lowers cyclicality and lifts blended margins
Balance-sheet repair complete; net-debt / equity down to 0.53× vs 1.52× in FY23
Snapshot (Standalone)
CommentRevenue (₹ Cr)95.377.336%
EBITDA Margin12.7%10.0%
PAT (₹ Cr)4.431.9497%
EPS (₹)5.322.4544%
ROCE14.9%8.2%
P/E (TTM)26.5×
Market Cap₹ 241 C
Valuation & Target
We apply 32× FY26E EPS (₹9.4) – a 30% discount to peer Elecon (45×) to reflect smaller scale but superior growth trajectory.
Derived Target Price ₹300 (prior ₹241 close), implying 24% upside plus optionality from export traction gears.
Key Catalysts
Indian Railways 100% electrification → higher demand for reduction gearboxes
Metro build-out (20+ cities) – first export order executed FY24 proves capability
Unit-III & IV capacity added FY24 (+30k sq ft) unlocks 35% volume expansion without major capex
Potential government PLI scheme for rail components may grant 6% incentive on sales (not in model).
Risks to Thesis
Lumpy order inflow from Railways could stretch working capital
Alloy-steel price spikes may compress gross margin; 65% raw-material cost is steel
Customer concentration: top-three PSU units >55% of revenue
Small free float → liquidity risk in sharp market Initiate BUY with ₹300 target; accumulate on dips toward ₹220. Recommend watch on quarterly order-book disclosures for traction confirmation.

HILTON : Reversal confirmed?
## 📘 \ HILTON METAL FORGING – Potential Reversal Setup Based on Elliott Wave Completion\
\ Timeframe:\ Daily
\ Structure:\ Completed 5-Wave Impulse (Bearish) → Recovery in Progress
\ Type:\ Swing Trade Setup | Wave Theory Based
---
### 🔍 \ 1. Context and Background:\
HILTON has completed a \ five-wave impulsive decline\ from highs of \~₹190 to a bottom near ₹50, signaling the end of a strong downtrend.
According to \ Elliott Wave Principles\ , after a completed 5-wave impulse, a corrective \ ABC structure\ (retracement) generally follows.
Current chart indicates that \ Wave 5 is complete\ and recovery is underway in the form of Wave A → B → C.
---
### 🔢 \ 2. Wave Count Overview:\
* \ Wave 1:\ Initial sharp decline
* \ Wave 2:\ Pullback to previous support
* \ Wave 3:\ Extended and steep fall
* \ Wave 4:\ Retracement to 50%-61.8% Fib zone (₹119.99–₹130.94)
* \ Wave 5:\ Final sell-off completing around ₹50–52 zone with capitulation
\ Note:\ Volume on Wave 5 bottom shows signs of exhaustion and early accumulation.
---
### 🧩 \ 3. Current Structure – Recovery Begins:\
* The chart marks the \ first rally without volume\ (Wave A)
* Followed by a correction forming \ Wave B (intermediate zone: ₹58–67)\
* Now tracking potential for Wave C upside, targeting key retracement zones
---
### 🎯 \ 4. Trade Levels and Projections:\
* \ Entry Zone:\ ₹58–67 (Wave B demand zone)
* \ First Target:\ ₹56–62 (gap-fill and prior resistance – conservative swing)
* \ Second Target:\ ₹132–142 (Extended retracement of Wave 4) – for positional traders
* \ Stop Loss:\ Below ₹56 (especially if the recovery wave fails or structure breaks)
---
### 🔍 \ 5. Technical Confluences:\
* \ Wave 4 retracement zone:\ ₹119.99–130.94 = 50–61.8% of Wave 3
* \ Extended retracement target:\ ₹132–142 (potential C-wave projection)
* \ Volume Analysis:\ Low volume rally followed by corrective dip shows early signs of base building
---
### ✅ \ 6. Strategic Notes:\
* \ This setup is ideal for swing or short-term positional traders\ aiming for 1:2+ RR
* Structure aligns with post-impulsive recovery behavior as per Elliott Wave
* \ Low-risk accumulation\ possible near ₹58–62 with defined SL
* Best trades come from structure + sentiment shift – both are visible here
---
### 📌 \ Conclusion:\
HILTON METAL appears to have \ completed its 5-wave downtrend\ and is entering a corrective phase.
The current \ Wave B zone (₹58–67)\ offers a good risk-managed opportunity to participate in the \ Wave C upside\ toward ₹132–142.
Traders must monitor price action and volume closely around the current level and protect downside with a stop below ₹56.
