Universal Cables Breaking Out With Good Volumes.NSE:UNIVCABLES today made a king candle hitting the upper circuit of 20% throughout the day with a huge Volume Candle. It took support from a Major Demand Zone With MACD Showing a Buy Signal, until 20 DSMA or Demand Zone is not Breached the up move will Continue further.
NSE:UNIVCABLES is predominantly engaged in the business of manufacturing a large range of power cables from 1.1kV to 400kV & capacitors, Turnkey Projects and other types of wires and cables, conductors, etc.
📌Thank you for exploring my idea! I hope you found it valuable.
🙏FLLOW for more
👍BOOST if useful
✍️COMMENT Below your views.
Meanwhile, check out my other stock ideas below until this trade is activated. I would love your feedback.
Disclaimer: This analysis is intended solely for informational and educational purposes and should not be interpreted as financial advice. It is advisable to consult a qualified financial advisor or conduct thorough research before making investment decisions.
Supply and Demand

Nifty Intraday Analysis for 19th December 2024NSE:NIFTY
Index closed near 24200 level and Maximum Call and Put Writing near CMP as below in current weekly contract:
Call Writing
24500 Strike – 114.28 Lakh 24300 Strike – 113.59 Lakh
24400 Strike – 104.68 Lakh
Put Writing
24000 Strike – 85.55 Lakh
24200 Strike – 74.22 Lakh
23900 Strike – 56.04 Lakh
Index has resistance near 24325 - 24350 range and if index crosses and sustains above this level then may reach near 24450 - 24500 range.
Index has immediate support near 24050 – 24000 range and if this support is broken then index may tank near 23850 – 23800 range.
Big Moment on either side expected after US FOMC Meeting outcome and Commentary on 18 - 19 Dec’24 night.

Banknifty Intraday Analysis for 19th December 2024NSE:BANKNIFTY
Index closed near 52140 level and Maximum Call and Put Writing near CMP as below in December Month contract:
Call Writing
54000 Strike – 44.35 Lakh
53500 Strike – 23.76 Lakh
53000 Strike – 28.03 Lakh
Put Writing
51000 Strike – 15.20 Lakh
52000 Strike – 14.89 Lakh
52500 Strike – 13.82 Lakh
Index has resistance near 52600 – 52700 range and if index crosses and sustains above this level then may reach near 53000 – 53200 range.
Index has immediate support near 52000 - 51900 range and if this support is broken then index may tank near 51400 - 51300 range.
Big Moment on either side expected after US FOMC Meeting outcome and Commentary on 18 - 19 Dec’24 night.

Finnifty Intraday Analysis for 19th December 2024NSE:CNXFINANCE
Index closed near 24200 level and Maximum Call and Put Writing near CMP as below in December Month contract:
Call Writing
24600 Strike – 1.97 Lakh
24800 Strike – 1.87 Lakh
24500 Strike – 1.52 Lakh
Put Writing
23500 Strike – 1.12 Lakh
24000 Strike – 1.11 Lakh
24700 Strike – 0.94 Lakh
Index has resistance near 24400 - 24450 range and if index crosses and sustains above this level then may reach near 24650 - 24700 range.
Index has immediate support near 24050 – 24000 range and if this support is broken then index may tank near 23800 – 23750 range.
Big Moment on either side expected after US FOMC Meeting outcome and Commentary on 18 - 19 Dec’24 night.

Midnifty Intraday Analysis for 19th December 2024NSE:NIFTY_MID_SELECT
Index closed near 13030 level and Maximum Call and Put Writing near CMP as below in December Month contract:
Call Writing
13200 Strike – 5.69 Lakh
13000 Strike – 3.78 Lakh
13300 Strike – 3.20 Lakh
Put Writing
13000 Strike – 4.21 Lakh
12800 Strike – 3.44 Lakh
13100 Strike – 2.65 Lakh
Index has immediate resistance near 13175 – 13225 range and if index crosses and sustains above this level then may reach 13350 – 13400 range.
Index has immediate support near 12990 – 12950 range and if this support is broken then index may tank near 12850 – 12800 range.
Big Moment on either side expected after US FOMC Meeting outcome and Commentary on 18 - 19 Dec’24 night.

Nifty levels - Dec 20, 2024Nifty support and resistance levels are valuable tools for making informed trading decisions, specifically when combined with the analysis of 5-minute timeframe candlesticks and VWAP. By closely monitoring these levels and observing the price movements within this timeframe, traders can enhance the accuracy of their entry and exit points. It is important to bear in mind that support and resistance levels are not fixed, and they can change over time as market conditions evolve.
The dashed lines on the chart indicate the reaction levels, serving as additional points of significance to consider. Furthermore, take note of the response at the levels of the High, Low, and Close values from the day prior.
We hope you find this information beneficial in your trading endeavors.
* If you found the idea appealing, kindly tap the Boost icon located below the chart. We encourage you to share your thoughts and comments regarding it.
Wishing you success in your trading activities!
BankNifty levels - Dec 20, 2024Utilizing the support and resistance levels of BankNifty, along with the 5-minute timeframe candlesticks and VWAP, can enhance the precision of trade entries and exits on or near these levels. It is crucial to recognize that these levels are not static, and they undergo alterations as market dynamics evolve.
The dashed lines on the chart indicate the reaction levels, serving as additional points of significance. Furthermore, take note of the response at the levels of the High, Low, and Close values from the day prior.
We trust that this information proves valuable to you.
* If you found the idea appealing, kindly tap the Boost icon located below the chart. We encourage you to share your thoughts and comments regarding it.
Wishing you successful trading endeavors!

Insecticides India - Bullish OpportunityWe have a bullish opportunity for Insecticides India - positional long:
- Trend seems to be upwards on Monthly and Weekly TFs
- On 1 Day TF, we have price reacting upwards from nearest 1-D Demand Zone
- As per Elliott Wave model, price is forming bullish impulse wave upwards as shown in the chart. Currently, it seems to be just starting to initiate a 5th wave upwards on 1-D TF
- We will wait for proper impulse formation until price crosses 855ish and then time an entry on hourly or 75 Mins TF chart. As of now, this is on my radar/watchlist.

R-Power Bullish opportunitySince, there is a good flow of news on this stock, let's analyze it from technical standpoint for positional long bet.
In the chart (Weekly):
- We seem to be in primary impulse 3rd wave of which we have created sub impulse waves 1-2-3-4 (colored in yellow)
- The yellow colored 3rd may have either terminated at 50 and is coming towards 34 for completing yellow colored 4th wave OR the price may go up from here itself and touch yellow 3rd wave of target of 60ish and then some consolidation may happen
- Also, note we have a good strong weekly demand zone at 32-34ish and price if enters here again, can be a good long bet with excellent risk reward

Nifty Correction for today, tomorrow?This is quick analysis only for today and tomorrow (10th and 11th Dec). We are using 15 Mins Time Frame.
- Seems on lower Time Frames of 15/5 Mins, we have Nifty going through Distribution zone and in complex corrections as per Elliott Wave model
- As marked here, we "may" be in middle of small sub c-wave formation on 15 Mins TF. If spot price ditches PDL (Previous Day Low) and also then sub a-wave downside, then we are in good confirmation that market is going downside to complete sub c-wave today/tomorrow. It has to surpass 24550-24500 though
- If it goes down, we may have a small demand zone at 24400-24350 (marked in chart as green zone) where price may either consolidate and go upwards or distribute and try to go downside. In short, this will be our checkpoint of next steps after the downside view execution

Plan XAUUSD at 19.12.2024The FOMC has signaled hawkishness by planning to cut interest rates only twice in 2025.
"We should be focusing on selling primarily. Following the ABC wave pattern. The target for the rebound is expected to reach 264x."
Goodluck!

AUDUSD - SWING TRADE IDEA ON LONG SIDESymbol - AUDUSD
AUDUSD is currently trading at 0.6305
I'm seeing a trading opportunity on buy side.
Buying AUDUSD pair at CMP 0.6305
I will be adding more if 0.6270 - 0.6240 comes & will hold with SL 0.6215
Targets I'm expecting are 0.6360 - 0.6410 & 0.6450
Disclaimer - Do not consider this as a buy/sell recommendation. I'm sharing my analysis & my trading position. You can track it for educational purposes. Thanks!

USDCAD - SWING TRADE IDEA ON SHORT SIDESymbol - USDCAD
USDCAD is currently trading at 1.4325
I'm seeing a trading opportunity on sell side.
Shorting USDCAD pair at CMP 1.4325
I will add more quantity at 1.4350 & 1.4380, If comes. Holding with SL 1.4420
Targets I'm expecting are 1.4250 - 1.4200 & 1.4155
Disclaimer - Do not consider this as a buy/sell recommendation. I'm sharing my analysis & my trading position. You can track it for educational purposes. Thanks!

BAJAJ FINSERV fibs and demand supplyBajaj Finserv has a resistance of 1930 & 1777 in weekly and support lies at 1450.
next support at 1200 and 986
don't panic to buy bajaj finserv wait till stock forms a good candle near 1450
consult your financial advisor before trading.

AXIS BANK LEVELSSupport Level of AXIS BANK
Buy axis bank on these levels 987 when in hourly oversold region on intraday basis
823 is for positional buyers.
Don't short Axis bank on positional basis as it has not given enough return on 5 yearly basis
Fresh long trades now are not avaialble as market is weak
Consult your financial advisor before trading

BANKNIFTY coming to fill its GAP!?As we can see BANKNIFTY continued its bearishness after it couldn’t break above flag-pole pattern resulting in unidirectional fall. Now falling the global cues we can again expect BANKNIFTY to remain bearish and might come and fill the gap before finally the gap acts as SUPPORT and signs of REVERSAL around that gap can result in new bullish sentiment so plan your trades accordingly.

A perfect example of head and shoulder pattern.Like picture in book perfect example of head and shoulder pattern, which is break out today. So the target is the equal to of same down pick to the up pick.


BankNifty Intraday Support & Resistance Levels for 19.12.2024On Wednesday, BankNifty opened negative, reached a high of 52827.60, but slipped to a low of 52010.65, entering the Daily Demand Zone. It ended the day at 52139.55, down by 695 points, marking its second consecutive losing session. The Weekly Trend (50 SMA) remains positive, while the Daily Trend (50 SMA) has shifted to sideways.
Demand/Support Zones
Near Demand/Support Zone (Daily): 51693.95 - 52197.25 (current price inside this zone)
Far Support: 51353 (61.8% Fibonacci level)
Far Demand/Support Zone (125m): 50898.75 - 51271.50
Far Demand/Support Zone (Daily): 49787.10 - 50983.50
Supply/Resistance Zones
Near Supply/Resistance Zone (125m): 52709.40 - 52911.10
Near Supply/Resistance Zone (15m): 53159.20 - 53276.55
Far Supply/Resistance Zone (30m): 53489.70 - 53675.05
Far Supply/Resistance Zone (Weekly): 53741.40 - 54467.35 (tested)

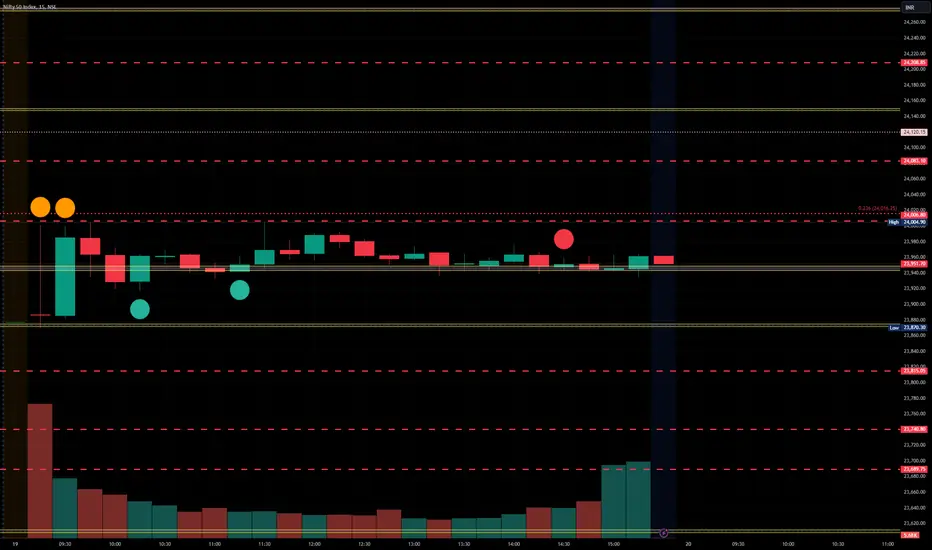
Nifty Intraday Support & Resistance Levels for 19.12.2024On Wednesday, Nifty opened negative, touched a high of 24394.45, but couldn’t sustain it and fell to a low of 24149.85. It ended the day at 24198.85, marking its third consecutive losing session, with a loss of 137 points. Both the Weekly Trend (50 SMA) and Daily Trend (50 SMA) are currently sideways.
Demand/Support Zones
Near Demand/Support Zone (Daily): 23927.15 - 24188.45 (tested twice)
Far Demand/Support Zone (75m): 23447.15 - 23578.60
Far Support is at 23872 (61.8% FIBO)
Far Support is at 23263 (low of 21st November 2024)
Supply/Resistance Zones
Near Supply/Resistance Zone (125m): 24601.75 - 24698.10
Near Supply/Resistance Zone (Weekly): 24567.65 - 25234.05 (tested)
Far Supply/Resistance Zone (Daily): 25739.20 - 25907.60
Far Supply/Resistance Zone (Daily): 26151.40 - 26277.35

AdbeBearish Wyckoff Distribution Schematic #2 (unorthodox)
I would be happy to go wrong however I do see this to test 260 in 2 yrs
it has to cross 590 to nullify this setup

Lupin: Decline After Highs Offers Buying Potential Topic Statement: Lupin faces selling pressure after reaching its lifetime high in 2024, with the price slowly declining in a channel.
Key Points:
1. The stock price is falling within a down-trending channel.
2. The price is nearing the 180-day moving average, presenting a good buying opportunity at or below this level.
