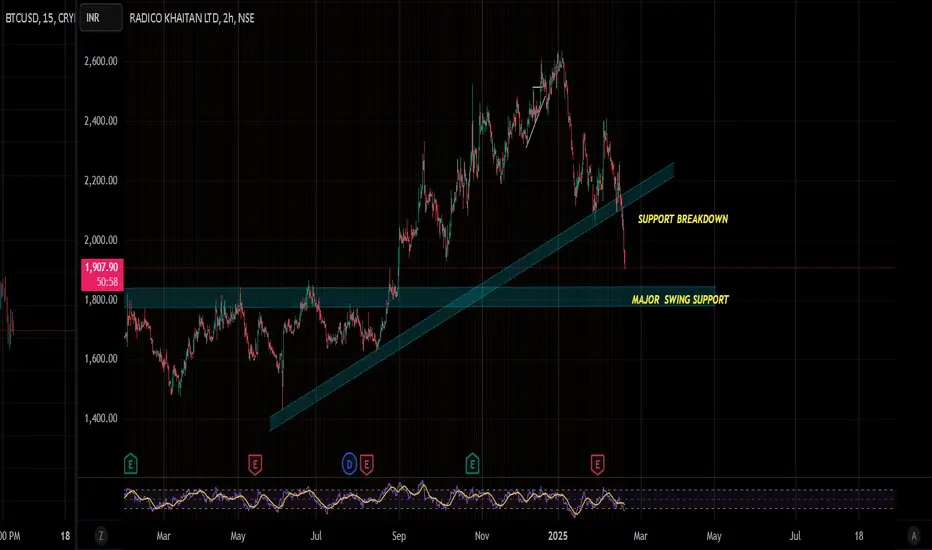
SWING (KEEP WATCH) - RADICO KHAITAN
Script broke support trendline- and in down move heading towards major support area around 1840 . If holds on to support can give a good bounce
Supply and Demand
Day candle analysisThis is just my analysis for ongc accordingly to supply demand your analysis can be different don't take buy or sell from my analysis it's just for education purposes.
Well according to my analysis it have to first make a trap for seller and then move upward, find your own reversal candlestick pattern
I will wait for strong hammer before buying

SWING OBSERVATION -GODFRREYPHILIP INDIAScript showed excellent intraday momentum after support from Bounce ,creating HH HL & retest of 4670 level , may head to test next major swing resistance near 5900 levels

Nifty50 Current View NSE:NIFTY
After breakout it has shown sharp fall towards previous demand zone and this level also comes around the retesting zone.
in the last session we have seen some demand coming in from the lows and candle formed decent wick and its not the 1st time on 12th feb wednesday also shown similar movement.
So now it makes a major support around 22800-750 zone this should hold to have some hopes of reversal from here.
We need a bullish confirmation from this level to take fresh entries.
Keep Learning
Happy Trading.

Mastering the Intraday Sutra: An intraday trading strategyMastering the Intraday Sutra: A Professional Guide to Trading Indian Markets with Precision
(Adapting Globex Strategy-Inspired Concepts to India’s Unique Trading Hours)
Introduction
The Intraday Sutra strategy is a systematic approach designed for India’s equity/futures markets, inspired by the principles of identifying key price levels (similar to the Globex "high/low" concept) but tailored to India’s fixed trading hours (9:15 AM – 3:30 PM). This strategy leverages prior-day price action, supply-demand zones, and disciplined risk management to capitalize on intraday opportunities. Below, we break down its components for clarity and repeatability.
Strategy Overview
1. Core Instruments
Indices: All indices
Stocks: Nifty 50 constituents for alignment with index momentum
2. Ideal Time Frames
5-minute charts: For granular entry/exit precision.
15-minute charts: To filter noise and align with broader intraday trends.
Key Levels: Prior-Day High/Low & Supply-Demand Zones
1. Plotting Prior-Day High (PDH) and Prior-Day Low (PDL)
Purpose: These levels act as psychological benchmarks.
Method:
- Manually mark PDH/PDL on your chart.
- Use Trading View indicators (e.g., “Previous Day High-Low”) for automation.
2. Identifying Supply-Demand Zones
-Supply Zone:
- Formation: Rally → Base → Drop (RBD) or Drop → Base → Drop (DBD).
- Action: Potential sell zone; price often reverses downward here.
- Demand Zone:
- Formation: Drop → Base → Rally (DBR) or Rally → Base → Rally (RBR).
- Action: Potential buy zone; price often reverses upward here.
Zone Validation Rules:
1. Structure: The “base” (consolidation) must be ≤6 candles; the breakout must show ≥2 impulsive candles.
2. Freshness: Only trade untested zones (no prior price interaction).
3. Zone Merging: Combine overlapping zones or prioritize the one with the best risk-reward ratio.
Entry & Trade Triggers
1. Breakout Confirmation
Short Entry: Triggered when price breaks above prior-day high (PDH) and retests a fresh supply zone.
Long Entry: Triggered when price breaks below prior-day low (PDL) and retests a fresh demand zone.
2. Order Placement
Buy Limit Orders: Set at the demand zone’s proximal line
Sell Limit Orders: Set at the supply zone’s proximal line
Risk Management Framework
1. Stop Loss Placement
Long Trades: Below the demand zone (mechanical rule) or 5% of the Daily Average True Range (ATR) below the distal line of demand
Short Trades: Above the supply zone (mechanical rule) or 5% of Daily ATR above the distal line of supply
2. Position Sizing
Risk ≤1-2% of capital per trade to preserve longevity.
Trade Management & Profit Targets
1. Initial Target: 2:1 Risk-Reward (2R).
Example: If risking ₹1000, target ₹2000 profit.
2. Trailing Stop : Move stop loss to breakeven at 2R, then trail for 3R+ using price structure (e.g., swing lows/highs).
3. Priority: Focus on “A+ Setups” where zones align with higher timeframes (for example a 5 mins zone within a 15 mins zone or higher)
Critical Success Factors
1. Timing is Everything
Optimal Entry Window: 9:15 AM – 11:00 AM (peak liquidity, institutional participation).
Avoid Late Trades: Post-2:00 PM entries often lack momentum for robust risk-reward outcomes.
2. Confluence with Higher Timeframes
- Strengthen signals by aligning 5/15-minute zones with hourly/daily support/resistance/supply/demand zones
3. Event-Driven Volatility
Capitalize on gaps from overnight global news (e.g., US Fed, crude oil prices) or domestic catalysts (RBI policies, earnings).
Tools & Execution
Charting: Trading View for automated PDH/PDL and zone plotting
Mindset: Discipline to avoid overtrading and stick to fresh zones.
Example: The example taken here is on the Nifty 15 mins chart. See how the price broke the previous day's low and reacted nicely from a prior higher quality demand zone. These levels can act as trap levels trapping most of the retail traders and investors on the opposite side of the trade. The price gave a nice bounce from the demand zone and went on to rally to the opposing supply zone giving a greater than 3:1 R:R.
Conclusion
The Intraday Sutra strategy combines technical precision with rigorous risk management, offering a structured way to navigate India’s time-bound markets. By focusing on prior-day extremes, fresh supply-demand zones, and strategic timing, traders can systematically exploit intraday inefficiencies. Remember: Consistency beats complexity. Back test rigorously, refine your process, and let discipline drive profitability.
Final Note: Always validate this strategy in a simulated environment before deploying live capital. Use Trading View Bar Replay functionality to test your strategy.
Markets evolve—stay adaptive!

SHAHALLOYS: Signs of Reversal?Hello fellow traders,
I hope everyone is doing well.
Please find my analysis for SHAHALLOYS below:
Key Observations:
1. Reversal from Support Zone: SHAHALLOYS appears to be reversing from a key support area.
2. 200 Weekly EMA Support: The price seems to be holding around the 200 Weekly EMA, indicating potential strength.
3. Chart Pattern: A falling wedge pattern is visible, which is typically a bullish reversal signal. The breakout and subsequent retest have already occurred.
4. Entry Point: A good entry opportunity could be around current levels of ₹69.19 level.
5. Targets: The potential targets are marked on the chart as T1, T2, and T3.
6. Risk-to-Reward Ratio: The trade offers an attractive R:R of 1:3.
Disclaimer:
This is purely an analysis and not investment advice. Please trade responsibly, conduct your own research, and manage your risks carefully.
I hope you find this analysis helpful. Thank you in advance for your support! 😊
Best regards,
Anantesh

Nifty Intraday Analysis for 14th February 2025NSE:NIFTY
Index closed near 23030 level and Maximum Call and Put Writing near CMP as below in current weekly contract:
Call Writing
23500 Strike – 42.42 Lakh 23400 Strike – 37.91 Lakh
23200 Strike – 32.49 Lakh
Put Writing
22500 Strike – 32.37 Lakh
23000 Strike – 27.10 Lakh
22800 Strike – 23.109 Lakh
Index has resistance near 23225 - 23275 range and if index crosses and sustains above this level then may reach near 23400 - 23450 range.
Index has immediate support near 22800 – 22750 range and if this support is broken then index may tank near 22650 – 22600 range.
Big move expected on either side with upside biases as per outcome of PM Modi and President Trump meeting and trade deals tonight followed by a press conference.

Banknifty Intraday Analysis for 14th February 2025NSE:BANKNIFTY
Index closed near 49360 level and Maximum Call and Put Writing near CMP as below in February Month contract:
Call Writing
51000 Strike – 16.73 Lakh
50000 Strike – 13.46 Lakh 50500 Strike – 9.67 Lakh
Put Writing
49000 Strike – 13.60 Lakh
48000 Strike – 11.63 Lakh
49500 Strike – 8.78 Lakh
Index has resistance near 49900 – 50000 range and if index crosses and sustains above this level then may reach near 50500 – 50600 range.
Index has immediate support near 48800 - 48700 range and if this support is broken then index may tank near 48100 - 48000 range.
Big move expected on either side with upside biases as per outcome of PM Modi and President Trump meeting and trade deals tonight followed by a press conference.

Finnifty Intraday Analysis for 14th February 2025NSE:CNXFINANCE
Index closed near 23270 level and Maximum Call and Put Writing near CMP as below in February Month contract:
Call Writing
23500 Strike – 1.20 Lakh
23000 Strike – 0.57 Lakh
23400 Strike – 0.54 Lakh
Put Writing
23500 Strike – 1.13 Lakh
23000 Strike – 0.64 Lakh
23400 Strike – 0.43 Lakh
Index has resistance near 23350 - 23400 range and if index crosses and sustains above this level then may reach near 23550 - 23600 range.
Index has immediate support near 23100 – 23050 range and if this support is broken then index may tank near 22900 – 22850 range.
Big move expected on either side with upside biases as per outcome of PM Modi and President Trump meeting and trade deals tonight followed by a press conference.

Midnifty Intraday Analysis for 14th February 2025NSE:NIFTY_MID_SELECT
Index closed near 11360 level and Maximum Call and Put Writing near CMP as below in February Month contract:
Call Writing
11600 Strike – 3.73 Lakh
11500 Strike – 3.49 Lakh
11700 Strike – 2.91 Lakh
Put Writing
11500 Strike – 5.89 Lakh
11400 Strike – 4.71 Lakh
11300 Strike – 2.32 Lakh
Index has immediate resistance near 11550 – 11600 range and if index crosses and sustains above this level then may reach 11750 – 11800 range.
Index has immediate support near 11250 – 11200 range and if this support is broken then index may tank near 11050– 11000 range.
Big move expected on either side with upside biases as per outcome of PM Modi and President Trump meeting and trade deals tonight followed by a press conference.

BankNifty levels - Feb 17, 2025Utilizing the support and resistance levels of BankNifty, along with the 5-minute timeframe candlesticks and VWAP, can enhance the precision of trade entries and exits on or near these levels. It is crucial to recognize that these levels are not static, and they undergo alterations as market dynamics evolve.
The dashed lines on the chart indicate the reaction levels, serving as additional points of significance. Furthermore, take note of the response at the levels of the High, Low, and Close values from the day prior.
We trust that this information proves valuable to you.
* If you found the idea appealing, kindly tap the Boost icon located below the chart. We encourage you to share your thoughts and comments regarding it.
Wishing you successful trading endeavors!

Nifty levels - Feb 17, 2025Nifty support and resistance levels are valuable tools for making informed trading decisions, specifically when combined with the analysis of 5-minute timeframe candlesticks and VWAP. By closely monitoring these levels and observing the price movements within this timeframe, traders can enhance the accuracy of their entry and exit points. It is important to bear in mind that support and resistance levels are not fixed, and they can change over time as market conditions evolve.
The dashed lines on the chart indicate the reaction levels, serving as additional points of significance to consider. Furthermore, take note of the response at the levels of the High, Low, and Close values from the day prior.
We hope you find this information beneficial in your trading endeavors.
* If you found the idea appealing, kindly tap the Boost icon located below the chart. We encourage you to share your thoughts and comments regarding it.
Wishing you success in your trading activities!

ONGC : Is oil Going to burn?
Technical View
Box trading strategy in which you identify a stock consolidating for couple of days and trade in the direction of the breakout. In case of ONGC the stock was consolidating for about three days before breaking out earlier today.
PRO TIP
Use the High of the candle as your stop loss and trail it to either protect profits or hold your trade for longer duration.
Target 227 Intra-day Target
Fundamentals
Weak Q3FY25 Results:
ONGC's consolidated net profit attributable to owners declined by 19.4% to ₹8,621.69 crore in Q3 FY25, compared to ₹10,703.13 crore in the same period last year. This drop was attributed to lower global crude prices.
The company reported a 6.9% decrease in net profit for the quarter, standing at ₹9,784 crore, down from ₹10,511 crore in the same period last year.
ONGC's gross revenue also showed a slight decline of 0.7%, falling to ₹1.66 trillion in Q3 FY25, compared to ₹1.67 trillion in Q3 FY241. The company's revenue from operations also saw a decline, reaching ₹166,096.68 crore.
Bearish Trend: The stock is trading below its 5-day, 20-day, 50-day, 100-day, and 200-day moving averages, which indicates a bearish trend in its short to long-term performance.
Brokerage Views:
CLSA has cut its FY25 EPS estimate by 5% due to cautious outlooks on the company's production and profitability
Not an investment advice

nifty low is almost done..... Please consult your financial advisor before investing.This is only for learning purpose of chart.
We are NISM certified EQ and MCX trader but not SEBI register investment advisor.

Muthoot Finance | VCP Pattern in Play Muthoot Finance | VCP Pattern in Play 🔍
Technical Overview
📈 Trend: Uptrend, trading within an ascending channel.
🔄 Pattern: Volatility Contraction Pattern (VCP) in progress, signaling potential explosive movement.
📉 Correction: The stock corrected ~15% during the recent market sell-off but rebounded strongly, re-entering the channel. It’s now only ~9% off its recent ATH, showcasing resilience.
Key Levels to Watch
✅ Entry Point: Breakout above ₹2279 with strong volume and a wide-range candle.
🎯 Targets:
T1: ₹2492 (R:R = 1:1)
T2: ₹3200+ (post-market stabilization, aiming for R:R = 1:2)
🛡️ Stop Loss: ₹2067.9 (below the most recent swing low to manage risk).
Strategy
1️⃣ Enter 30% position on a clean breakout above ₹2279. Wait for a retest and continuation to add the rest.
2️⃣ If the breakout is sharp and you miss the entry, wait for a retest and continuation before entering, do not enter in FOMO.
3️⃣ Once T1 is hit, book partial profits to lock in gains, given the weak market conditions.
4️⃣ Hold the remaining position as per your risk appetite and trail your SL to protect profits.
Why This Stock?
⭐ Resilience: Despite the correction, Muthoot Finance re-entered the channel, showing strength against market headwinds.
📊 Strong Indicators: RSI is rising, signaling bullish momentum, and the VCP pattern suggests tightening volatility before a potential breakout.
📉 Controlled Drawdown: From its ATH, the stock fell just ~9%, demonstrating relative strength compared to the broader market.
⭐Trading above Key DMAs
Key Risks to Consider
⚠️ Weak Market Conditions: Broader market trends remain bearish, trading below the 200 DMA, increasing the chance of a failed breakout.
⚠️ Volume Dependency: Strong breakout volume is essential to validate the pattern.
⚠️ Market Correlation: Any further market correction could pressure this trade setup and the probability of hitting the SL increases. So trade light.
Who Should Trade This?
1️⃣Aggressive Traders: Can follow the breakout strategy with proper position sizing.
2️⃣Conservative Traders: Wait for market stabilization and a close of NIFTY 50, Nifty 500 above the 200 DMA before entering any trade.
Actionable Insights
🔒 Lock Partial Profits at T1: Secure gains to mitigate risk in this volatile environment.
📈 Trail Your Stop Loss: Once T1 is achieved, manage the trade dynamically to maximize returns.
Disclaimer
This analysis is for educational purposes only and not financial advice. Please conduct your own research and analysis before making any investment decisions. Trading involves significant risk.
Trade wisely and stay disciplined! 🚀📊

Nifty Intraday Analysis for 13th February 2025NSE:NIFTY
Index closed near 23045 level and Maximum Call and Put Writing near CMP as below in current weekly contract:
Call Writing
23500 Strike – 123.96 Lakh 23300 Strike – 84.65 Lakh
23400 Strike – 75.55 Lakh
Put Writing
22500 Strike – 115.67 Lakh
22700 Strike – 91.16 Lakh
22800 Strike – 69.99 Lakh
Index has resistance near 23225 - 23275 range and if index crosses and sustains above this level then may reach near 23400 - 23450 range.
Index has immediate support near 22800 – 22750 range and if this support is broken then index may tank near 22650 – 22600 range.

Banknifty Intraday Analysis for 13th February 2025NSE:BANKNIFTY
Index closed near 49480 level and Maximum Call and Put Writing near CMP as below in February Month contract:
Call Writing
50000 Strike – 12.12 Lakh
50500 Strike – 9.71 Lakh 49000 Strike – 7.71 Lakh
Put Writing
49000 Strike – 14.26 Lakh
48000 Strike – 12.02 Lakh
49500 Strike – 8.42 Lakh
Index has resistance near 49900 – 50000 range and if index crosses and sustains above this level then may reach near 50500 – 50600 range.
Index has immediate support near 48800 - 48700 range and if this support is broken then index may tank near 48300 - 48200 range.

Finnifty Intraday Analysis for 13th February 2025NSE:CNXFINANCE
Index closed near 23195 level and Maximum Call and Put Writing near CMP as below in February Month contract:
Call Writing
23500 Strike – 1.29 Lakh
23000 Strike – 0.73 Lakh
23200 Strike – 0.54 Lakh
Put Writing
23500 Strike – 0.98 Lakh
23000 Strike – 0.90 Lakh
23200 Strike – 0.40 Lakh
Index has resistance near 23350 - 23400 range and if index crosses and sustains above this level then may reach near 23550 - 23600 range.
Index has immediate support near 23050 – 23000 range and if this support is broken then index may tank near 22850 – 22800 range.

Nifty levels - Feb 14, 2025Nifty support and resistance levels are valuable tools for making informed trading decisions, specifically when combined with the analysis of 5-minute timeframe candlesticks and VWAP. By closely monitoring these levels and observing the price movements within this timeframe, traders can enhance the accuracy of their entry and exit points. It is important to bear in mind that support and resistance levels are not fixed, and they can change over time as market conditions evolve.
The dashed lines on the chart indicate the reaction levels, serving as additional points of significance to consider. Furthermore, take note of the response at the levels of the High, Low, and Close values from the day prior.
We hope you find this information beneficial in your trading endeavors.
* If you found the idea appealing, kindly tap the Boost icon located below the chart. We encourage you to share your thoughts and comments regarding it.
Wishing you success in your trading activities!

Midnifty Intraday Analysis for 13th February 2025NSE:NIFTY_MID_SELECT
Index closed near 11395 level and Maximum Call and Put Writing near CMP as below in February Month contract:
Call Writing
11500 Strike – 2.95 Lakh
11700 Strike – 2.79 Lakh
11600 Strike – 2.47 Lakh
Put Writing
11500 Strike –6.22 Lakh
11400 Strike – 4.68 Lakh
11300 Strike – 2.73 Lakh
Index has immediate resistance near 11550 – 11600 range and if index crosses and sustains above this level then may reach 11750 – 11800 range.
Index has immediate support near 11300 – 11250 range and if this support is broken then index may tank near 11150– 11100 range.

BankNifty levels - Feb 14, 2025Utilizing the support and resistance levels of BankNifty, along with the 5-minute timeframe candlesticks and VWAP, can enhance the precision of trade entries and exits on or near these levels. It is crucial to recognize that these levels are not static, and they undergo alterations as market dynamics evolve.
The dashed lines on the chart indicate the reaction levels, serving as additional points of significance. Furthermore, take note of the response at the levels of the High, Low, and Close values from the day prior.
We trust that this information proves valuable to you.
* If you found the idea appealing, kindly tap the Boost icon located below the chart. We encourage you to share your thoughts and comments regarding it.
Wishing you successful trading endeavors!

SWING OBSERVATION - SBI CARDSScrip bounced from support trendline 780 froming HHHL with retest & cleared resistance of 815 may head to test 920 swing area Resistance

view on united brewriesIF it stays above 2124-2094, it can do 2250+
but failing to do that, downside target would be 1920
