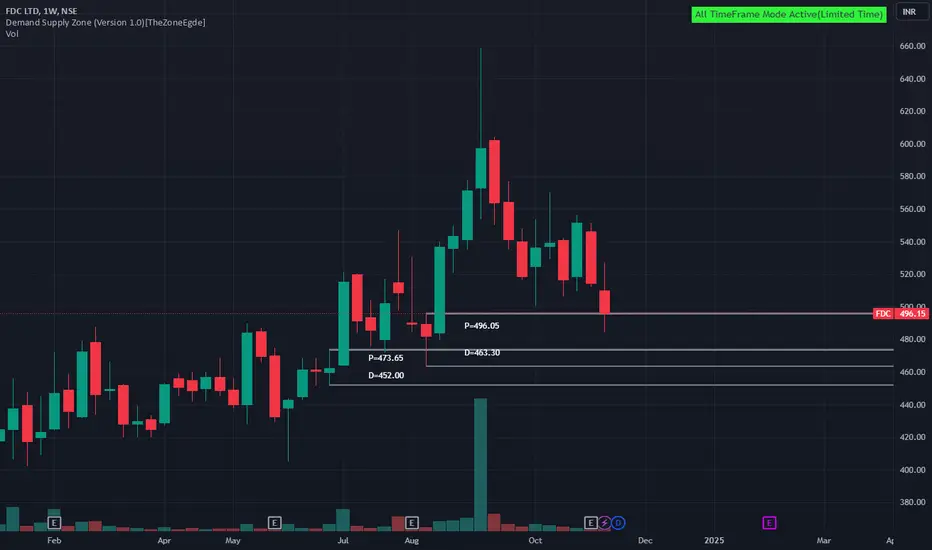
FDC Trading Above Fresh Weekly Demand ZoneFDC is currently trading at ₹496.15, slightly above its demand zone between ₹493.95 and ₹463.3, identified on 23rd August 2024. This fresh zone has not been tested yet, suggesting potential buying interest if the stock price dips back into this range. Investors may watch for a pullback, which could present a buying opportunity around this support level.
Supply and Demand
GRANULES Trading Above Fresh Weekly Demand Zone GRANULES is currently trading at ₹533.9, slightly above its demand zone between ₹523.5 and ₹500.65, established on 2nd August 2024. This fresh zone remains untested, indicating potential buying interest if the price revisits this range. Investors may monitor for a pullback towards this zone, which could offer a buying opportunity with strong support.

TORNTPOWER Trading Within Fresh Weekly Demand ZoneTORNTPOWER is currently trading at ₹1559, positioned within its demand zone between ₹1609.2 and ₹1456.05, identified on 2nd August 2024. This fresh zone has not yet been tested, suggesting potential buying interest if the stock remains in this range. Investors might consider watching for support around these levels, indicating a possible upward movement.

VOLTAMP Trading Within Fresh Demand ZoneVOLTAMP is currently trading at ₹9232.65, positioned within its demand zone between ₹9445.3 and ₹8881.6, established on 27th March 2024. This fresh zone has not been tested yet, indicating potential buying interest if the price stabilizes within this range. Investors may monitor this level for signs of support, suggesting a possible rebound opportunity.

TRIVENI Trading Within Tested Demand ZoneTRIVENI is currently trading at ₹377.5, positioned within its tested demand zone between ₹378.75 and ₹366, identified on 13th June 2024. This zone has already demonstrated support in the past, which may continue to attract buying interest. Investors could consider this level for potential accumulation, anticipating a bounce from this proven support area.

IRB Trading Within Fresh Demand ZoneIRB is currently trading at ₹47.76, situated within its demand zone between ₹48.25 and ₹46.65, established on 20th January 2024. This fresh zone has not been tested, indicating the possibility of buying interest at these levels. Investors may watch for support within this range, which could lead to a potential bounce-back opportunity.

EXIDEIND Trading Within Fresh Demand ZoneEXIDEIND is currently trading at ₹418.1, positioned within its demand zone between ₹423.65 and ₹398.85, identified on 16th April 2024. This zone remains fresh and untested, suggesting potential buying interest if the stock price consolidates within this range. Investors may look for signs of support, potentially signaling an upward movement from these levels.

UJJIVANSFB Trading Within Fresh Demand ZoneUJJIVANSFB is currently trading at ₹34, positioned within its demand zone between ₹34.5 and ₹33.55, established on 30th May 2023. This fresh zone has not yet been tested, indicating potential buying interest around these levels. Investors may consider observing this range for signs of support, which could trigger a rebound.

ICICI Bank. Short Swing Below 1200. Targeting 1060.ICICI Bank looks weak on Charts after having Given a Great Run.
Reasons to consider Shorting below 1200
Technicals :
1. Rejection from fresh Weekly Supply Zone established around 1280.
2. Double Top in formation, to complete upon breakdown of 1200
3. Bullish Channel Breakdown
4. Bigger Parallel Channel Resistance Hit at ATH
5. Rsi Bearish Divergence on Daily Timeframe.
6. Breakdown of 50 and 100 DEMA
Options Data : Put Writers around 1250 1200 will unwind, triggering sharp down move.
TP1 : 1170 ( 200DEMA, Minor Demand Zone territory, 1.0 of Trend based extension)
TP2 : 1100 ( Major Demand Zone Territory, Nearing Lower Band of Parallel Channel)
TP3 : 1060 ( Point of Max Pain, Bulls will try to defend this level at any cost, upon failure to defend the 1000 1060 zone, would result in testing of 800)
SL: Weekly Closing above 1260.

BankNifty Intraday Support & Resistance Levels for 18.11.2024On Thursday, BankNifty opened with a gap down, climbed to a high of 50,561.80, and dipped to a low of 49,939.35. It closed at 50,179.55, gaining 91 points over the previous close. The Weekly Trend (50 SMA) remains sideways, while the Daily Trend (50 SMA) is negative.
For two consecutive days, BankNifty has tested the Daily Demand Zone and held support near the 50,000 mark. As highlighted earlier, if this support holds, we could see bullish momentum targeting 50,725 to 51,000 levels.
Demand/Support Zones
Near Support (Daily): 49,654.65 - 49,959.25 (tested twice)
Far Support: 49,282.65 (61.8% FIBO Level)
Extended Support (Daily): 44,633.85 - 45,750.40
Supply/Resistance Zones
Immediate Resistance (15m): 50,725.35 - 50,852.45
Higher Resistance (30m): 51,586.35 - 51,874.70
Major Resistance (Daily): 51,562.70 - 52,493.95

Nifty Intraday Support & Resistance Levels for 18.11.2024On Thursday, Nifty opened with a gap down, touched a high of 23,675.90, and slipped to a low of 23,484.15. It eventually closed at 23,532.70, losing 26 points from the previous close. The Weekly Trend (50 SMA) remains sideways, while the Daily Trend (50 SMA) stays negative.
Notably, Nifty has closed inside the Daily Demand Zone for the second consecutive session. As mentioned earlier, if this support holds, we could witness bullish momentum pushing Nifty toward 23,900 - 24,250 levels.
Demand/Support Zones
Near Support (Daily): 23,350 - 23,667.10 (current price within the zone)
Far Support: 23,189.88 (61.8% FIBO Level)
Extended Support (Daily): 22,642.60 - 22,910.15
Supply/Resistance Zones
Immediate Resistance (30m): 23,908.65 - 23,992.50
Higher Resistance (75m): 24,106.90 - 24,242.00
Major Resistance (75m): 24,447.65 - 24,537.60
Extended Resistance (75m): 24,636.75 - 24,741.45

Gold in buying zone.With better US news results even , Gold prices sustained over previous days low, which clearly shows buyers being accumulated on short term . Seems selling term is over for now and accumulation is ignited.
FX_IDC:XAUUSD
Gold is on rally again as its been 2 weeks now XAUUSD has faced good selling pressure, and profit booking.
We could assume that gold may be rising now and the near term selling pressure is over.

AU Bank On Weekly Demand ZoneNew Study For Paper Trade Au Small Finance Bank
Buying Zone 557-560 (Sorry For Late Sharing Idea)
StopLoss : 550
Target : 600,620,640
Study Logic
👉 Weekly Demand Zone
👉 Weekly Hammer Candlestick Pattern
👉 1D Bullish Harami Candlestick Pattern
👉 52 Week Low Share
👉 Sector Indices Also On Weekly Demand Zone
#Marker Is Weak And Au Small Finance Bank At Distal Risky Study
Only For Paper Trade And Education Purpose Don't Real Trade
I am not sebi Registered Person Post is only for Paper Trade, Practice And Education purpose i am not responsible for any profit and loss.

Nifty Week AheadNSE:NIFTY entered successfully into the correction zone this week breaking 200 EMA.
Marked Major Support and Resistance for Nifty Week Ahead. 50 WEMA Will be Crucial.
Currently Trading Below 200 DEMA, with a P/E of 21.60 down 10.44% from ATH.
📌Thank you for exploring my idea! I hope you found it valuable.
🙏FLLOW for more
👍BOOST if useful
✍️COMMENT Below your views.
Meanwhile, check out my other stock ideas below until this trade is activated. I would love your feedback.
Disclaimer: This analysis is intended solely for informational and educational purposes and should not be interpreted as financial advice. It is advisable to consult a qualified financial advisor or conduct thorough research before making investment decisions.

How moving average works on chartsHello mates sharing a view
How Moving Averages Work
A moving average works by calculating the average price of a security over a specific period of time, and then updating that average as new price data becomes available. The purpose is to help eliminate noise (short-term price fluctuations) to provide a clearer view of the underlying trend.
Types of Moving Averages
Simple Moving Average (SMA)
Definition: The most basic type of moving average. It is calculated by taking the arithmetic mean of a security’s price over a specified number of periods.
Formula:
SMA=Sum of closing prices over a periodNumber of periods
SMA=Number of periodsSum of closing prices over a period
Example: A 10-period SMA adds up the last 10 closing prices and divides by 10. As each new closing price comes in, the oldest price is dropped, and the new price is added.
Use: The SMA smooths out price data and provides a basic view of the average price over the chosen period.
Exponential Moving Average (EMA)
Definition: A more sophisticated type of moving average that gives more weight to recent prices, making it more responsive to price changes compared to the SMA.
Formula: The calculation is more complex than the SMA but it’s designed to give more emphasis on the latest price data.
Use: The EMA is often preferred in volatile markets because it reacts more quickly to price movements, providing more timely signals.
Weighted Moving Average (WMA)
Definition: Similar to the EMA but with a simpler calculation. It assigns a specific weight to each data point, with more weight placed on the more recent prices.
Use: Like the EMA, the WMA is more sensitive to recent price changes compared to the SMA.
Common Periods for Moving Averages
Short-Term (Fast) MAs: 9, 10, 20 periods (e.g., 10-day or 20-day SMA or EMA)
Medium-Term MAs: 50 periods (e.g., 50-day SMA or EMA)
Long-Term (Slow) MAs: 100, 200 periods (e.g., 200-day SMA or EMA)
Key Uses of Moving Averages
Trend Identification
Uptrend: When the price is above the moving average, it signals an uptrend.
Downtrend: When the price is below the moving average, it signals a downtrend.
Sideways (Neutral) Trend: When the price moves sideways and stays close to the moving average, this indicates no clear trend.
Support and Resistance Levels
Moving averages can act as dynamic support and resistance levels. In an uptrend, the price might repeatedly bounce off a moving average, using it as support. In a downtrend, the moving average might act as resistance.
For example, in a strong uptrend, the 50-day or 200-day moving average might act as a support level, where price tends to pull back to and then bounce up again.
Crossovers (Golden and Death Crosses)
Golden Cross: A bullish signal occurs when a short-term moving average (like the 50-day SMA) crosses above a long-term moving average (like the 200-day SMA). This is seen as a confirmation of an uptrend.
Death Cross: A bearish signal occurs when a short-term moving average crosses below a long-term moving average. This is seen as a confirmation of a downtrend.
Momentum and Buy/Sell Signals
When the price crosses above a moving average: This is often considered a bullish signal, suggesting that an upward trend could be starting.
When the price crosses below a moving average: This is typically a bearish signal, suggesting a potential downward trend.
Smoothing Volatility
By averaging out price data over a set period, moving averages help reduce the "noise" of daily price fluctuations and provide a clearer view of the overall trend.
How to Use Moving Averages in Charts
Plotting Moving Averages: On most charting platforms, you can easily overlay a moving average by selecting the tool from the indicators list and choosing the period (e.g., 50-day or 200-day).
Adjust the Time Period: You can experiment with different time periods to adjust the sensitivity of the moving average. Shorter periods (e.g., 10-day) react faster to price changes, while longer periods (e.g., 200-day) provide a smoother, slower-moving trend line.
Example of Using Moving Averages
Trend Confirmation:
If the price is consistently above the 50-day moving average, the market is likely in an uptrend, and you might look for buy opportunities.
If the price is consistently below the 50-day moving average, the market is in a downtrend, and you might look for sell opportunities.
Golden Cross (Bullish Signal):
Suppose the 50-day SMA crosses above the 200-day SMA — this is the "Golden Cross," a classic signal that suggests the start of a strong uptrend. Traders may start looking for long (buy) positions.
Death Cross (Bearish Signal):
Conversely, if the 50-day SMA crosses below the 200-day SMA, it forms a "Death Cross," signaling a potential downtrend, and traders may look for short (sell) opportunities.
Using Moving Averages as Support/Resistance:
In an uptrend, the price might pull back toward the 50-day moving average and then bounce back up. This makes the 50-day MA act as a dynamic support level.
In a downtrend, the price might approach the 50-day MA and then reverse downward. This makes the 50-day MA act as a resistance level.

How to draw support and resistance level on chart1. Identify the Trend
Support: This is the price level where a downtrend can pause or reverse. It occurs when buyers are expected to step in and push the price upward.
Resistance: This is the price level where an uptrend can pause or reverse. It occurs when sellers are expected to step in and push the price downward.
Key tip: The more times the price touches a particular level and reverses, the stronger the support or resistance.
2. Locate Significant Highs and Lows
Support: Look for the lowest points where the price has previously bounced. These are the bottoms where price failed to drop further.
Resistance: Look for the highest points where the price has previously been unable to break through. These are the tops where price failed to rise further.
Key tip: You want to find significant turning points — areas where price made a sharp reversal.
3. Use Horizontal Lines to Mark Levels
Support: Draw a horizontal line along the most recent low or lows where price reversed or consolidated. This will mark the support zone.
Resistance: Draw a horizontal line along the most recent high or highs where price reversed or faced rejection. This will mark the resistance zone.
Key tip: You can use multiple points to validate a support or resistance level. If a price has touched and reversed at the same level multiple times, it becomes more reliable.
4. Adjust for Areas (Zones, Not Just Exact Price Points)
Often, support and resistance are not exact price points but zones where price action tends to cluster. For example, if a stock often bounces between $100 and $105, you might draw a support level around $100-105 rather than at one specific price.
Key tip: Consider the range of price movement around these levels. Drawing the lines as zones can provide more flexibility for trading.
5. Look for Volume Confirmation
High trading volume near a support or resistance level adds strength to the level. A breakout or breakdown accompanied by high volume suggests that the level is more significant.
Key tip: Pay attention to volume spikes when the price approaches key support or resistance levels. This may indicate that a breakout or breakdown is imminent.
6. Dynamic Support and Resistance
These levels are not always static. Trends can create dynamic support (in uptrends) or dynamic resistance (in downtrends), where support or resistance is aligned with trendlines or moving averages.
Key tip: In trending markets, you can use tools like trendlines or moving averages (like the 50-day or 200-day moving average) to spot dynamic support and resistance.
7. Check for Price Patterns
Price patterns such as triangles, channels, or head-and-shoulders can also help you identify key support and resistance zones.

NIFTY View Bounce and Break !Hello mates sharing a view on Nifty on weekly time frame, So as we can see that after a good correction form all time highs now price reached to weekly support level.
NOTE- Only for Education Purpose. This is not any kind of Trading advice I am giving by this analysis.
NOTE : This is my pre market analysis and my trading journal. Not a suggestion to buy or sell.
I will try my best to update this publication for a bounce or a break too stay tuned.
Hope you like my idea, Thanks in advance.

EURGBP - TRADE IDEA ON LONG SIDE FOR HUGE PROFITSymbol - EURGBP
EURGBP is currently trading at 0.8272
I'm seeing a trading opportunity on buy side.
Buying EURGBP pair at CMP 0.8272
I will be adding more if 0.8245 comes & will hold with SL 0.8225
Targets I'm expecting are 0.8345 - 0.8370 & above.
Disclaimer - Do not consider this as a buy/sell recommendation. I'm sharing my analysis & my trading position. You can track it for educational purposes. Thanks!

US DOLLAR INDEX - TRADE IDEA ON SHORT SIDESymbol - DXY
DXY is currently trading at 105.57
My reversal setup has formed in DXY & I'm seeing a trading opportunity on sell side.
Shorting DXY at CMP 105.57
I will add more position if 106.00 comes & will hold with SL 106.30
Targets I'm expecting are 104.75 - 104.30 - 103.73 & below.
Disclaimer - Do not consider this as a buy/sell recommendation. I'm sharing my analysis & my trading position. You can track it for educational purposes. Thanks!

XAU USD ANALYSIS Hello Traders,
I hope you are doing well and earning some money from the Market 🤝
Market tapped into 1 HR order flow and started reacting I am selling gold for the target of 2540-2536 with very small risk of 0.50% of my account balance.
Let's see what happens Next 📉

Nifty levels - Nov 18, 2024Nifty support and resistance levels are valuable tools for making informed trading decisions, specifically when combined with the analysis of 5-minute timeframe candlesticks and VWAP. By closely monitoring these levels and observing the price movements within this timeframe, traders can enhance the accuracy of their entry and exit points. It is important to bear in mind that support and resistance levels are not fixed, and they can change over time as market conditions evolve.
The dashed lines on the chart indicate the reaction levels, serving as additional points of significance to consider. Furthermore, take note of the response at the levels of the High, Low, and Close values from the day prior.
We hope you find this information beneficial in your trading endeavors.
* If you found the idea appealing, kindly tap the Boost icon located below the chart. We encourage you to share your thoughts and comments regarding it.
Wishing you success in your trading activities!

BankNifty levels - Nov 18, 2024Utilizing the support and resistance levels of BankNifty, along with the 5-minute timeframe candlesticks and VWAP, can enhance the precision of trade entries and exits on or near these levels. It is crucial to recognize that these levels are not static, and they undergo alterations as market dynamics evolve.
The dashed lines on the chart indicate the reaction levels, serving as additional points of significance. Furthermore, take note of the response at the levels of the High, Low, and Close values from the day prior.
We trust that this information proves valuable to you.
* If you found the idea appealing, kindly tap the Boost icon located below the chart. We encourage you to share your thoughts and comments regarding it.
Wishing you successful trading endeavors!

Gold Takes a Breather.. Retracement or Reversal?Price action between 2600 and 2750 will decide future of Gold, Whether it will continue to remain bullish or Witness a healthy correction.
Below 2750, 2600 will remain a decent possibility.
Sustaining Below 2600 will open Doors to 2400.
See You out of the Range Again
