FOXCONN of India - A overlook on DIXON TECHNSE:DIXON
Hey Folks,
Today we are talking about Dixon Technologies aka foxconn of India. the Q3 results shows +68% in PAT. which looks good as headline numbers. but diving deep I found that Dixon tech slides over a thin margin module as it is high-volume producer to marquee clients and that operating margin didn't show up as good as the other metrics, which seems attractive.
So, considering current geopolitics any slight hike in raw material could easily affect the operating cost thus affect on the profits.
But Yesterday, we found out the US INDIA Trade Deal out of blue which likely seemed to give more edge to the company in the export service. also the New budget aligns in favour with the manufacturing sector, that's also likely to give certain edge if the company keep the capital expenditure in check with the expectation to the last quarter.
Now, looking technically for long term perspective on the weekly chart. it has sustained above the 200EMA with a large green candle today. Also it closed above the last key support of 10650 (horizontal line in the chart). next target is the 0.78 level of fib i.e. 11700 to tackle. if it breaks that finds it fair value above that zone. we might see the new high of DIXON in near future.
I do not complicate much in technicals for long term view. So open to discussion how you look at it.
:) Thanks. Happy trading.
Support

HAVELLS – Sitting at a Crucial Trendline Support✅ Bullish Scenario (Bounce Trade)
If the trendline holds, watch for a strong bullish confirmation such as a hammer or bullish engulfing candle with volume.
Trade Plan:
• Enter above the confirmation candle
• Stop Loss below the trendline
⚠️ Bearish Scenario (Breakdown Trade)
If price breaks the trendline decisively, avoid rushing into the trade.
Trade Plan:
• Wait for breakdown + pullback to the trendline
• Consider entry after rejection from the retest
• Stop Loss above the pullback high

Reading Price action and Candlesticks like a PROI make educational content videos for Trading
In this video I have used charts older than 3 months to share my experience in the markets by sharing my thinking and chart skills - I hope you will learn something out of it

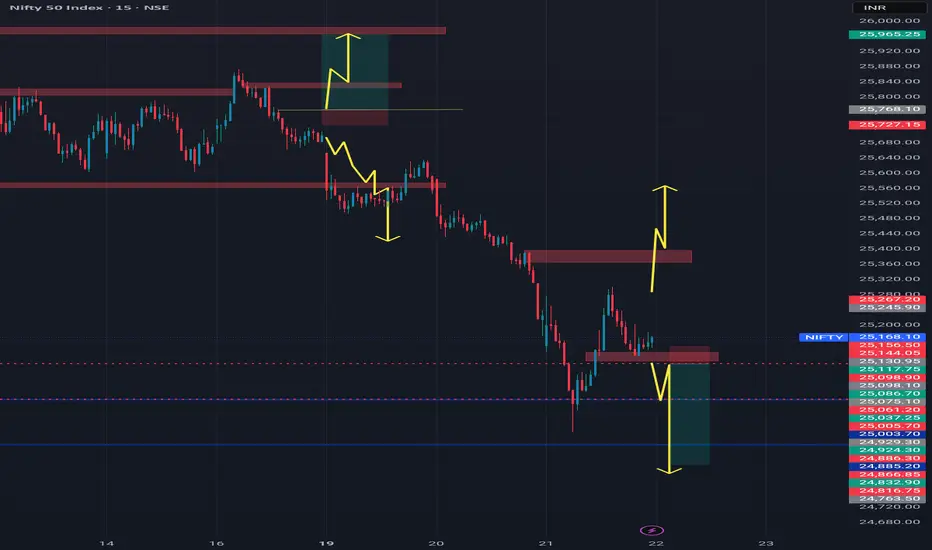
NiftyNifty has attempted multiple recoveries after the fall, consistently taking support near the 25100 level. If the index opens with a gap down below 25100 and forms a strong bearish candle, a further downside move towards 24750 can be expected. A bullish move is likely only after a decisive break above 25400. Until then price action remain sideways within the 25300-25100 range.
Buy in deep Opportunity SCIShipping Corporation of India Ltd presents a compelling mid-term buy opportunity near the critical 204 support, reinforced by a double bottom pattern on the daily chart. As a government-owned PSU in the booming shipping sector, it benefits from rising global trade volumes and India's maritime growth, trading at a fair P/E of ~12 amid recent corrections.
The chart confirms a double bottom at ~204, with bullish divergence in RSI/MACD oscillators signaling exhaustion of sellers. Key support holds at 200-204 (200-SMA nearby), while resistance eyes 215-220; a break above 211 could target 230-250 in 4-8 weeks. Oversold RSI (<20) and rising volume on lows support reversal potential.
SCI maintains robust ~30% OPM consistently, driven by fleet modernization and demand in crude tankers/container segments amid global trade recovery. At ₹205 (P/E 12.2x, P/B 1.16x), valuation corrects to fair levels vs. sector averages; dividend yield ~3% adds appeal. Govt backing ensures stability in expanding markets like LNG and offshore services.
Deep correction (-45% from all time highs) aligns with sector rotation; entry 200-205 with SL as per risk capacity, targeting 250 and more upside.
Better to take view for buy and hold for long term

BHARTIARTL (Airtel) – Daily Chart | Simple Long SetupBharti Airtel is currently pulling back after a strong up-move and has reached an important support area. Price is also near an upward trendline, which often acts as support.
🔹 Trend: Overall trend is up
🔹 Support Zone: Marked grey area
🔹 Entry Idea: Buy if price holds above support
🔹 Stop Loss: Below the red zone (support break)
🔹 Target: Previous highs / upper green area
📌 Why this setup makes sense (simple):
Price is in an uptrend
It came down to a support level
Trendline support is also present
Risk is small compared to reward
📈 If the price stays above support, it can move higher again.
⚠️ If it breaks and closes below support, avoid the trade.
💡 For learning purpose only. Always use stop loss.

Banknifty 15min TrendlineOn the 15-minute timeframe, Bank Nifty is forming a rising support trend line. Price is repeatedly taking support near this line, showing buying interest at lower levels. As long as this support holds, the short-term structure remains positive. A break below this support line may lead to quick downside, while holding above it can support a bounce or continuation move.

How much Contraction is Enough? Naukri Support Buy NSE:NAUKRI
Many participants are Getting frustrated of this range'cause you see they are not able to make any money if they're holding this stock.
Day by day the contraction in this range is getting narrower, and every time It moves down to the support area, the range low it forms a very bullish pin bar kind of pattern.
Currently, it is forming a pin bar, but the candle is not yet closed. Therefore, we need to wait for the candle to close, as this indicates a bullish pin bar. On the next day, we can take a very good entry.
Keep Learning,
Happy Trading.

Inox Wind | Potential Reversal from 200 EMA Support (Study)Inox Wind is currently trading near its 200 EMA, which is acting as a strong long-term support zone on the weekly chart.
Key observations:
Price is respecting 200 EMA support
Formation of a falling trendline — breakout above it can change structure
Selling pressure looks exhausted near support
Risk–reward looks favorable at current levels
If price holds above the 200 EMA and shows confirmation, this could lead to a trend reversal with opportunities for short-term to long-term upside.
Levels to Watch
📍 Support: 200 EMA zone
📈 Immediate Resistance: Trendline breakout area
🎯 Upside Targets (if breakout sustains):
₹158
₹199
₹257 (long-term view)
Note / Disclaimer
⚠️ This is only a technical study, not a buy or sell recommendation.
Please do your own research and manage risk properly.

AlbertDavid - At supportsCMP 752.70 on 05.01.26
All important levels are marked on the chart. The stock price is on the 5-year-old support levels. If it bounces from these levels, it may go into a bullish phase. Possible targets may be 900/1000/1100, and even more, depending on forthcoming parameters.
The setup fails if the price sustains below the 720-710 levels.
The risk-reward ratio is quite good at the moment.
One must determine the position size according to the risk capacity. Always keep your stop-loss confirmed.
All these illustrations are only for educational and learning purposes, it should not be considered as a buy or sell recommendation. Please do your research before any trade or consult your financial advisor.
All the best.

BUY TODAY SELL TOMORROW for 5%DON’T HAVE TIME TO MANAGE YOUR TRADES?
- Take BTST trades at 3:25 pm every day
- Try to exit by taking 4-7% profit of each trade
- SL can also be maintained as closing below the low of the breakout candle
Now, why do I prefer BTST over swing trades? The primary reason is that I have observed that 90% of the stocks give most of the movement in just 1-2 days and the rest of the time they either consolidate or fall
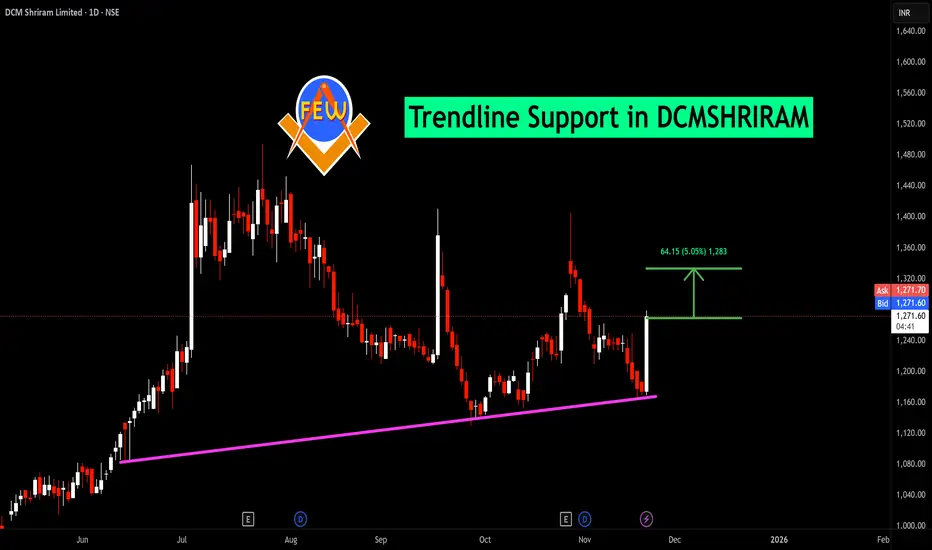
Trendline Support in DCMSHRIRAM
BUY TODAY SELL TOMORROW for 5%
Kalyan Jewellers Bullish SetupKalyan Jewellers
F&O Segment Stock
The stock fell almost 50% from its high of about ₹783 in September 2024. But now it's finding good support, building a base, and moving inside a parallel channel. For the past year, it's been stuck in a range—which usually means a bigger move is getting ready (could be a channel, triangle, or some other pattern).
Here's why I'm positive about it:
It's holding strong at the channel's lower support line.
It's sitting right on key moving averages (EMA support).
There was a big jump in trading volume near the support zone, which shows real buyers stepping in.
The chart shows a few resistance levels above—these can become price targets if the stock breaks out.
For safety, keep your stop loss at the previous major low for capital protection.
Trade wisely.

ABBABB is completed its correction and ready to make a all time high again.
There will be breakout soon above trend-line.
Above 5480, we can see sharp upside rally and all target will hit one by one.
Good to accumulate on every dipper level and hold for the long time to gain good returns.

Inverse head and shoulder formed in reddington1. Inverse head and shoulder formation on Support levels showing buyers will take control from here
2. With minimum downside one can watch for long upside movement shown as target zone on charts
3. The strong movement has shown after result which tells us if movement continues then target may come soon
4. SL is strict as if move fails then not giving chance to get trapped

BSE Ltd TargetsThe Recent expected Targets from BSE Ltd can be set at 3135 and 3438. If the stock hits resistance at this level then the support levels of this stock can be 2710 and 2600. Held this stock even when it hit lows in Aug and Sept as RSI indicated a reversal and it paid off.

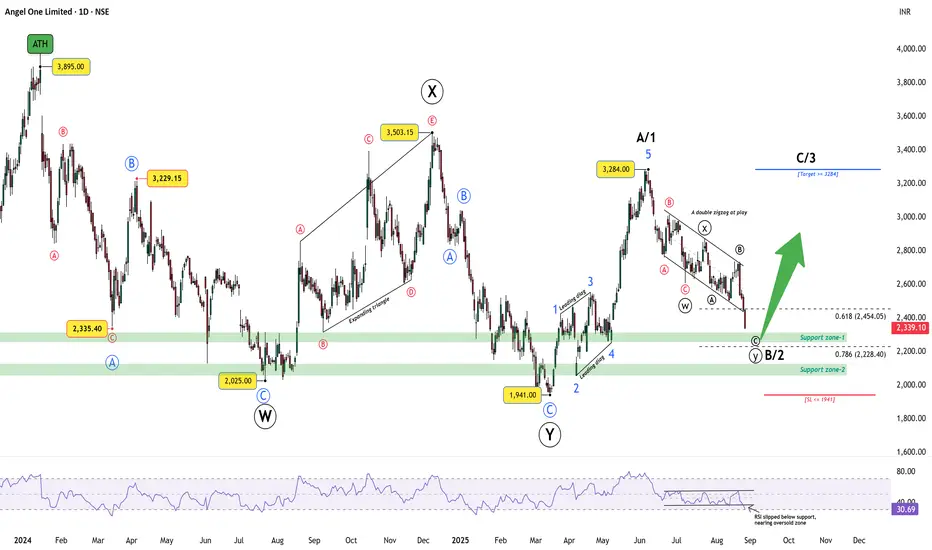
Angel One: Corrective pattern aligning for bounceAngel One topped at an all-time high of 3895 before entering a corrective phase. The decline into 2025 marked Wave W, followed by a rally into 3503 as Wave X, and then a fall to 1941 completing Wave Y. From there, the stock advanced to 3284, counted as Wave A/1 with a leading diagonal.
The decline since 3284 has unfolded as a double zigzag (W–X–Y) within a parallel bearish channel. Wave Y is testing key supports at 2454 (0.618 Fib) and 2228 (0.786 Fib). RSI is near the oversold band around 30, setting up the possibility of bullish divergence if price makes a marginal new low. The bullish view remains valid above 1941; a close below this level invalidates the count.
Trade Plan:
Bias: Expecting Wave B/2 to complete around 2228
Trigger: Watch for bullish divergence or reversal candles near support
Target: A break above 3284 would confirm Wave C/3
Risk: Stop loss at 1941
Disclaimer: This analysis is for educational purposes only and does not constitute investment advice. Please do your own research (DYOR) before making any trading decisions.
BORORENEW Trade plan for 1:23 RR1. Market Trend - Bullish
2. Stock - Under consolidation
3. Price Trading at support
4. Risk is small & reward is way to good
5. Trade set up - Buy at support and sell or book at resistance
6. Every resistance, is your partial profit booking area or bringing SL at Break even

Part 2 How to Draw Accurate Support and Resistance LevelsParticipants in Option Trading
There are four primary participants in the options market:
Buyer of Call Option (Long Call) – Expects the price to rise.
Seller of Call Option (Short Call) – Expects the price to fall or remain flat.
Buyer of Put Option (Long Put) – Expects the price to fall.
Seller of Put Option (Short Put) – Expects the price to rise or remain flat.
Each participant has a specific risk-reward profile. Option buyers have limited risk (the premium paid) and unlimited profit potential. Option sellers, on the other hand, have limited profit (premium received) but potentially unlimited risk.

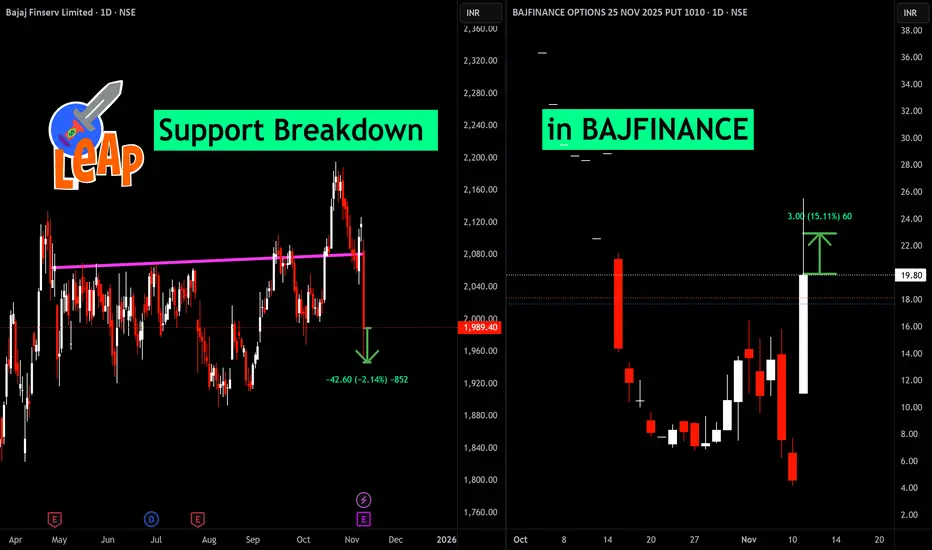
Support Breakdown in BAJFINANCEBajaj Finserv broke key support, triggering a sharp 2% drop and bearish momentum. This led to a strong move in Bajaj Finance PUT options, which surged 15%, reflecting aggressive downside hedging and trading interest. Watch for further volatility and trading opportunities following this breakdown
B
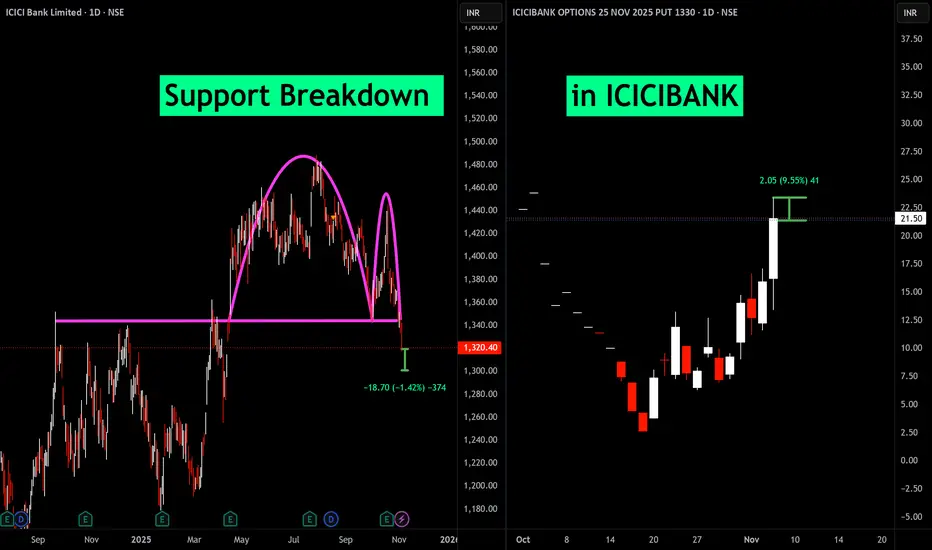
Support Breakdown in ICICIBANKThe breakdown of a key support level typically signals that sellers have gained control over the stock, which often leads to further declines.
The chart shows ICICI Bank's daily price slipping below strong support, which traders watch carefully to time short or protective put option trades.
Buying puts here benefits from the falling stock price causing put premiums to rise.
The suggested profit targets and stop-loss levels are based on technical price levels derived from the previous support turned resistance and the magnitude of the breakdown move.
This trade idea is best suited for traders comfortable with short-term bearish plays using direct short selling or options strategies that capitalize on falling prices.
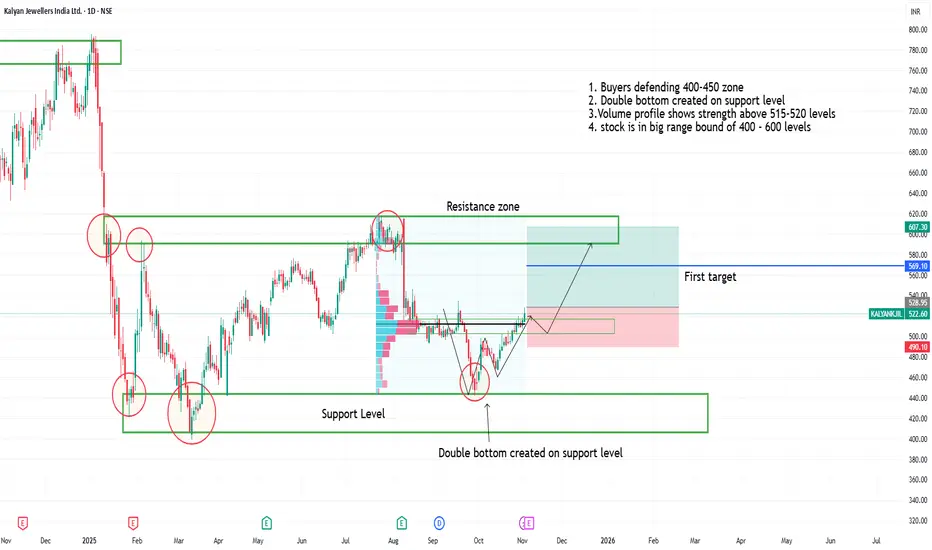
Double bottom in kalyan jwellers on support level1. Buyers defending 400-450 zone
2. Double bottom created on support level
3.Volume profile shows strength above 515-520 levels
4. stock is in big range bound of 400 - 600 levels
5. One can watch for upside movement
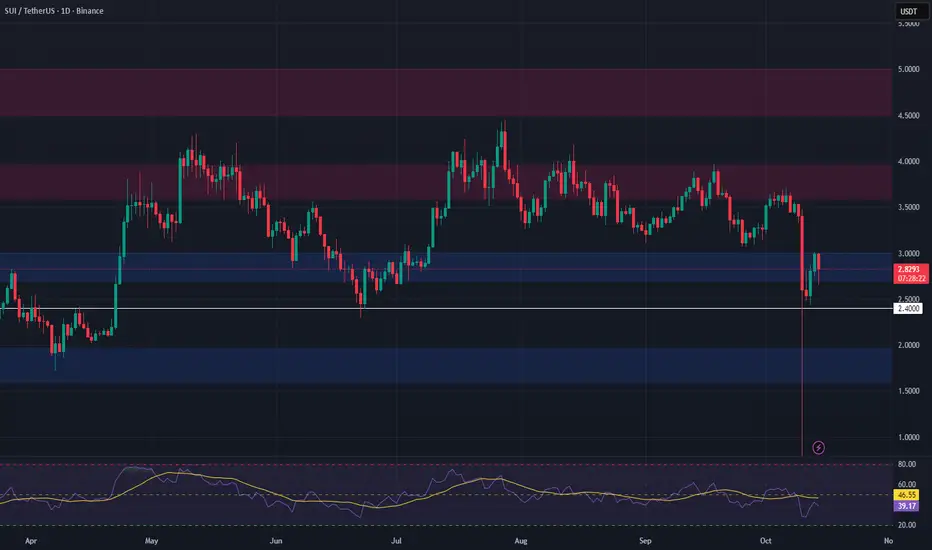
SUI – Swing Trade Setup from Key Support ZoneSUI is currently trading in a major support zone between $2.70 and $3.00, a level that has previously acted as a strong demand area. The price is consolidating here, and this could offer a high-probability long opportunity for swing traders watching for a potential bounce.
📈 Entry Zone: $2.70 – $3.00
🎯 Take Profit Targets:
• TP1: $3.60 – $3.95
• TP2: $4.50 – $5.45
🛑 Stop Loss: $2.40
ALGO Swing Trade Setup — Support Bounce OpportunityWe see a strong support zone forming around $0.186 – $0.195, which has been tested multiple times in the past. This area is acting as a potential springboard for a bullish reversal.
If price respects this zone, we may see momentum carry ALGO upward toward key resistance areas.
Entry Zone: $0.186 – $0.195
Target 1: $0.225 – $0.26
Target 2: $0.285 – $0.33
Stop Loss: Just below $0.18, invalidating the setup if price breaks lower
