GIFTNIFTY Intra-Swing Level Analysis for 16th FEB 2026GIFTNIFTY Intra-Swing Level Analysis for 16th FEB 2026
🚀Follow & Compare NIFTY spot Post for Taking Trade
━━━━━━━━━₹₹₹₹₹₹₹₹₹₹₹₹━━━━━━━━
⚪Weekly PCR Analysis:
17 Feb 2026 EXP. Weekly Basis =>
PCR: 0.66 Trend Strength: 🛑 Bearish.
Intraday Change in Weekly Basis Data =>
Change OI PCR: 2.285. Trend Strength: 🛑 BULLISH.
━━━━━━━━━₹₹₹₹₹₹₹₹₹₹₹₹━━━━━━━━
💥Level Interpretation / description:
L#1: If the candle crossed & stays above the “Buy Gen”, it is treated / considered as Bullish bias.
L#2: Possibility / Probability of REVERSAL near RLB#1 & UBTgt
L#3: If the candle stays above “Sell Gen” but below “Buy Gen”, it is treated / considered as Sidewise. Aggressive Traders can take Long position near “Sell Gen” either retesting or crossed from Below & vice-versa i.e. can take Short position near “Buy Gen” either retesting or crossed downward from Above.
L#4: If the candle crossed & stays below the “Sell Gen”, it is treated / considered a Bearish bias.
L#5: Possibility / Probability of REVERSAL near RLS#1 & USTgt
HZB (Buy side) & HZS (Sell side) => Hurdle Zone,
*** Specialty of “HZB#1, HZB#2 HZS#1 & HZS#2” is Sidewise (behaviour in Nature)
Rest Plotted and Mentioned on Chart
Color code Used:
Green =. Positive bias.
Red =. Negative bias.
RED in Between Green means Trend Finder / Momentum Change
/ CYCLE Change and Vice Versa.
Notice One thing: HOW LEVELS are Working.
Use any Momentum Indicator / Oscillator or as you "USED to" to Take entry.
━━━━━━━━━━━━━━━━━━━━━━━━━━━━━━━━━━━━━━━━━━━
⚠️ DISCLAIMER:
The information, views, and ideas shared here are purely for educational and informational purposes only. They are not intended as investment advice or a recommendation to buy, sell, or hold any financial instruments. I am not a SEBI-registered financial adviser.
Trading and investing in the stock market involves risk, and you should do your own research and analysis. You are solely responsible for any decisions made based on this research.
"As HARD EARNED MONEY IS YOUR's, So DECISION SHOULD HAVE TO BE YOUR's".
━━━━━━━━━━━━━━━━━━━━━━━━━━━━━━━━━
❇️ Follow notification about periodical View
💥 Do Comment for Stock WEEKLY Level Analysis.🚀
📊 Do you agree with this view?
✈️ HIT THE PLANE ICON if this technical observation resonates with you. It will Motivate me.
━━━━━━━━━━━━━━━━━━━━━━━━━━━━━━━━━
💡 If You LOOKING any CHART & want for Level and ANALYZE?
Share your desired stock names in the comments below! I will try to analyze the chart Levels, patterns and share my technical view (so far my Knowledge).
If Viewers think It can identify meaningful setups. Looking forward to hearing from all of you — let's keep this discussion going and help each other make better trading decisions.________________^^^^^^^^^^^^^^^^_________________
🔕🟥🟧🟨🟩🟦🟪⬛🔴🟠🟡🟢🔵🟣⚫⚪🔺🔻
Support and Resistance

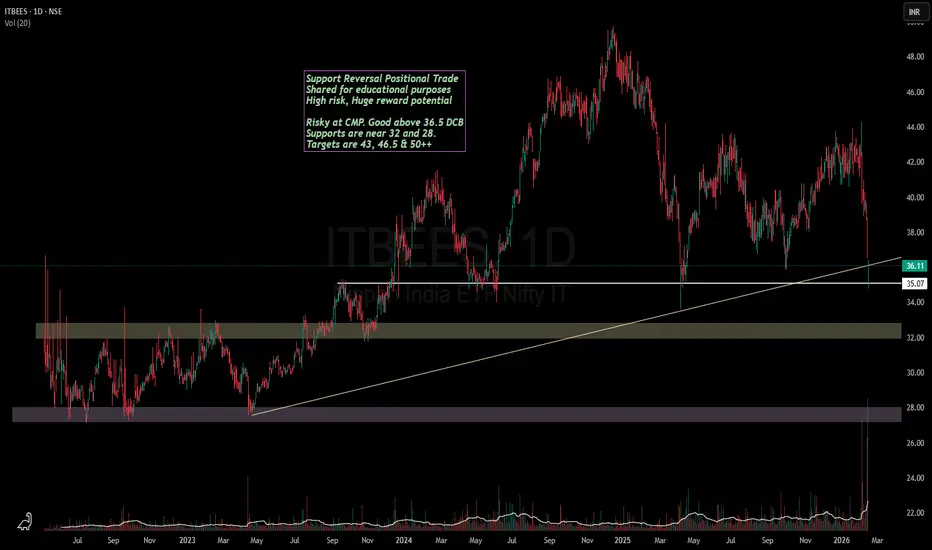
Investing:Nifty IT is looking good for long term accumulation!If you have been following the tech related news lately, it has been about the new AI "revolutionary" tool named Anthropic.
And the same is visible on charts of Nifty IT.
TCS is available at a price at which it was trading in December 2020.
Infy has just broke a crucial support.
Wipro has always been the weakest of 3.
So what next?
My opinion is that the fall is now almost in the end stage. The accumulation has already started on Friday as we have seen some good recovery by end of the day.
However, A SL hunting move near 32-34 zone might come as a formation of a lower low with RSI divergence in Nifty ITBEES which is where one needs to be careful.
We might also see some rebalancing & restructuring in IT index soon. However, these large companies are operating since past many decades and are here to stay at least for a few more.
These are the kind of dips which should be mouth watering for long term investors as the valuations are now dirty cheap.
The levels which i mentioned are my personal opinion shared for educational purposes and should not be considered as a recommendation.
Nifty - Expiry day analysis Feb 17The price is between the important zone(gap) 25650 and 25750. Once this gap is filled, the price has to decide the trend direction.
The past few days' price movement has formed an inverted head-and-shoulder pattern. And the price gave the movement to fill the gap.
Buy above 25640 with the stop loss of 25580 for the targets 25680, 25720, 25780, 25820 and 25860.
Sell below 25480 with the stop loss of 25530 for the targets 25440, 25400, 25360, 25300 and 25260.
Expected expiry day range is 25500 to 25900.
Always do your analysis before taking any trade.

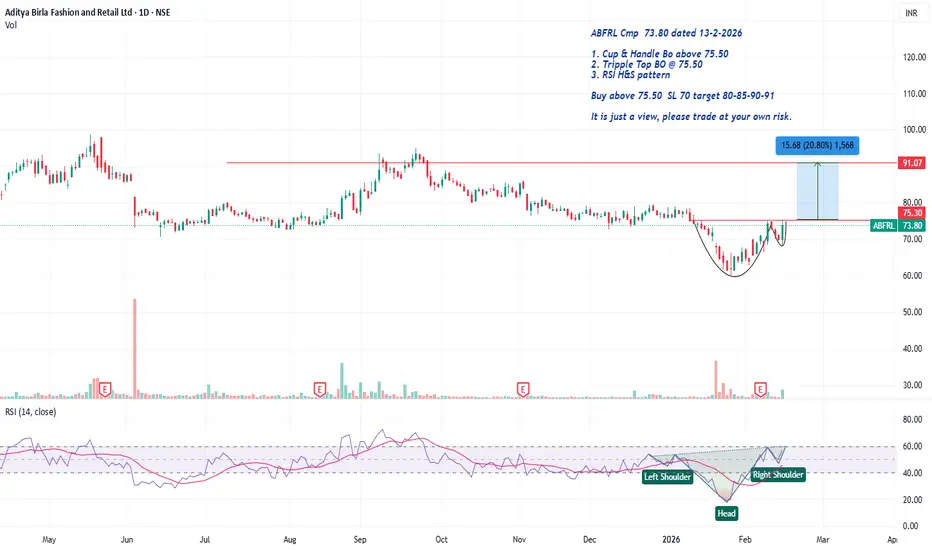
ABFRL Cmp 73.80 Cup & Handle BoABFRL Cmp 73.80 dated 13-2-2026
1. Cup & Handle Bo above 75.50
2. Tripple Top BO @ 75.50
3. RSI H&S pattern
Buy above 75.50 SL 70 target 80-85-90-91
It is just a view, please trade at your own risk.
NIFTY Scalping / Short Range Level Analysis for 17th FEB 2026NIFTY Scalping / Short Range Level Analysis for 17th FEB 2026
━━━━━━━━━₹₹₹₹₹₹₹₹₹₹₹₹━━━━━━━━
⚪Weekly PCR Analysis:
17 Feb 2026 EXP. Weekly Basis =>
Put OI: 30,07,563, Call OI: 28,22,123, PCR: 1.07. Trend Strength: ⚪NEUTRAL.
Intraday Change in Weekly Basis Data =>
Put OI Change: 12,12,597,Call OI Change: -11,45,868, Change OI PCR: -1.06. Trend Strength: ⚪NEUTRAL.
🟣FEB EXP. Monthly PCR Analysis:
Put OI: 10,98,791, Call OI: 11,27,430, PCR: 0.97. Trend Strength: ⚪NEUTRAL.
Intraday Change in Monthly Basis Data =>
Put OI Change: -2,24,033, Call OI Change: -12,76,400, Change OI PCR: 0.18. Trend Strength: 🔴 Bearish.
━━━━━━━━━₹₹₹₹₹₹₹₹₹₹₹₹━━━━━━━━
Some Technical Parameter:
🛑 VWap vs Price: Price Below.
🟢 Rsi(14): 50.87
🟡 Stoch Rsi(14): 62.79, 61.15 (Down but Neutral though Bearish Cross Over)
🟢 MACD Bias (12,26): 13.81 (Bullish)
🟡 Williams %R: -37.21 (Perfect Reversal Point Near -80)
🟠 ROC: 1.34
Time Frame basis Trend:
🟢1 Min: Bear, 🟢5 Min: Bear, 🟢15 Min: Bear, 🟢30 Min: Bear, 🛑1 Hour Bear,
🛑2 Hour: Bear, 🟢4 Hour: Bullish, 🟢Daily : Bullish, 🟢Weekly: : Bullish, 🟢Monthly: Bullish.
━━━━━━━━━₹₹₹₹₹₹₹₹₹₹₹₹━━━━━━━━
MA (Moving Averages) Analysis:
⬛Period - 🟨SMA - 🟦EMA
🟥 MA 9 - 25758.87 - 🟩 25679.28
🟩 MA 20 - 25472.87 - 25635.14
🟥 MA 50 - 25765.06 - 🟩 25677.64
🟩 MA 100 - 25688.76 - 25583.76
🟩 MA 200 - 25299.65 - 25220.75
━━━━━━━━━₹₹₹₹₹₹₹₹₹₹₹₹━━━━━━━━
👇🏼Screenshot of NIFTY Spot All-day(16th FEB 2026) in 5 min TF with perodical update.
🚀Follow GIFTNIFTY Post for NF levels
━━━━━━━━━₹₹₹₹₹₹₹₹₹₹₹₹━━━━━━━━
💥Level Interpretation / description:
L#1: If the candle crossed & stays above the “Buy Gen”, it is treated / considered as Bullish bias.
L#2: Possibility / Probability of REVERSAL near RLB#1 & UBTgt
L#3: If the candle stays above “Sell Gen” but below “Buy Gen”, it is treated / considered as Sidewise. Aggressive Traders can take Long position near “Sell Gen” either retesting or crossed from Below & vice-versa i.e. can take Short position near “Buy Gen” either retesting or crossed downward from Above.
L#4: If the candle crossed & stays below the “Sell Gen”, it is treated / considered a Bearish bias.
L#5: Possibility / Probability of REVERSAL near RLS#1 & USTgt
HZB (Buy side) & HZS (Sell side) => Hurdle Zone,
*** Specialty of “HZB#1, HZB#2 HZS#1 & HZS#2” is Sidewise (behaviour in Nature)
Rest Plotted and Mentioned on Chart
Color code Used:
Green =. Positive bias.
Red =. Negative bias.
RED in Between Green means Trend Finder / Momentum Change
/ CYCLE Change and Vice Versa.
Notice One thing: HOW LEVELS are Working.
Use any Momentum Indicator / Oscillator or as you "USED to" to Take entry.
━━━━━━━━━━━━━━━━━━━━━━━━━━━━━━━━━━━━━━━━━━━
⚠️ DISCLAIMER:
The information, views, and ideas shared here are purely for educational and informational purposes only. They are not intended as investment advice or a recommendation to buy, sell, or hold any financial instruments. I am not a SEBI-registered financial adviser.
Trading and investing in the stock market involves risk, and you should do your own research and analysis. You are solely responsible for any decisions made based on this research.
"🔔As HARD EARNED MONEY IS YOUR's, So DECISION SHOULD HAVE TO BE YOUR's".
━━━━━━━━━━━━━━━━━━━━━━━━━━━━━━━━━
❇️ Follow notification about periodical View
💥 Do Comment for Stock WEEKLY Level Analysis.🚀
📊 Do you agree with this view?
✈️ HIT THE PLANE ICON if this technical observation resonates with you. It will Motivate me.
━━━━━━━━━━━━━━━━━━━━━━━━━━━━━━━━━
💡 If You LOOKING any CHART & want for Level and ANALYZE?
Share your desired stock names in the comments below! I will try to analyze the chart Levels, patterns and share my technical view (so far my Knowledge).
If Viewers think It can identify meaningful setups. Looking forward to hearing from all of you — let's keep this discussion going and help each other make better trading decisions.________________^^^^^^^^^^^^^^^^_________________

Sensex - Weekly review Feb 16 to Feb 20The price is between the resistance at 83k and the support at the 81700 zone. The gap towards the 81700 zone will get filled if the price gets more bearish. In the daily chart, there is a trend line support at the 81700 zone.
If the price opens flat, buy above 82620 with the stop loss of 82500 for the targets 82740, 82860, 82980, 83120, 83280, 83400, 83540 and 83760.
Sell below 82400 with the stop loss of 82540 for the targets 82280, 82140, 82020, 81840, 81700 and 81540.
Please always do your analysis before you take any trade.

Hindustan Zinc (1H): Clean Zigzag – Bounce Incoming?From 732.70 to 543.55 as blue (A):
Clear sharp fall. Strong selling. RSI went deep into oversold zone. Looks like a completed higher-degree wave (A).
From 543.55 to 643.20 as black (a):
The bounce from the lows moved in a proper five-wave structure. It did not look random. Structure supports it being wave (a).
From 643.20 to 582.60 as black (b):
This correction unfolded as a clean zigzag. Inside this, red wave c matched almost 100% of red wave a measured from red wave b. That kind of symmetry is typical in zigzags and strengthens the count.
As long as 583.30 holds, black wave (c) can move higher, possibly towards the 660–665 zone. That area is the 0.618 retracement of the entire blue (A) fall.
But this upside, if it comes, may still be corrective before a larger blue (C) move down.
583.30 is important support.
Disclaimer: This analysis is for educational purposes only and does not constitute investment advice. Please do your own research (DYOR) before making any trading decisions.

NIFTY Rejection Zone at 25515–25535 – Sell on Rise SetupNifty is showing clear bearish intent, and price action suggests that 25515–25535 is emerging as a strong supply zone. This area has previously attracted selling pressure, and we expect sellers to defend it aggressively again.
As long as NIFTY trades below this resistance band, momentum favors the downside.
📌 Trade Plan:
Strategy: Sell on Rise
Resistance Zone: 25515 – 25535
Targets:
🎯 25450
🎯 25410
🎯 Extended target below 25400
Bias: Bearish below 25535
If price fails to sustain above the resistance zone, sellers could push the index back toward 25400 levels and potentially lower.
⚠️ Watch for rejection candles / lower high formation near resistance for better confirmation.
📌 Disclaimer
This analysis is strictly for educational purposes and not financial advice. Please consult your financial advisor and follow your own trading plan before taking any trades.
If you find this idea useful, hit the like button and share your views—your feedback helps us create better trading insights for the community.
🚀 Trade smart. Trade disciplined.
Happy Trading,
– The InvestPro Team

Nifty - Weekly Review Feb 16 to Feb 20We have two unfilled gaps. 25630 to 25750 and 25440 to 25110. These gaps can act as strong support or resistance. The price sustaining above or below these levels can decide the trend direction.
Buy above 25520 with the stop loss of 25460 for the targets 25560, 25600, 25660, 25720, 25800, and 25860.
Sell below 25400 with the stop loss of 25460 for the targets 25360, 25300, 25240, 25180, 25120, 25060 and 25020.
Always do your analysis before taking any trade.

Critical Support Alert For Nifty IT Hi mates, Sharing an video idea for Nifty IT index in which I tried to explain everything from my side still you have any any questions you can ask from me in comment section for this you are most welcome. Thanks for your valuable time for watching this video.
Regards- Amit.

Nifty IT in trouble? An Opportunity to make quick buck?Hey folks,
Today I am talking about the NIFTY IT 's massive sell-off in past 10 days. and yesterday session was with a huge gap down.
Major IT stocks that has crashed in this sell of are -
TCS : slipping to its 52-week low
Infosys : 6% drop in last trading session, to hit new 52-week low
Wipro : 4% drop to also hit 52-week low.
L&T : dropped to its 52-week low.
Considering huge selling, bringing these stocks to a cheaper rates could attract buyers in next few session, as we already saw on Friday the buyers came in to push the stocks upward from their lows .
Technical Angle.
The level of 31350-31500 is the next support zone to this Index. below that we could see further fall but it wouldn't be as huge which has past. if you have grabbed the bite of that fall that is great. But lets be real the RSI 21 will enter in the oversold zone with the next fall, FYI RSI 14 is already in oversold zone.
Next Move
So for me, to move the index further below strongly it should technically take a good pull up till 20EMA at-least.
thus, Next week I am looking in Long position in these above major affected stocks i mentioned.
high volume will define where the volatility action could be seen among these.
Lets discuss what is your take on Current this NIFTY IT situation. This is my very raw analysis on this one as I failed to take action on the real move(short).

GIFTNIFTY Intra-Swing Level Analysis for 17th FEB 2026GIFTNIFTY Intra-Swing Level Analysis for 17th FEB 2026
🚀Follow & Compare NIFTY spot Post for Taking Trade
👇🏼Screenshot of NIFTY Spot All-day(16th FEB 2026) in 5 min TF with perodical update.
━━━━━━━━━₹₹₹₹₹₹₹₹₹₹₹₹━━━━━━━━
⚪Weekly PCR Analysis:
17 Feb 2026 EXP. Weekly Basis =>
Put OI:41,97,932, Call OI: 39,70,386, PCR: 1.06. Trend Strength: 🟠Neutral. Sentiment: Positive
Intraday Change in Weekly Basis Data =>
PPut OI Change: 111,90,371, Call OI Change: 11,48,263, Change OI PCR: 1.04 Trend Strength: 🟠Neutral.
━━━━━━━━━₹₹₹₹₹₹₹₹₹₹₹₹━━━━━━━━
💥Level Interpretation / description:
L#1: If the candle crossed & stays above the “Buy Gen”, it is treated / considered as Bullish bias.
L#2: Possibility / Probability of REVERSAL near RLB#1 & UBTgt
L#3: If the candle stays above “Sell Gen” but below “Buy Gen”, it is treated / considered as Sidewise. Aggressive Traders can take Long position near “Sell Gen” either retesting or crossed from Below & vice-versa i.e. can take Short position near “Buy Gen” either retesting or crossed downward from Above.
L#4: If the candle crossed & stays below the “Sell Gen”, it is treated / considered a Bearish bias.
L#5: Possibility / Probability of REVERSAL near RLS#1 & USTgt
HZB (Buy side) & HZS (Sell side) => Hurdle Zone,
*** Specialty of “HZB#1, HZB#2 HZS#1 & HZS#2” is Sidewise (behaviour in Nature)
Rest Plotted and Mentioned on Chart
Color code Used:
Green =. Positive bias.
Red =. Negative bias.
RED in Between Green means Trend Finder / Momentum Change
/ CYCLE Change and Vice Versa.
Notice One thing: HOW LEVELS are Working.
Use any Momentum Indicator / Oscillator or as you "USED to" to Take entry.
━━━━━━━━━━━━━━━━━━━━━━━━━━━━━━━━━━━━━━━━━━━
⚠️ DISCLAIMER:
The information, views, and ideas shared here are purely for educational and informational purposes only. They are not intended as investment advice or a recommendation to buy, sell, or hold any financial instruments. I am not a SEBI-registered financial adviser.
Trading and investing in the stock market involves risk, and you should do your own research and analysis. You are solely responsible for any decisions made based on this research.
"🔔As HARD EARNED MONEY IS YOUR's, So DECISION SHOULD HAVE TO BE YOUR's".
━━━━━━━━━━━━━━━━━━━━━━━━━━━━━━━━━
❇️ Follow notification about periodical View
💥 Do Comment for Stock WEEKLY Level Analysis.🚀
📊 Do you agree with this view?
✈️ HIT THE PLANE ICON if this technical observation resonates with you. It will Motivate me.
━━━━━━━━━━━━━━━━━━━━━━━━━━━━━━━━━
💡 If You LOOKING any CHART & want for Level and ANALYZE?
Share your desired stock names in the comments below! I will try to analyze the chart Levels, patterns and share my technical view (so far my Knowledge).
If Viewers think It can identify meaningful setups. Looking forward to hearing from all of you — let's keep this discussion going and help each other make better trading decisions.________________^^^^^^^^^^^^^^^^_________________


BANKNIFTY Scalping / Short Range Level analysis: 17th FEB 2026As mentioned Y'Day BANKNIFTY : Bullish.
Notice one thing How Levels are Tested
👇🏼Screenshot of BANKNIFTY Spot All-day(16th FEB 2026) in 5 min TF.
━━━━━━━━━₹₹₹₹₹₹₹₹₹₹₹₹━━━━━━━━
🟣FEB EXP. Monthly PCR Analysis:
Put OI: 5,27,016, Call OI: 4,62,049, PCR: 1.14. Trend Strength: 🟠Neutral.
Intraday Change in Monthly Basis Data =>
Put OI Change: 91,786, Call OI Change: -40,249, Change OI PCR: -2.28. Trend Strength: 🟠Neutral.
━━━━━━━━━₹₹₹₹₹₹₹₹₹₹₹₹━━━━━━━━
Some Technical Parameter:
🛑 VWap vs Price: Price Below.
🟢 Rsi(14): 60.40
🟧 Stoch Rsi(14): 79.51, 71.38 (Down but Neutral though Bearish Cross Over)
🟢 MACD Bias (12,26): 252.46 (Bullish)
🟡 Williams %R: -20.49 (Perfect Reversal Point Near -80)
🟠 ROC: 2.27
Time Frame basis Trend:
🟢1 Min: Bear, 🟢5 Min: Bear, 🟢15 Min: Bear, 🟢30 Min: Bear, 🟢1 Hour Bear,
🟢2 Hour: Bear, 🟢4 Hour: Bullish, 🟢Daily : Bullish, 🟢Weekly: : Bullish, 🟢Monthly: Bullish.
━━━━━━━━━₹₹₹₹₹₹₹₹₹₹₹₹━━━━━━━━
MA (Moving Averages) Analysis:
🟩 Period 🟩 SMA 🟩 EMA
🟩 MA 9 - 60482.11 - 60410.89
🟩 MA 20 - 59783.34 - 60053.19
🟩 MA 50 - 59578.08 - 59525.61
🟩 MA 100 - 58596.64 - 58639.69
🟩 MA 200 - 57134.14 - 57026.51
━━━━━━━━━₹₹₹₹₹₹₹₹₹₹₹₹━━━━━━━━
💥Level Interpretation / description:
L#1: If the candle crossed & stays above the “Buy Gen”, it is treated / considered as Bullish bias.
L#2: Possibility / Probability of REVERSAL near RLB#1 & UBTgt
L#3: If the candle stays above “Sell Gen” but below “Buy Gen”, it is treated / considered as Sidewise. Aggressive Traders can take Long position near “Sell Gen” either retesting or crossed from Below & vice-versa i.e. can take Short position near “Buy Gen” either retesting or crossed downward from Above.
L#4: If the candle crossed & stays below the “Sell Gen”, it is treated / considered a Bearish bias.
L#5: Possibility / Probability of REVERSAL near RLS#1 & USTgt
HZB (Buy side) & HZS (Sell side) => Hurdle Zone,
*** Specialty of “HZB#1, HZB#2 HZS#1 & HZS#2” is Sidewise (behaviour in Nature)
Rest Plotted and Mentioned on Chart
Color code Used:
Green =. Positive bias.
Red =. Negative bias.
RED in Between Green means Trend Finder / Momentum Change
/ CYCLE Change and Vice Versa.
Notice One thing: HOW LEVELS are Working.
Use any Momentum Indicator / Oscillator or as you "USED to" to Take entry.
━━━━━━━━━━━━━━━━━━━━━━━━━━━━━━━━━━━━━━━━━━━
⚠️ DISCLAIMER:
The information, views, and ideas shared here are purely for educational and informational purposes only. They are not intended as investment advice or a recommendation to buy, sell, or hold any financial instruments. I am not a SEBI-registered financial adviser.
Trading and investing in the stock market involves risk, and you should do your own research and analysis. You are solely responsible for any decisions made based on this research.
"🔔As HARD EARNED MONEY IS YOUR's, So DECISION SHOULD HAVE TO BE YOUR's".
━━━━━━━━━━━━━━━━━━━━━━━━━━━━━━━━━
❇️ Follow notification about periodical View
💥 Do Comment for Stock WEEKLY Level Analysis.🚀
📊 Do you agree with this view?
✈️ HIT THE PLANE ICON if this technical observation resonates with you. It will Motivate me.
━━━━━━━━━━━━━━━━━━━━━━━━━━━━━━━━━
💡 If You LOOKING any CHART & want for Level and ANALYZE?
Share your desired stock names in the comments below! I will try to analyze the chart Levels, patterns and share my technical view (so far my Knowledge).
If Viewers think It can identify meaningful setups. Looking forward to hearing from all of you — let's keep this discussion going and help each other make better trading decisions.________________^^^^^^^^^^^^^^^^_________________
🔔🔕🟥🟧🟨🟩🟦🟪⬛🔴🟠🟡🟢🔵🟣⚫⚪🔺🔻

Nifty Intraday Analysis for 17th February 2026NSE:NIFTY
Index has resistance near 25875 – 25925 range and if index crosses and sustains above this level then may reach near 26125 – 26175 range.
Nifty has immediate support near 25475 – 25425 range and if this support is broken then index may tank near 25225 – 25175 range.
Upside momentum is capped by mounting geopolitical tensions in the Middle East. Any positive opening is expected to be met with selling pressure.

Banknifty Intraday Analysis for 17th February 2026NSE:BANKNIFTY
Index has resistance near 61350 – 61450 range and if index crosses and sustains above this level then may reach near 61850 – 61950 range.
Banknifty has immediate support near 60550 - 60450 range and if this support is broken then index may tank near 60050 - 59950 range.
Upside momentum is capped by mounting geopolitical tensions in the Middle East. Any positive opening is expected to be met with selling pressure.

Finnifty Intraday Analysis for 17th February 2026 NSE:CNXFINANCE
Index has resistance near 28525 - 28575 range and if index crosses and sustains above this level then may reach near 28800 - 28850 range.
Finnifty has immediate support near 28075 – 28025 range and if this support is broken then index may tank near 27800 – 27750 range.
Upside momentum is capped by mounting geopolitical tensions in the Middle East. Any positive opening is expected to be met with selling pressure.

Midnifty Intraday Analysis for 17th February 2026NSE:NIFTY_MID_SELECT
Index has immediate resistance near 13750 – 13775 range and if index crosses and sustains above this level then may reach 13900 – 13925 range.
Midnifty has immediate support near 13500 – 13475 range and if this support is broken then index may tank near 13350 – 13325 range.
Upside momentum is capped by mounting geopolitical tensions in the Middle East. Any positive opening is expected to be met with selling pressure.

BANKNIFTY Scalping / Short Range Level analysis -16th FEB 2026+BANKNIFTY Scalping / Short Range Level analysis for 16th FEB 2026+
━━━━━━━━━₹₹₹₹₹₹₹₹₹₹₹₹━━━━━━━━
🔵FEB EXP. Monthly PCR Analysis:
Put OI: 4,38,519, Call OI: 5,01,661, PCR: 0.87. Trend Strength: 🟠Neutral.
Intraday Change in Monthly Basis Data =>
Put OI Change: -70,764, Call OI Change: 36,273, Change OI PCR: -1.95. Trend Strength: 🛑 Extreme Bearish.
━━━━━━━━━₹₹₹₹₹₹₹₹₹₹₹₹━━━━━━━━
Some Technical Parameter:
🛑 VWap vs Price: Price Below.
🟠 Rsi(14): 53.83
🟡 Stoch Rsi(14): 60.35, 69.67 (Down but Neutral though Bearish Cross Over)
🟢 MACD Bias (12,26): 313.10 (Bullish)
🟡 Williams %R: -39.64 (Perfect Reversal Point Near -80)
🟠 ROC: 1.66
Time Frame basis Trend:
🛑1 Min: Bear, 🛑5 Min: Bear, 🛑15 Min: Bear, 🛑30 Min: Bear, 🛑1 Hour Bear,
🟢2 Hour: Bear, 🟢4 Hour: Bullish, 🟢Daily : Bullish, 🟢Weekly: : Bullish, 🟢Monthly: Bullish.
━━━━━━━━━₹₹₹₹₹₹₹₹₹₹₹₹━━━━━━━━
MA (Moving Averages) Analysis:
⚪Period - SMA - EMA
🟨 MA 9 - 60381.24 - 60276.34
🟩 MA 20 - 59730.45 - 59958.89
🟩 MA 50 - 59544.87 - 59467.51
🟩 MA 100 - 58540.00 - 58593.03
🟩 MA 200 - 57104.83 - 56987.09
━━━━━━━━━₹₹₹₹₹₹₹₹₹₹₹₹━━━━━━━━
💥Level Interpretation / description:
L#1: If the candle crossed & stays above the “Buy Gen”, it is treated / considered as Bullish bias.
L#2: Possibility / Probability of REVERSAL near RLB#1 & UBTgt
L#3: If the candle stays above “Sell Gen” but below “Buy Gen”, it is treated / considered as Sidewise. Aggressive Traders can take Long position near “Sell Gen” either retesting or crossed from Below & vice-versa i.e. can take Short position near “Buy Gen” either retesting or crossed downward from Above.
L#4: If the candle crossed & stays below the “Sell Gen”, it is treated / considered a Bearish bias.
L#5: Possibility / Probability of REVERSAL near RLS#1 & USTgt
HZB (Buy side) & HZS (Sell side) => Hurdle Zone,
*** Specialty of “HZB#1, HZB#2 HZS#1 & HZS#2” is Sidewise (behaviour in Nature)
Rest Plotted and Mentioned on Chart
Color code Used:
Green =. Positive bias.
Red =. Negative bias.
RED in Between Green means Trend Finder / Momentum Change
/ CYCLE Change and Vice Versa.
Notice One thing: HOW LEVELS are Working.
Use any Momentum Indicator / Oscillator or as you "USED to" to Take entry.
━━━━━━━━━━━━━━━━━━━━━━━━━━━━━━━━━━
⚠️ DISCLAIMER:
The information, views, and ideas shared here are purely for educational and informational purposes only. They are not intended as investment advice or a recommendation to buy, sell, or hold any financial instruments. I am not a SEBI-registered financial adviser.
Trading and investing in the stock market involves risk, and you should do your own research and analysis. You are solely responsible for any decisions made based on this research.
"🟥 As HARD EARNED MONEY IS YOUR's, So DECISION SHOULD HAVE TO BE YOUR's".
━━━━━━━━━━━━━━━━━━━━━━━━━━━━━━━━━
❇️ Follow notification about periodical View
💥 Do Comment for Stock WEEKLY Level Analysis.🚀
📊 Do you agree with this view?
✈️ HIT THE PLANE ICON if this technical observation resonates with you. It will Motivate me.
━━━━━━━━━━━━━━━━━━━━━━━━━━━━━━━━━
💡 If You LOOKING any CHART & want for Level and ANALYZE?
Share your desired stock names in the comments below! I will try to analyze the chart Levels, patterns and share my technical view (so far my Knowledge).
If Viewers think It can identify meaningful setups. Looking forward to hearing from all of you — let's keep this discussion going and help each other make better trading decisions.________________^^^^^^^^^^^^^^^^_________________
🔕🟥🟧🟨🟩🟦🟪⬛🔴🟠🟡🟢🔵🟣⚫⚪🔺🔻

Nifty Intraday Analysis for 16th February 2026NSE:NIFTY
Index has resistance near 25675 – 25725 range and if index crosses and sustains above this level then may reach near 26925 – 25975 range.
Nifty has immediate support near 25275 – 25225 range and if this support is broken then index may tank near 25025 – 24975 range.
Upside momentum is capped by mounting geopolitical tensions in the Middle East and ongoing AI disruption. Any positive opening is expected to be met with selling pressure.

Banknifty Intraday Analysis for 16th February 2026NSE:BANKNIFTY
Index has resistance near 60600 – 60700 range and if index crosses and sustains above this level then may reach near 61100 – 61200 range.
Banknifty has immediate support near 59800 - 59700 range and if this support is broken then index may tank near 59300 - 59200 range.
Upside momentum is capped by mounting geopolitical tensions in the Middle East and ongoing AI disruption. Any positive opening is expected to be met with selling pressure.
