DMart(Avenue Supermarts Ltd) – A Correction Inside a CorrectionOn the daily chart, DMart(Avenue Supermarts Ltd) appears to be unfolding a clean (a)-(b)-(c) correction within the ongoing downtrend from ₹4,949.50.
The initial leg down to ₹4,111 unfolded in five waves, marking Wave (a) of the correction. A relief rally is likely next — an expected Wave (b) move that could face resistance around the ₹4,500–₹4,600 zone.
If this view holds, a final Wave (c) decline may complete the pattern near ₹3,300–₹3,400 — aligning with the previous demand area. RSI is trying to rebound from oversold territory, hinting that the short-term recovery phase could soon begin.
When we zoom out to the weekly chart, this entire structure fits as part of a larger W–X–Y double zigzag correction that began from the ₹5,900 all-time high.
In other words — a correction inside a correction .
Until price convincingly breaks above ₹4,950, DMart remains in a broader corrective phase. The bulls may see short-term relief, but the bigger correction likely hasn’t finished playing out.
Disclaimer: This analysis is for educational purposes only and does not constitute investment advice. Please do your own research (DYOR) before making any trading decisions.
Support and Resistance

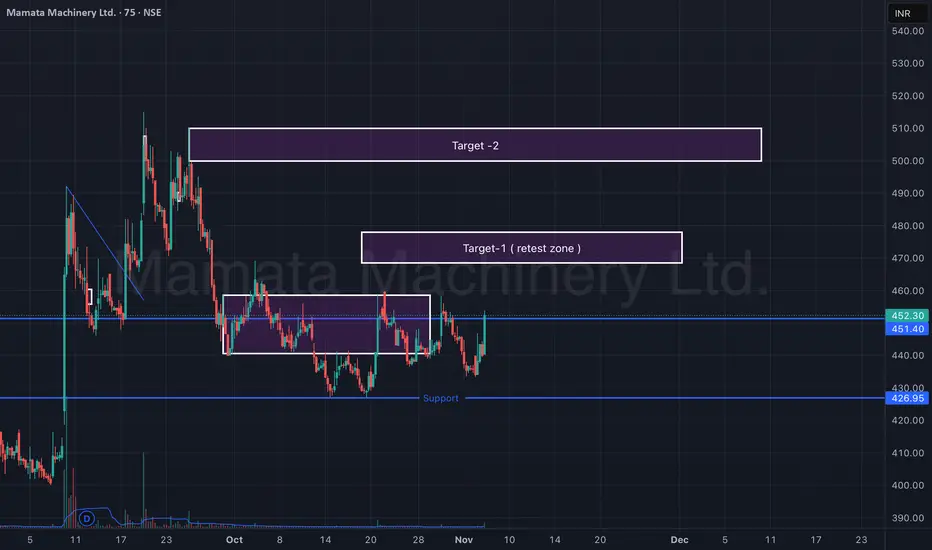
Mamata Machinery Ltd – Support Reversal & Retest Zone (75-min)Mamata Machinery is showing early signs of reversal from a strong support zone around ₹425–₹430. After forming a double-bottom-like structure, the stock has bounced sharply with rising volumes, indicating a possible short-term trend reversal.
Currently, price action is approaching a retest zone (Target-1) near ₹465–₹470. Sustaining above this level can open the path toward the next resistance cluster (Target-2) near ₹505–₹515.
🎯 Key Levels:
CMP: ₹452.30 (+3.81%)
Support Zone: ₹425 – ₹430
Target-1 (Retest Zone): ₹465 – ₹470
Target-2: ₹505 – ₹515
Stop-Loss: ₹425 (on 75-min close basis)
📊 Technical View:
Price rebounded from major support with visible volume spike.
Structure forming higher lows — early indication of momentum shift.
Short-term EMAs turning upward; potential crossover likely soon.
Sustained move above ₹470 can confirm breakout continuation toward ₹510+.
🧠 View:
Mamata Machinery has reversed from key support and is testing its retest zone. A breakout above ₹470 could trigger a short-term rally toward ₹510, while maintaining a stop-loss below ₹425.
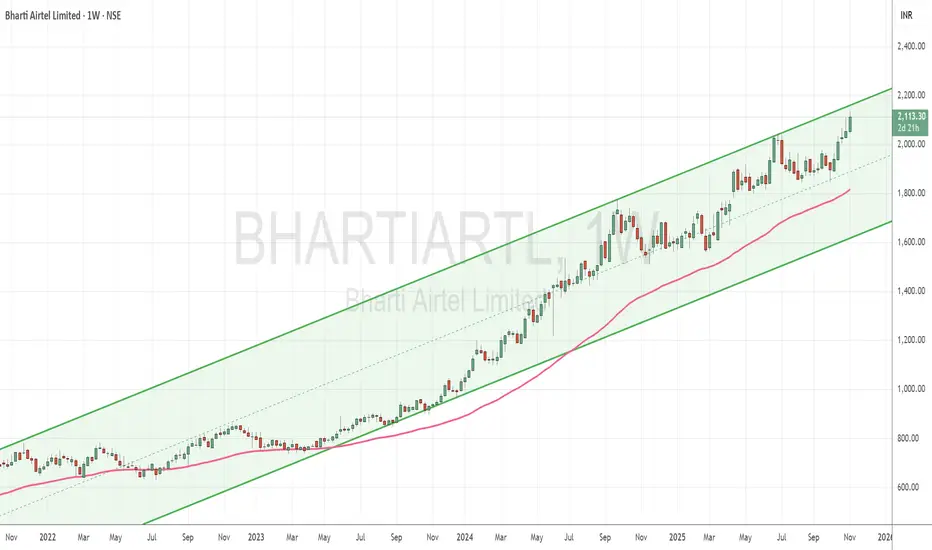
Bharti Airtel climbs relentlessly but risks overbought correctioTopic Statement:
Bharti Airtel is on a strong bull run, maintaining momentum within a defined channel, though overbought conditions hint at a potential correction risk.
Key Points:
1. The stock is moving in a bullish up-trending channel, making it ideal for channel-based trading
2. Price generally remains above the 50-day EMA, signaling continued strength
3. The stock is currently highly overbought, and a sharp correction may be on the horizon as risk builds
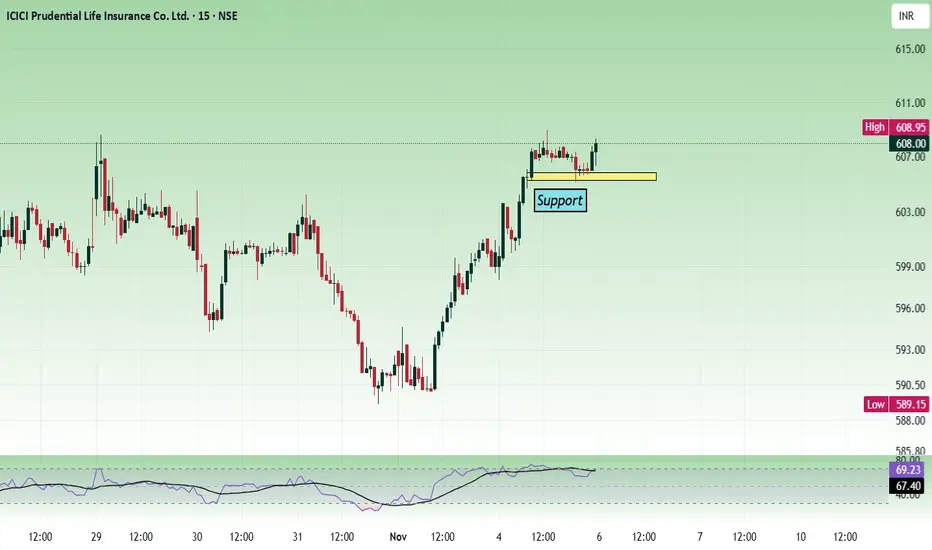
ICICI Prudential - Multi time frame analysis...In the lower time frame, the price is taking support from the support zone at 605. The daily time frame shows, the price was consolidating in the range of 580 to 610, and now it is getting ready to give a breakout.
The candle formation in the daily chart is showing strength. Buy above 604 - 606 with the stop loss of 598 for the targets 611, 616, 621, 628 and 634.
This will work if the opening shows bullish strength above 600. Otherwise, the price can continue to move in the range.
Always do your analysis before taking any trade.
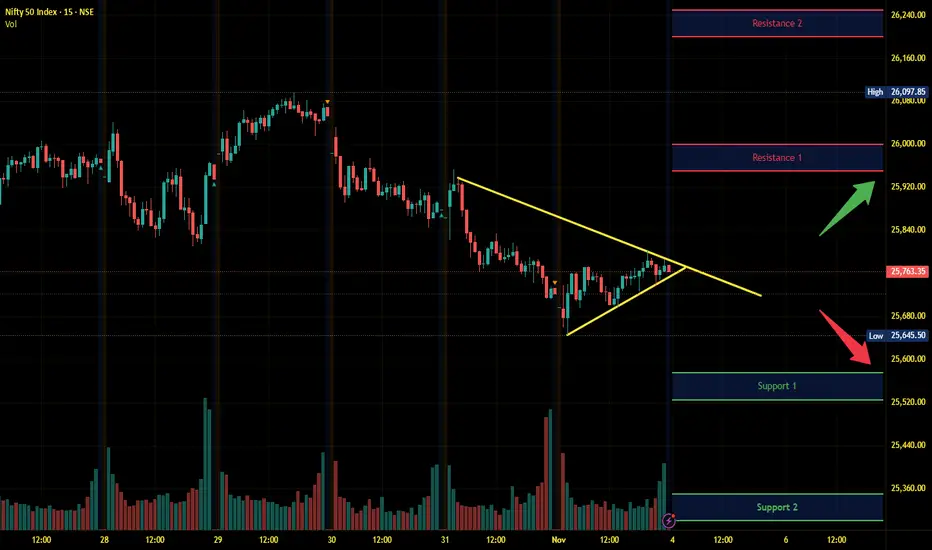
Nifty Intraday Analysis for 04th November 2025NSE:NIFTY
Index has resistance near 25950 – 26000 range and if index crosses and sustains above this level then may reach near 26200 – 26250 range.
Nifty has immediate support near 25575 – 25525 range and if this support is broken then index may tank near 25350 – 25300 range.
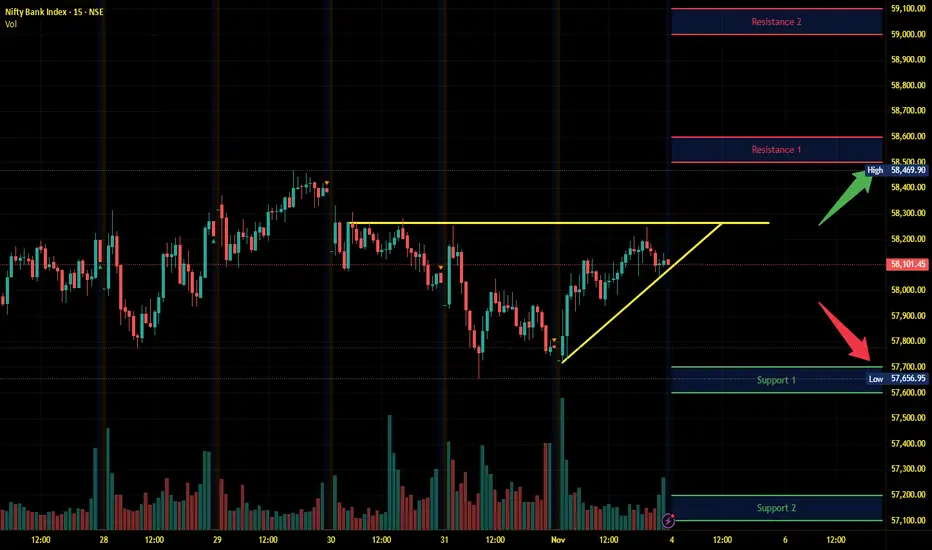
Banknifty Intraday Analysis for 04th November 2025NSE:BANKNIFTY
Index has resistance near 58500 – 58600 range and if index crosses and sustains above this level then may reach near 59000 – 59100 range.
Banknifty has immediate support near 57700 - 57600 range and if this support is broken then index may tank near 57200 - 57100 range.
Finnifty Intraday Analysis for 04th November 2025 NSE:CNXFINANCE
Index has resistance near 27500 - 27550 range and if index crosses and sustains above this level then may reach near 27750 - 27800 range.
Finnifty has immediate support near 27125 – 27075 range and if this support is broken then index may tank near 26900 – 26850 range.

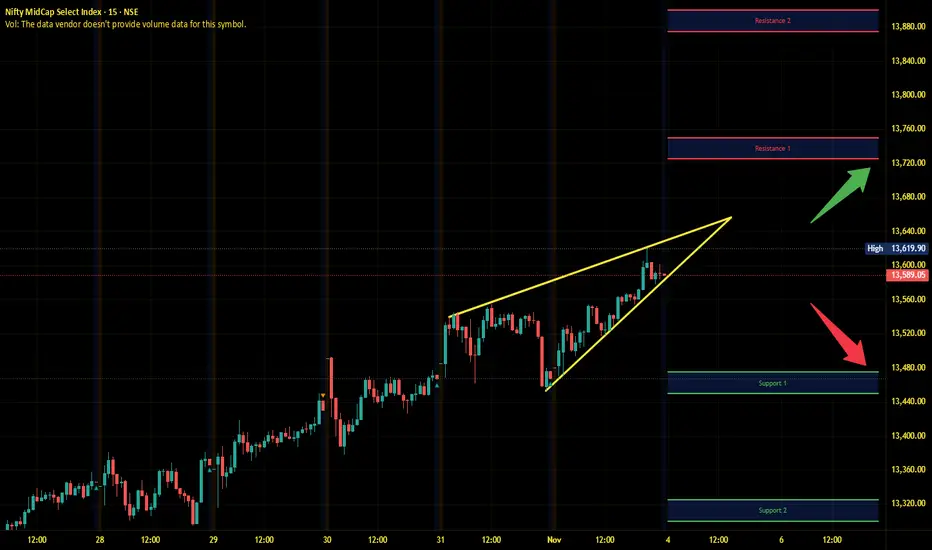
Midnifty Intraday Analysis for 04th November 2025NSE:NIFTY_MID_SELECT
Index has immediate resistance near 13725 – 13750 range and if index crosses and sustains above this level then may reach 13875 – 13900 range.
Midnifty has immediate support near 13475 – 13450 range and if this support is broken then index may tank near 13325 – 13200 range.
Nifty - Expiry day analysis Nov 4Price moved within the range of 25650 to 25780 today, and these levels are acting as strong support/resistance. Nearby support is at 25500, and resistance is at 25900. And still the price is inside the falling wedge.
Buy above 25820 with the stop loss of 25780 for the targets 25860, 25900, 25940 and 25980.
Sell below 25720 with the stop loss of 25760 for the targets 25680, 25640, 25600 and 25540.
The expected expiry day range is 25600 to 25900.
Always do your analysis before taking any trade.

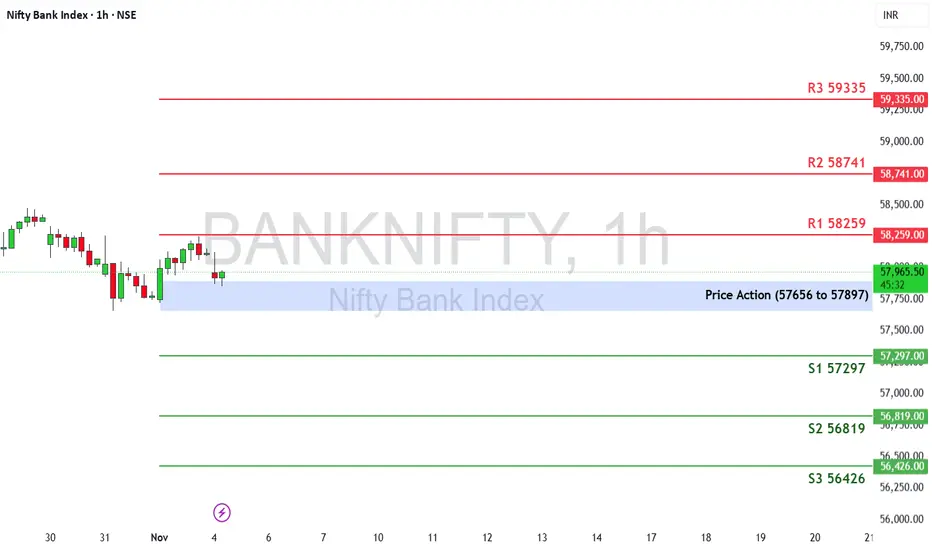
Bank Nifty Weekly Outlook (3rd Nov – 7th Nov 2025)The Nifty Bank Index last week ended at 57,776.35, posting a modest +0.13% gain. The index showed signs of indecision near the recent high, indicating that the market is pausing after a strong bullish run in October.
🔹 Key Levels for the Upcoming Week
📌 Price Action Pivot Zone:
57,656 to 57,897 – This blue-shaded range marks the key decision area. Sustaining above this zone may invite renewed buying interest, while a close below could lead to mild profit booking.
🔻 Support Levels:
S1: 57,297
S2: 56,819
S3: 56,426
🔺 Resistance Levels:
R1: 58,259
R2: 58,741
R3: 59,335
📈 Market Outlook
✅ Bullish Scenario:
If Bank Nifty sustains above 57,897, a move toward R1 (58,259) can be expected. Sustained strength above this level may open the path toward R2 (58,741) and R3 (59,335) in the near term.
❌ Bearish Scenario:
If the index falls below 57,656, short-term weakness may drag it toward S1 (57,297), followed by S2 (56,819) and S3 (56,426). A weekly close below 57,200 could signal the beginning of a corrective phase.
Disclaimer: lnkd.in
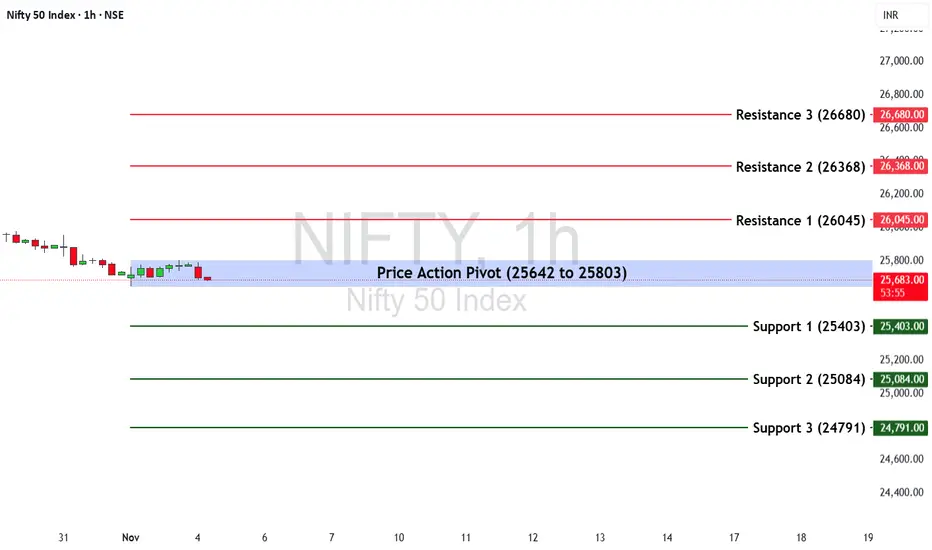
Nifty 50 Weekly Outlook ( 3rd Nov – 7th Nov 2025)The Nifty 50 Index last week ended at 25,722.10, posting a -0.28% decline. The index showed mild profit-booking near resistance after a sharp rally in recent weeks, suggesting a potential consolidation phase before the next directional move.
🔹 Key Levels for the Upcoming Week
📌 Price Action Pivot Zone:
25,642 to 25,803 – This blue-shaded zone represents the key decision area. Sustaining above this range may attract renewed buying interest, while a breakdown below could trigger short-term profit booking.
🔻 Support Levels:
S1: 25,403
S2: 25,084
S3: 24,791
🔺 Resistance Levels:
R1: 26,045
R2: 26,368
R3: 26,680
📈 Market Outlook
✅ Bullish Scenario:
If Nifty holds above 25,803, a breakout move could lift the index toward R1 (26,045). Sustained momentum above this level may extend gains toward R2 (26,368) and R3 (26,680) in the coming sessions.
❌ Bearish Scenario:
If the index slips below 25,642, short-term weakness could drag it toward S1 (25,403), followed by S2 (25,084) and S3 (24,791).
Disclaimer: lnkd.in
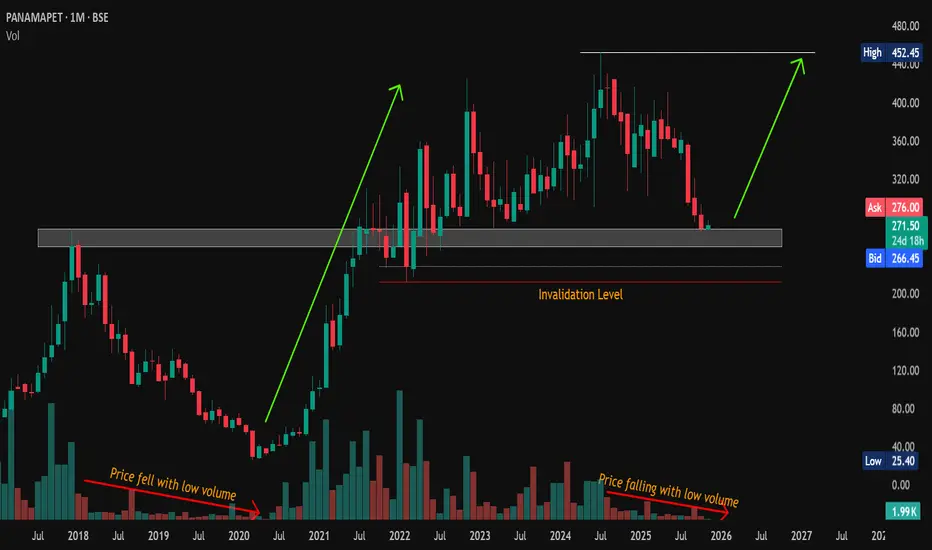
#PANAMAPET | Low-Volume Pullback at Key SupportCMP: 271.50
Price has returned to a major demand zone , and the decline came on low volume , hinting at weak selling pressure.
Could this be the calm before another rally toward 450+? 🚀
📊 Breakout–Retest–Continuation setup forming!
🛡 Supports: 268-249 / 229
🚧 Resistances: 279 / 347
❌ Invalidation: Below 212.50 (WCB)
🎯 Targets: 380 / 415 / 452+ (ATH)
📊 Volume Trend: Price falling on declining volume → typical sign of healthy corrections within an uptrend .
This setup resembles the early accumulation phase of 2020 , where the trend began to reverse from the base zone.
If buyers defend this area, we could see a continuation of the larger bullish trend that started in 2020. 📈
Watch for strength & volume pickup near the support zones for confirmation. 👀
#PANAMAPET #PriceAction #VolumeAnalysis #MarketStructure #LongTerm
📌 Disclaimer: This analysis is shared for educational purposes only. It is not a buy/sell recommendation. Please do your own research before making any trading decisions.
XAU/USD – Gold Accumulating Before Breakout, Target 4,096 USD🔍 Market Context
Gold is trading within a symmetrical triangle pattern , indicating short-term accumulation before forming a new breakout wave.
Following a sharp decline from the peak region of 4,096 USD, the market has shown two instances of Change of Character (ChoCH) – early signs of buying pressure returning.
As long as the price holds above the 3,959 – 3,917 USD zone, the short-term bullish structure remains intact. This support zone acts as a crucial “discount zone” in the current accumulation cycle.
💎 Key Technical Zones
• Support Zone 1: 3,959 USD → main structure holding zone, coinciding with the lower trendline.
• Support Zone 2: 3,917 USD → final liquidity reaction zone.
• Resistance Zone: 4,040 USD → potential break & retest zone.
• Liquidity Zone: 4,096 USD → expansion target if the peak is breached.
🎯 Trading Scenarios
1️⃣ BUY Setup – Prioritise bullish structure
• Entry: 3,959 – 3,917 USD
• Stop Loss: 3,905 USD
• Take Profit:
– TP1: 3,985
– TP2: 4,040
– TP3: 4,072
– TP4: 4,096
✳️ “Buy the discount” – prioritise buy orders at the confluence support zone of trendline + FVG to follow the SMC flow.
2️⃣ SELL Scalp – Secondary strategy when price reacts at the peak
• Entry: 4,096 USD
• Stop Loss: 4,108 USD
• Take Profit:
– TP1: 4,072
– TP2: 4,040
– TP3: 3,985
✳️ “Sell the premium” – only activate if there is a strong price rejection signal at the liquidity peak.
💬 Summary
The short-term trend of gold remains bullish as the price stays above the trendline and continuously forms higher lows.
The main strategy is buy the dip – sell reaction around the 3,959 → 4,096 USD zone.
The confirmation of a strong uptrend will be when the price closes steadily above 4,040 USD .
“Smart money accumulates in silence before the market makes noise.”
⏰ Time Frame: 1H
📅 Update: 03/11/2025
✍️ Analysis by: Captain Vincent

Adani ports Result PlayForming a channel, need to look to uptrend, need to look for upside move once the prices touches the trend line.

BTCUSD Technical Analysis – Imp Levels to WatchBitcoin (BTC/USD) Technical Analysis – Key Levels to Watch (Nov 2025 Update)
Bitcoin is currently showing a sideways-to-weak trend as the price struggles to stay above the $107,000 zone. After reaching its recent high near $125,000, BTC faced selling pressure and started moving lower. Let’s look at the important support and resistance levels that can guide traders in the coming days.
Current Price Action
Bitcoin is trading near **$107,700**, and this area is becoming a key decision zone. The chart shows that buyers are trying to defend the support around **$106,976**, but so far, they are not able to push prices strongly upward. On the other hand, sellers are active near the resistance zone of **$111,000–$112,000**.
This indicates that Bitcoin is stuck in a short-term range between **$107,000 and $111,500**, and a breakout from this range will decide the next move.
Resistance Levels (Upside Targets)
1. Resistance 1 – $110,974 to $111,545:
This is the first barrier BTC needs to cross for any upward momentum. If Bitcoin breaks this level with strong volume, it can move higher toward the next targets.
2. Resistance 2 – $116,500 (First Target):
Once the first resistance is cleared, BTC could aim for this level. This area has seen heavy selling earlier, so bulls will need strong buying power to move above it.
3. Resistance 3 – $125,000 (Third Target):
This is the upper resistance and the recent swing high. If Bitcoin manages to break and close above $125,000, it will confirm a strong bullish trend, and we could see new highs later.
Support Levels (Downside Targets)
1. Immediate Support – $106,976:
This level is acting as the first support for now. If it holds, BTC might bounce back toward $110,000.
2. Downside First Target – $103,500:
If Bitcoin breaks below $106,000, the next target on the downside could be around $103,500. This will show short-term weakness in the market.
3. Latest Support – $98,600 to $99,700:
This zone is very important because it acted as a strong base in the past. Many buyers may re-enter the market here.
4. Demand Zone / Support 2 – $89,000 to $90,700:
This area is called the “Demand Zone.” If prices fall this low, we can expect a strong buying reaction as long-term investors might find this level attractive.
5. Final Support – $78,600 to $79,700:
This is the last strong support on the chart. A fall below this level would signal a major trend reversal from bullish to bearish.
"Summary"
Right now, Bitcoin’s short-term trend is sideways to slightly bearish** until it breaks above $111,500. If BTC holds above $107,000 and breaks the first resistance, we can expect recovery toward $116,000 and then $125,000.
However, if it slips below $106,000, the price may test $103,500 or even $99,700 in the coming sessions.
Traders should watch these levels carefully and avoid over-leveraging during sideways market conditions.

Sun Pharma trades sideways within a defined rangeTopic Statement:
Sun Pharma has remained in a sideways zone throughout the year, presenting recurring opportunities for accumulation at key technical levels.
Key Points:
1. The stock is rangebound between 1550 and 1800, with no clear breakout direction so far
2. It consistently takes strong support at the 23.6% Fibonacci retracement level at 1568
3. The stock can be accumulated when it dips below the 50-day EMA, with heavier investment opportunities when it falls below the 200-day EMA

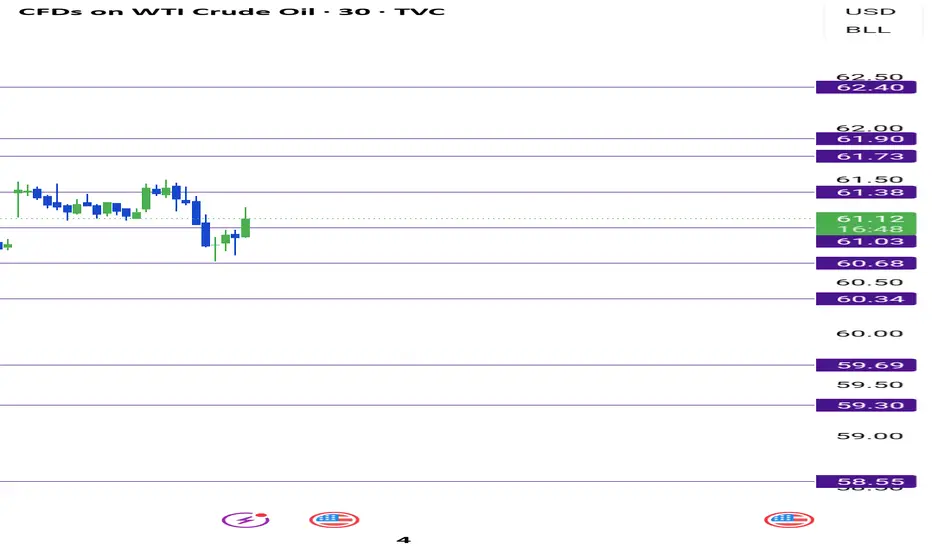
US OIL SUPPORT, RESISTANCE & TRENDLINE ANALYSIS Hello guyz hope uall r doing well. I am on a travelling spree so I apologize for not providing consistent updates.
Just trade along with the given levels provided. Do not be over greedy. Exit your trade each time it touches a level and book your profits. Don't loose your capital.
I shall provide more sharp and accurate updates when I will be home.
Nifty Intraday Analysis for 03rd November 2025NSE:NIFTY
Index has resistance near 25950 – 26000 range and if index crosses and sustains above this level then may reach near 26200 – 26250 range.
Nifty has immediate support near 25550 – 25500 range and if this support is broken then index may tank near 25350 – 25300 range.

Banknifty Intraday Analysis for 03rd November 2025NSE:BANKNIFTY
Index has resistance near 58200 – 58300 range and if index crosses and sustains above this level then may reach near 58700 – 58800 range.
Banknifty has immediate support near 57400 - 57300 range and if this support is broken then index may tank near 56900 - 56800 range.

Finnifty Intraday Analysis for 03rd November 2025 NSE:CNXFINANCE
Index has resistance near 27350 - 27400 range and if index crosses and sustains above this level then may reach near 27600 - 27650 range.
Finnifty has immediate support near 26950 – 26900 range and if this support is broken then index may tank near 26700 – 26650 range.

XAUUSD SUPPORT, RESISTANCE & TRENDLINE ANALYSISHello guyz hope uall r doing well. I am on a travelling spree so I.apologize for not providing consistent updates.
However, my levels shall remain the same and you'll can trade within the levels confidently.
Go for LONG only if it stays below 3980. If it breaks 3980 then you can plan for SHORT positions with a max target of 3929.

Midnifty Intraday Analysis for 03rd November 2025NSE:NIFTY_MID_SELECT
Index has immediate resistance near 13575 – 135600 range and if index crosses and sustains above this level then may reach 13725 – 13750 range.
Midnifty has immediate support near 13350 – 13325 range and if this support is broken then index may tank near 13200 – 13175 range.

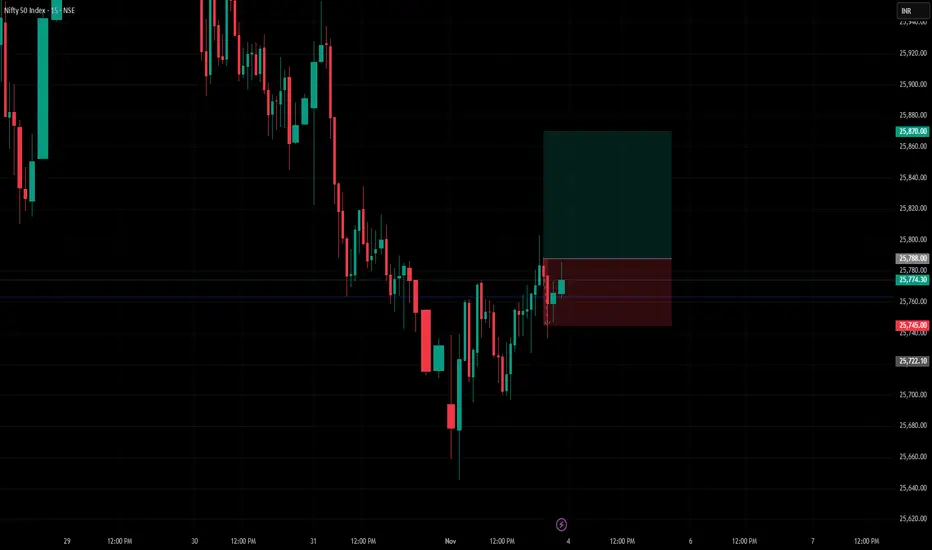
Nifty Intraday Long, Stop Loss and Target Levels markedExpecting bulls to be aggressive if nifty crosses strong above 25788 and the target will be 25870.
In case if nifty falls below 25745, then the bears will take the control.
Accordingly marked the chart with long, target and stop loss points