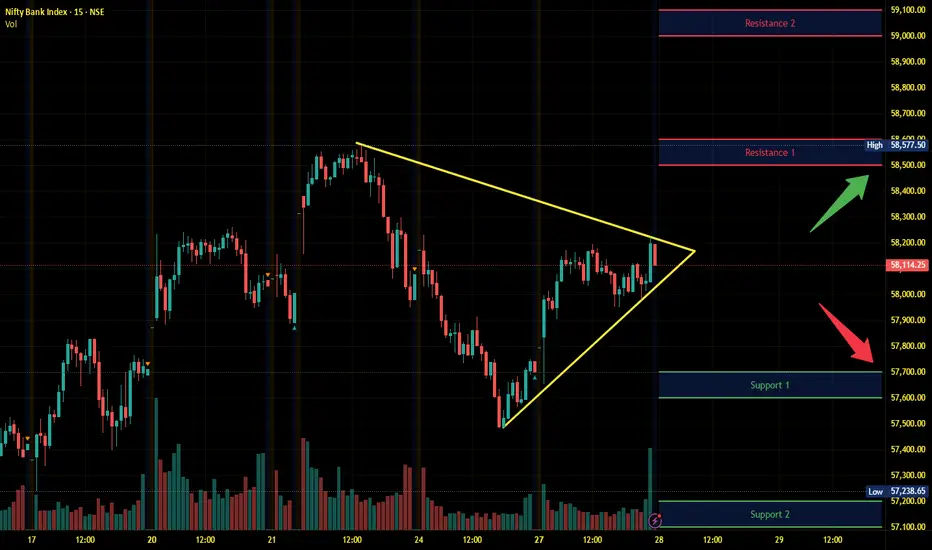
Banknifty Intraday Analysis for 28th October 2025NSE:BANKNIFTY
Index has resistance near 58500 – 58600 range and if index crosses and sustains above this level then may reach near 59000 – 59100 range.
Banknifty has immediate support near 57700 - 57600 range and if this support is broken then index may tank near 57200 - 57100 range.
Support and Resistance
Finnifty Intraday Analysis for 28th October 2025 NSE:CNXFINANCE
Index has resistance near 27725 - 27775 range and if index crosses and sustains above this level then may reach near 27950 - 28000 range.
Finnifty has immediate support near 27325– 27275 range and if this support is broken then index may tank near 27100 – 27050 range.

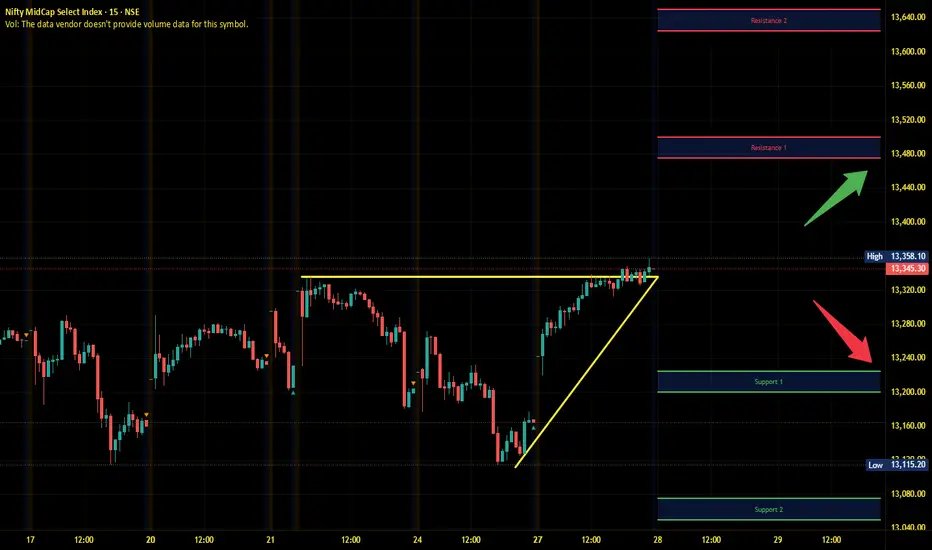
Midnifty Intraday Analysis for 28th October 2025NSE:NIFTY_MID_SELECT
Index has immediate resistance near 13475 – 13500 range and if index crosses and sustains above this level then may reach 13625 – 13650 range.
Midnifty has immediate support near 13225 – 13200 range and if this support is broken then index may tank near 13075– 13050 range.
Policy Bazaar Cmp 1686 Double bottom @ support LinePolicy Bazaar Cmp 1686 dated 24-10-2025
1. Double bottom @ support Line
2. Price Rise with Volume
Buy above 1690 SL 1630 target 1705-1720-1735-
1755-1770-1780-1790-1805
It is just a view, please trade at your own risk.

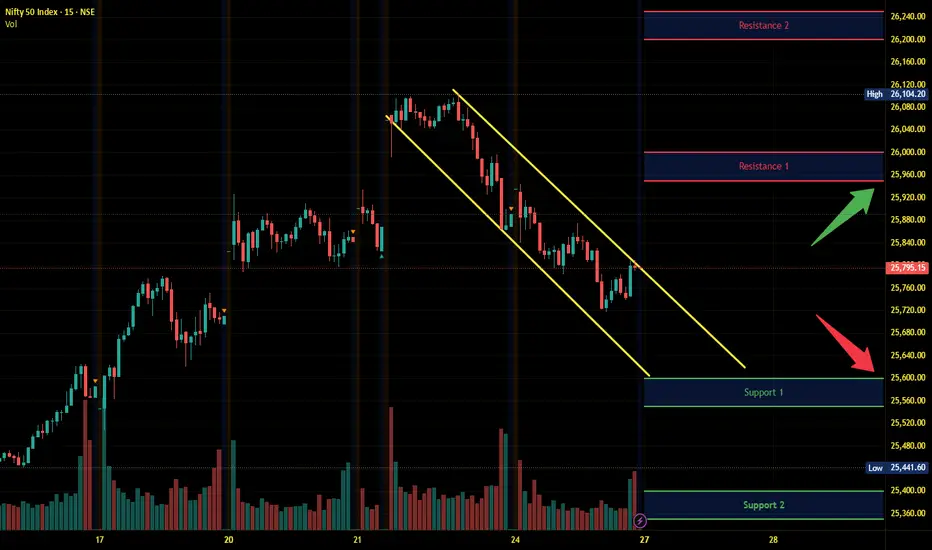
Nifty - Monthly Expiry Analysis Oct 28We had a trending movement in the morning session and consolidation in the afternoon session. Nearby resistance is seen at 26100 - 26120.
Buy above 25940 with the stop loss of 25890 for the targets 25980, 26020, 26080, 26120 and 26160. This scenario will work if the price opens above 25900 and shows bullish strength.
As per the daily chart, the price is bullish.
Sell below 25840 with the stop loss of 25890 for the targets 25800, 25760, 25720, 24680 and 25620. This scenario will work if the price shows a strong bearish sign in the zone 25900 to 26000.
Always do your analysis before taking any trade.

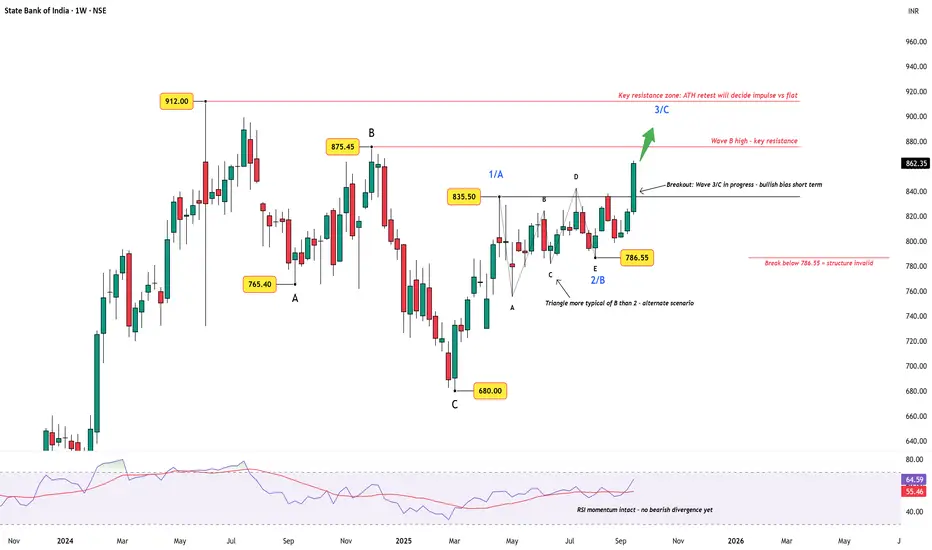
State Bank of India – Breakout, but With CheckpointsWeekly Chart View
State Bank of India has staged a strong breakout above the consolidation zone near ₹835, with weekly RSI showing healthy momentum and no bearish divergence yet. This breakout suggests that Wave 3/C is in progress , keeping the short-term outlook bullish.
Key Observations:
Wave 2/B: The recent sideways move looks like a triangle. While triangles are unusual for Wave 2, they are common in Wave B — raising the possibility that this could be part of a larger corrective flat.
Resistance Levels: Immediate resistance sits at the Wave B high (₹875.45) , followed by the all-time high (₹912). The ATH retest will be critical in determining whether the structure continues impulsively or morphs into a flat.
Support & Invalidation: The breakout remains valid as long as price stays above ₹786.55 (Wave 2/B low). A decisive break below this level would invalidate the current bullish structure and force reevaluation.
Momentum: RSI is supportive, showing strength and no sign of divergence yet.
Summary:
The bias remains bullish in the short term , but this rally will be tested at the higher resistance levels. If the stock pushes through the ATH, we may confirm an impulsive sequence. If not, a 3-3-5 flat could be in play. Either way, this is a key checkpoint zone for SBI.
Disclaimer: This analysis is for educational purposes only and does not constitute investment advice. Please do your own research (DYOR) before making any trading decisions.
SHREE CEMENT LIMITEDSSL (Sell-side Liquidity)
The chart shows a sweep below previous lows (SSL).
This indicates liquidity grab — where stops below that level were taken before price reversed.
This often signals the end of a bearish move and the beginning of a bullish structure shift.
FVG (Fair Value Gap)
A small imbalance (gap) formed after a strong bullish candle.
Price tends to revisit these gaps before continuing in the intended direction (in this case, upward).
BSL (Buy-side Liquidity)
Marked near the previous swing high.
This is a potential target zone, as the market may seek to take out liquidity above that level once bullish momentum resumes.
Order Block (OB)
The gray shaded region is marked as an Order Block — the last bearish candle before a strong bullish move.
Price has revisited this zone (currently trading within it), indicating a potential area of institutional buying interest.
Market Bias Bullish (Reversal Likely)
Key Support ₹28,400 – ₹28,800 (Order Block)
Short-Term Target ₹30,400
Extended Target ₹31,600+ (BSL zone)
Invalidates Bullish View Close below ₹28,300

Nifty Intraday Analysis for 27th October 2025NSE:NIFTY
Index has resistance near 25950 – 26000 range and if index crosses and sustains above this level then may reach near 26200 – 26250 range.
Nifty has immediate support near 25600 – 25550 range and if this support is broken then index may tank near 25400 – 25350 range.
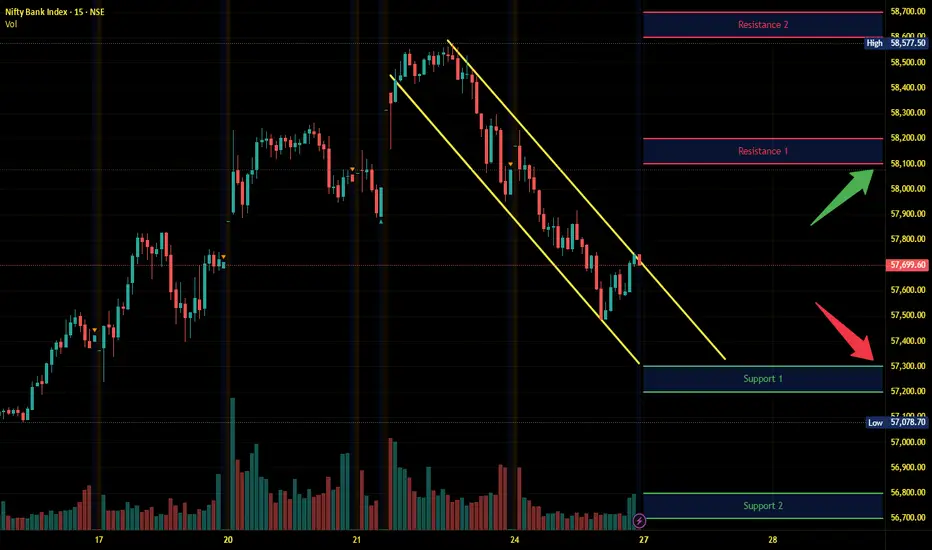
Banknifty Intraday Analysis for 27th October 2025NSE:BANKNIFTY
Index has resistance near 58100 – 58200 range and if index crosses and sustains above this level then may reach near 58600 – 58700 range.
Banknifty has immediate support near 57200 - 57100 range and if this support is broken then index may tank near 56800 - 56700 range.
Finnifty Intraday Analysis for 27th October 2025 NSE:CNXFINANCE
Index has resistance near 27550 - 27600 range and if index crosses and sustains above this level then may reach near 27750 - 27800 range.
Finnifty has immediate support near 27200– 27150 range and if this support is broken then index may tank near 27000 – 26950 range.

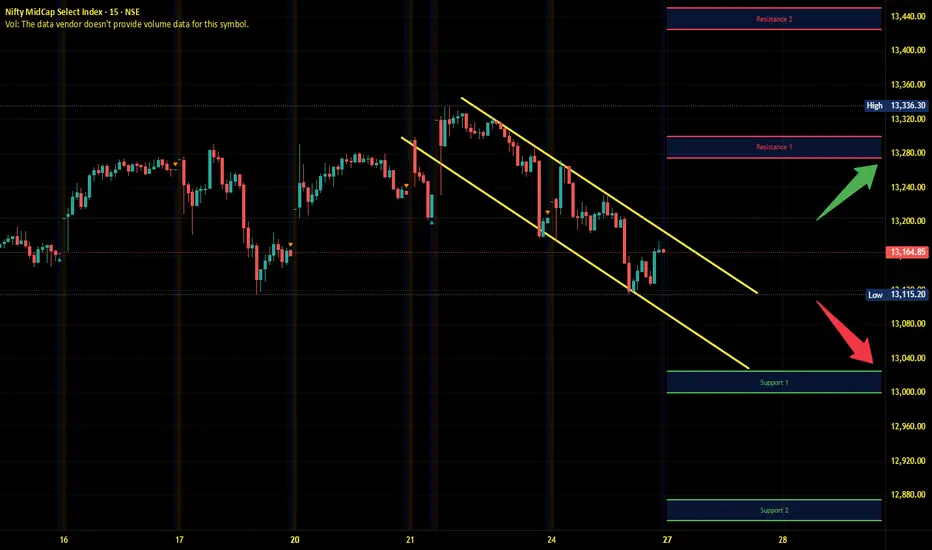
Midnifty Intraday Analysis for 27th October 2025NSE:NIFTY_MID_SELECT
Index has immediate resistance near 13275 – 13300 range and if index crosses and sustains above this level then may reach 13425 – 13450 range.
Midnifty has immediate support near 13025 – 13000 range and if this support is broken then index may tank near 12875 – 12850 range.
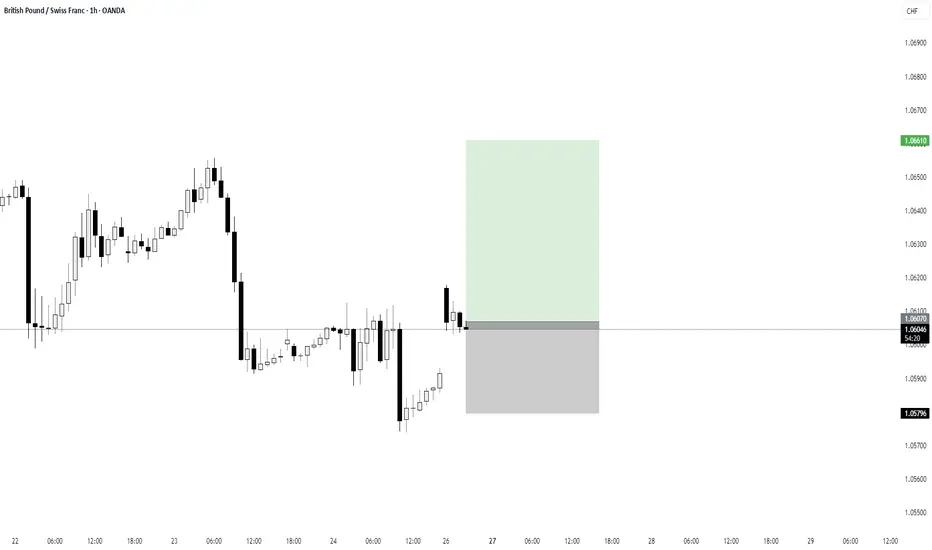
GBP/CHF | 1H AnalysisPrice has recently swept liquidity beneath the previous low and reacted from a demand zone within the overall bullish structure.
A lower timeframe break of structure confirms potential short-term bullish momentum.
Currently, price is consolidating near the entry zone, with a favorable risk-to-reward setup targeting the previous supply area.
Entry: 1.0605
Stop Loss: 1.0579 (below structural low)
Take Profit: 1.0658 (previous supply / liquidity area)
Bias: Short-term bullish continuation
If price maintains structure and holds above the mitigation zone, further upside expansion is anticipated.
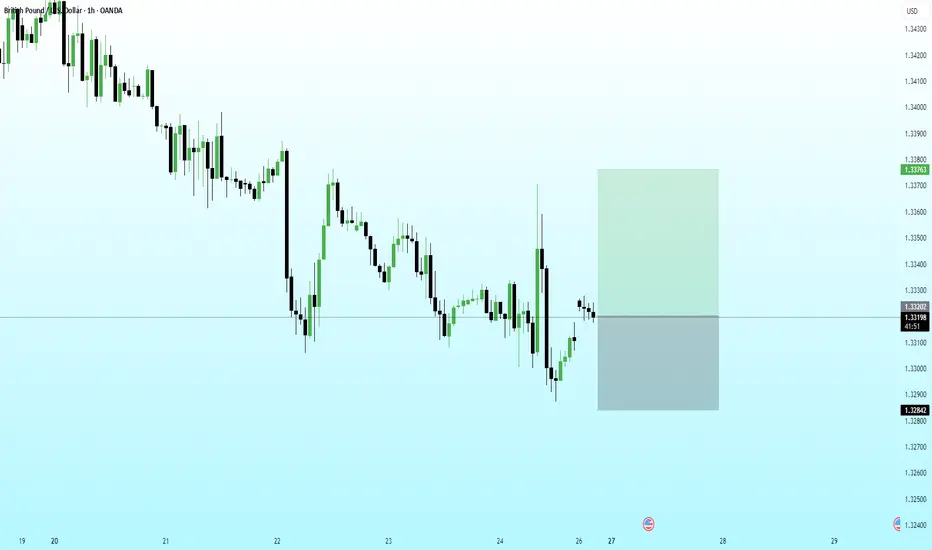
GBP/USD | 1H AnalysisPrice swept liquidity below the recent low and reacted strongly from a discount demand zone.
A bullish displacement followed, signaling a potential reversal in structure.
Currently, price is forming a retracement into the mitigation area — offering a potential continuation to the upside.
Entry: 1.3318
Stop Loss: 1.3284 (below structural low)
Take Profit: 1.3376 (previous supply / liquidity resting above)
Bias: Bullish short-term reversal within corrective structure
If price sustains above the mitigation zone, expecting expansion toward the 1.3370–1.3380 liquidity zone.
CUMMINSIND ROUNDING BOTTOM BREAKOUTCumminsind breaking rounding bottom weekly
with good volume building up last few week
RSI above 60,trading above 20 ema
q2 result on 6th nov
immediate target 4500
NO BUY/SELL RECOMENDATION

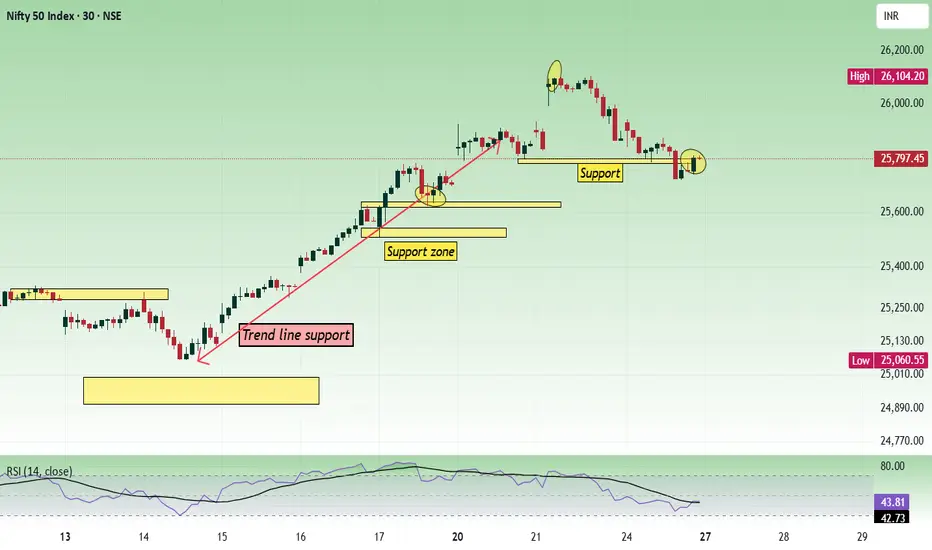
Nifty - Weekly analysis Oct 27 to Oct 31The price faced resistance at the 26100 - 26120 zone and fall down. Important support levels are 25600 and 25800. 25500 is a psychological level.
If the price opens flat, buy above 25820 with the stop loss of 25760 for the targets 25860, 25900, 25960, 26020, 26080, 26120 and 26180.
Sell below 25700 with the stop loss of 25760 for the targets 25640, 25600, 25560, 25520, 25480 and 25420.
We are having nearby support levels, namely 25500, 25600, and 25800. The price can change direction and become volatile in that area.
Always do your analysis before taking any trade.
Plan |Gold Gradually Accumulating, Ready for a Rebound Wave?🔍 Market Context
After reaching the historical peak ATH GOLD 4,371 USD , gold underwent a deep correction, breaking the short-term bullish structure (BoS) and retesting the OB Bearish zone above .
However, since the price returned to the 4,040 – 4,060 USD area, the market has clearly shown signs of liquidity absorption ($$$) and maintained an internal uptrend line, indicating that buying momentum is returning.
The current structure suggests gold is in a re-accumulation phase before forming a medium-term rebound wave towards the 4,185 → 4,243 USD zone.
The buyers hold the advantage as long as the price does not break the main support trendline.
💎 Key Technical Structure
Support Zone: 4,040 – 4,060 USD → a strong support zone confluencing with the trendline, where institutional buying forces have appeared.
Support Trendline: connecting the series of higher lows from 15/10 → the short-term trend remains bullish.
Liquidity Zone $$$: 4,060 – 4,080 → supply absorption zone, confirming its role as a “price base”.
Resistance Zone: 4,149 – 4,185 → the first resistance zone to break to confirm the recovery momentum.
Target FVG / Supply Zone: 4,243 – 4,250 → potential profit-taking zone or point to consider reversal.
Current structure:
→ Short-term: bullish corrective move.
→ Medium-term: potential for forming an extended recovery wave if it holds above 4,040 USD.
📈 Trading Scenarios
1️⃣ BUY Setup – Retest Trendline / Liquidity Zone 4,060 USD
Entry: 4,060 – 4,070
SL: 4,035
TP1: 4,149
TP2: 4,185
TP3: 4,243
✅ Condition:
Price touches the trendline or liquidity zone 4,060 and shows a bullish reversal signal (rejection / bullish engulfing).
➡️ This is a high-probability setup, confluencing the trendline structure + liquidity support zone, often where large buyers re-enter the market.
2️⃣ BUY Setup – Break & Retest resistance zone 4,149 USD
Entry: 4,149 – 4,155
SL: 4,130
TP1: 4,185
TP2: 4,243
✅ Condition:
Wait for the price to break the resistance zone 4,149 with strong volume, then lightly retest without closing the candle below 4,130.
➡️ Trend-following setup – confirms the return of buying momentum and extends the target to the FVG zone 4,243 USD.
3️⃣ SELL Setup (Scalp Reaction) – FVG 4,243 USD
Entry: 4,240 – 4,245
SL: 4,255
TP: 4,185 → 4,150
✅ Condition:
Only execute if there is a strong reaction at FVG 4,243 without a continuation break signal.
➡️ Short-term technical sell – exploiting the supply zone reaction, do not hold the position long.
⚠️ Risk Management
Prioritise trading in the buy direction, avoid selling against the main trend.
If H2 closes the candle below 4,035 → bullish scenario invalid, wait for a new structure.
Do not FOMO buy in the middle range (4,090–4,130).
Keep moderate volume, move SL to breakeven when the price exceeds 4,149.
💬 Conclusion
Gold is in an ascending re-accumulation phase after a strong decline.
As long as the price holds the trendline and support zone 4,040 – 4,060 USD, there is a high chance gold will rebound following the liquidity + breakout retest model, with the main target being 4,185 → 4,243 USD .
If it breaks through 4,243 USD, the market may trigger a stronger recovery momentum towards 4,300 – 4,340 USD .
👉 Reasonable Strategy:
Buy 4,060–4,070 → TP 4,185 / 4,243 USD
Add Buy when breaking 4,149 USD with volume confirmation.
Technical Sell 4,243 USD if there is no signal to break higher.
🔥 “As long as 4,040 holds, gold remains in accumulation — patience will pay.”
⏰ Timeframe: 2H
📅 Update: 27/10/2025
✍️ Analysis by: Captain Vincent

BANCOINDIA Testing Powerful Demand Zone + Breakout Retest 🧠 Understanding the Smart Money Footprints 🧠
Demand and supply zones are not just colorful boxes on a chart — they represent the footprints of smart money . When institutions buy, they don’t enter all their orders at once like retail traders do. Instead, they accumulate positions in parts — leaving behind a visible trail that we can identify on charts through price imbalances. These imbalances structures — form demand and supply zones .
When price returns to these zones, it’s essentially revisiting the footprints of big players — the levels where unfilled institutional orders might still exist.
In BANCOINDIA, we can clearly see this institutional footprint. The stock is now trading near a high-quality demand zone . The structure here is clean and powerful — a perfect Rally–Base–Rally (RBR) formation.
The leg-out candle that formed this demand zone had strong follow-through and even broke past the previous all-time high , confirming intense buying pressure. Now that price is revisiting this zone, it’s showing potential for a fresh upside move.
📉 Traditional Technical Lens 📉
Let’s now analyze BANCOINDIA through the classical technical perspective.
The stock had earlier broken a significant resistance level with massive bullish volume . That breakout confirmed strong demand participation. Now, price is retracing back toward that same level — which, according to the Law of Polarity , should act as new support.
Moreover, the 50 EMA is aligning beautifully beneath the price. The ongoing pullback is approaching both the EMA 50 and the previous resistance — a confluence that further strengthens the bullish bias.
If we observe the volume , we can see that the selling volume is drying up compared to the prior rally. This shows a lack of bearish momentum, increasing the probability of a bounce from current levels.
🎯 Confluence & Trading View 🎯
When we combine both lenses — Demand & Supply Zone Analysis and Traditional Technical Analysis — we find strong confluence:
The stock is sitting inside a powerful Rally–Base–Rally Demand Zone .
The previous resistance has now turned into support (Law of Polarity).
The 50 EMA is acting as an additional support layer.
Volume analysis shows selling pressure drying up.
Together, these signals suggest a high-probability reversal zone. If BANCOINDIA respects this area, we could see the next leg of rally begin soon.
However — as all seasoned traders know — no setup is 100% guaranteed. Risk management is your best friend. Always define your stop loss before thinking about your target. Even the strongest setups can fail, and protecting your capital must come first.
Identify your demand zone and entry level precisely.
Place your stop loss logically below the zone.
Aim for a 1:2 or 1:3 risk-to-reward ratio .
Let the market do the work — not emotions.
"In trading, patience and risk control build fortunes — not predictions."
Lastly, Thank you for your support, your likes & comments. Feel free to ask if you have questions. 🚀
📚 This analysis is purely for educational purposes and is not intended as a trading or investment recommendation. I am not a SEBI registered analyst.

Is the SPX500 Correction OVER ?Analysed 1Hr chart:
SPX 500 is correcting from around FEB 25th
It has has been correcting in complex ABC pattern
Within last Leg that is C, it has been doing W-X-Y correction.
Will it have one more Z leg ?
YES : If it retraces/does not cross previous high
When this structure will be invalid ?
When a hourly close is below 5096.
What is the road map if the current structure holds good ?
Wave-3 ~6000
Wave-4 Correction , back to 5500 ??
Wave-5 ~6200
Assumption: It follows plotted channel
Times/Shape of pattern will get extended if time correction follows.

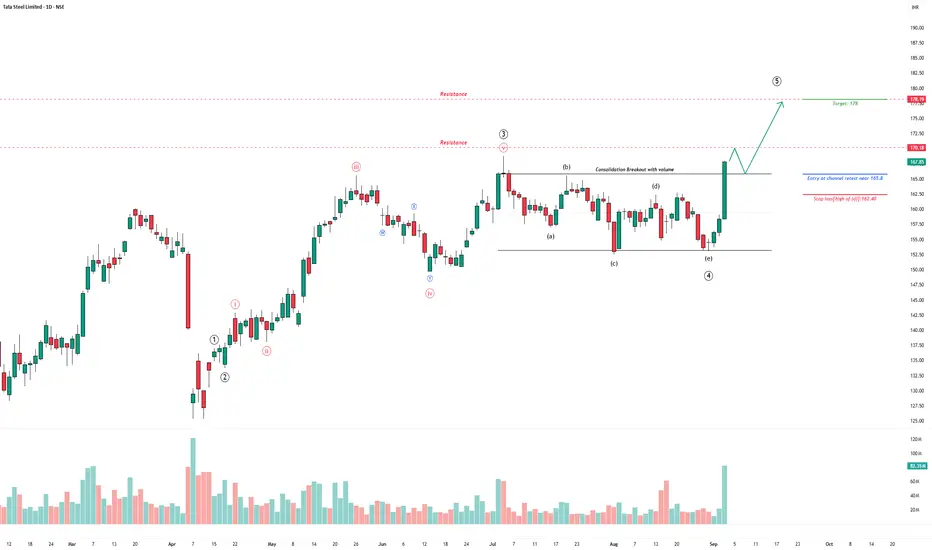
Tata Steel – Consolidation Breakout with VolumeAfter weeks of sideways price action, Tata Steel has broken out of its consolidation phase with a powerful surge in volume.
The breakout candle not only cleared the consolidation range but did so with conviction — volume spiked to multi-week highs, confirming participation. If price holds above the breakout zone, immediate resistances are lined up at ₹170 and ₹178.
Trade Plan
Entry on retest near ₹165.8.
Target: ₹178.
Stop-loss: ₹162.4.
Invalidation
A close below ₹162.4 would weaken the breakout narrative and invalidate this setup.
Disclaimer:
This analysis is for educational purposes only and does not constitute investment advice. Please do your own research and consult a financial advisor before making any trading decisions.
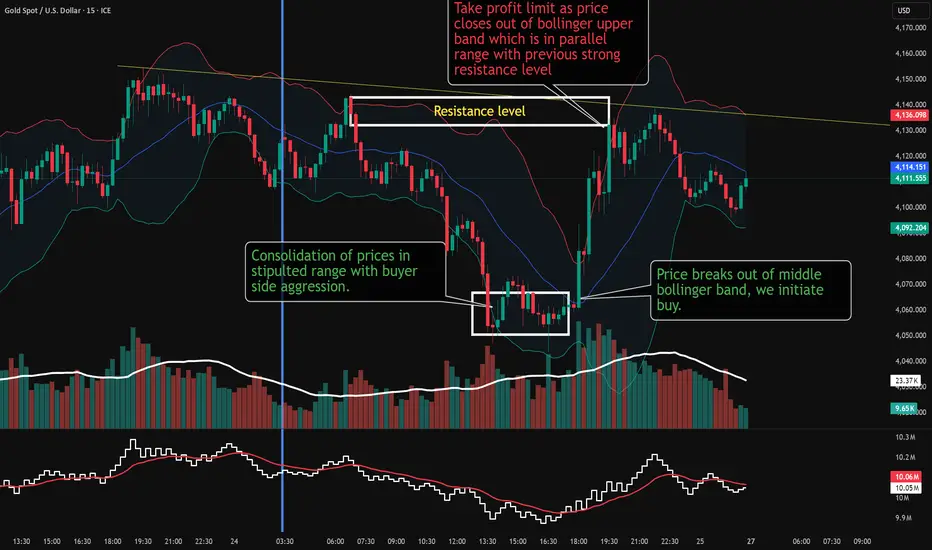
How to Initiate buy side with volume accumulation confirmation.This chart illustrates a structured educational trade analysis on the XAU/USD (Gold vs US Dollar) instrument, showing how a professional analyst guides students through a trade setup using volume, price action, and Bollinger Bands.
Market Context
The chart begins during a high-volatility news event from the USA. Post-news, a large bullish candle formed with significant **impulse buyer volume**, indicated by the sharp price rise and high-volume bars. These **impulse buyers** enter aggressively after news releases but tend to **book profits soon after**. Analysts refer to them as opportunity creators because their trading footprints (volume clusters) reveal strong demand zones, which can later serve as high-probability entry points.
Identifying Opportunity Zones
The analyst points out that volume added beyond previous clusters signifies **fresh bullish participation**, confirming that strong buyers entered the market. This leaves a "volume footprint" — a strong **support level** around the base of that bullish candle. The teaching point here is that whenever price later revisits such a volume zone, it becomes a **potential re-entry area** aligned with institutional activity.
Trade Execution
Later, the same volume levels were retested, as shown in the chart. When price revisited this zone with declining bearish pressure and stable volume, the analyst initiated a **buy trade**. This buy aligns with:
- Retest of volume-supported demand area
- Lower band support of Bollinger Bands
- Confirmation of slowing volatility
This setup is a classic “volume-backed retest entry.”
Profit Booking and Volatility Analysis
As price climbed higher, **profits were booked** near the upper Bollinger Band, signaling volatility slowdown. The analyst explains that this is where price expansion peaks, and short-term traders ideally reduce or close positions to lock in profits. The Bollinger Band compression afterward suggests reduced volatility and temporary consolidation.
Key Educational Insights
1. Impulse volume after major news creates future trade opportunities.
2. Volume footprints** reveal institutional trading zones; retests of these zones are high-probability entries.
3. Bollinger Bands help identify overextension (for exits) and contraction phases (preparing for next moves).
4. Combining **volume + structure + volatility** improves timing and conviction in trade entries and exits.
In summary, the analyst demonstrates how to transform raw post-news volatility into an educated, systematic trade using volume behavior and volatility tools to guide student traders in professional decision-making.
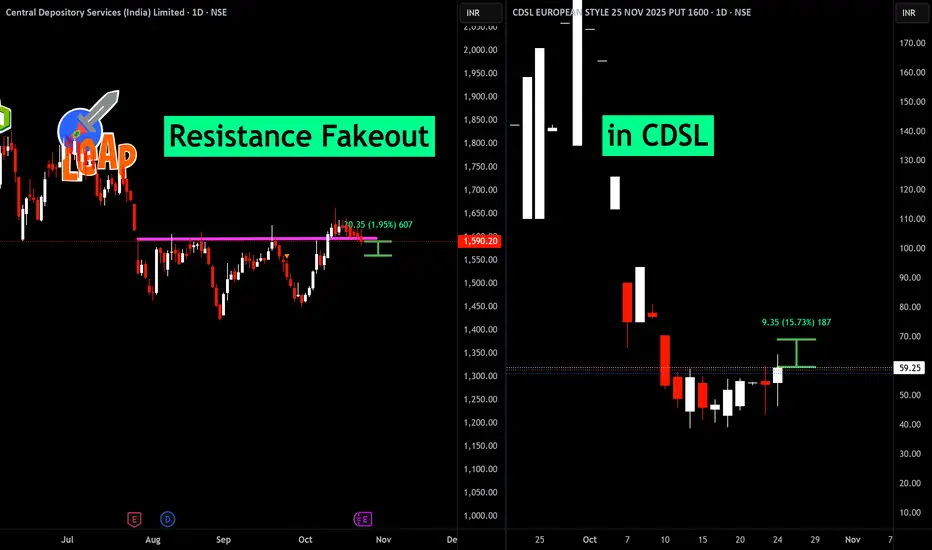
Resistance Fakeout in CDSLAfter a persistent rally, Central Depository Services (India) Limited approached a significant resistance zone near 1,590.20. The initial breakout attempt saw price closing above resistance, but follow-through was absent as sellers quickly regained control. This resulted in a classic false breakout or failed breakout pattern, with price slipping back below the resistance level and triggering a pullback.
False breakouts at key resistance happen when bullish momentum is not sustained, often trapping late buyers and prompting profit-taking. As evident here, the failed breakout signals possible short-term weakness and warrants caution for fresh longs unless the stock can convincingly reclaim and hold above the former resistance. Short-term traders may look for downside opportunities until renewed strength is visible above 1,590.20.
Risk management is essential in such setups as volatility around failed breakouts can be high. Monitor for support at lower levels and watch price behavior around previous resistance for directional clues.
HFCL Cmp 77.74 Ascending Triangle PatternHFCL Cmp 77.74 Dated 24-10-2025
1. Ascending Triangle Pattern BO @ 79
Buy @ Cmp for riskers trades
Safe traders buy above 79 SL 75 target 80-81-83-84-85-87-88-89
It is just a view, please trade at your own risk.

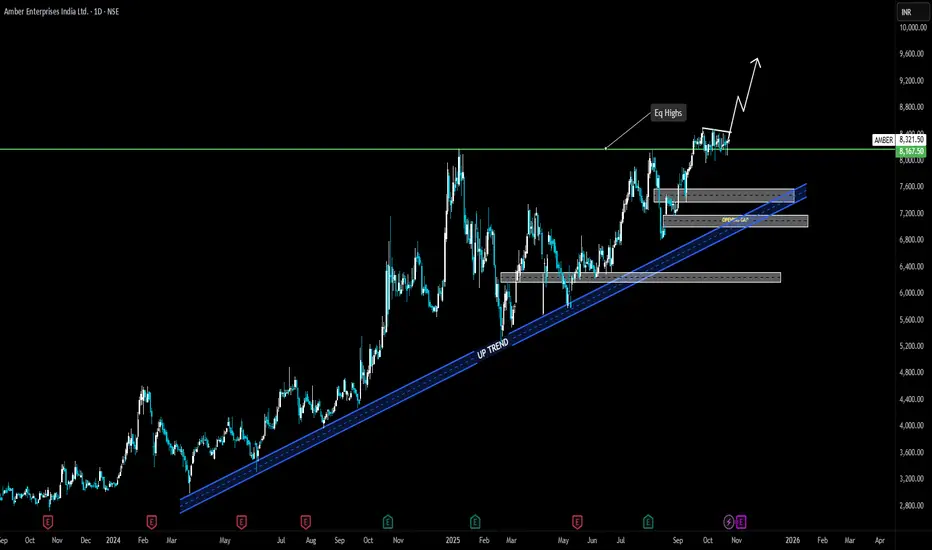
AMBER ENTERPRISESTrend:
The stock is maintaining a strong uptrend, respecting a well-defined ascending trendline that has been acting as dynamic support since early 2024. Higher highs and higher lows confirm bullish market structure.
Support Zones:
Primary demand zone near ₹7,400–₹7,600 aligns with the uptrend line.
Secondary demand zone around ₹6,800–₹7,000, near an open gap, offering strong positional support.
Resistance / Breakout Level:
The price is currently testing the ₹8,150–₹8,200 resistance zone, which aligns with previous equal highs (Eq Highs).
A confirmed breakout above this zone could trigger strong bullish momentum.
Price Action Setup:
The chart shows a tight consolidation just below resistance, indicating accumulation before breakout. If price closes decisively above ₹8,200 with volume, continuation toward ₹9,000–₹9,500 is likely.
Outlook:
As long as the price sustains above the uptrend line and ₹7,600 zone, the bias remains bullish. A clean breakout could mark the start of a new impulse wave