XAUUSD LongFriday ending session setting the Directional bias for next week. Monday it can start with retracement to the demand zone and then continue to push up to target the external liquidity, which is Daily high or prevision trading day as well as day before that. Since both previous day made Equal high.
1. Daily closing with Big price rejection.
2. We have change of character in 1min, Leaving behind imbalance as well as Equal low.
Support and Resistance

XAUUSDFunny I was just checking in gold saw a good short opportunity best part smashed the TP very fast please have a look at below idea

BTCMarket Structure
A clear Break of Market Structure (BMS) occurred to the upside, confirming a shift from bearish to bullish momentum.
The chart shows a sequence of Higher Highs (HH) and Higher Lows (HL) — classic uptrend confirmation.
The latest HH was formed around 111,800–112,000, and price is consolidating just below that zone — a sign of accumulation before a potential continuation.
Key Zones
Demand Zones (Potential Reentry Areas):
110,400 – 110,000 USD
109,800 – 109,600 USD
These zones represent unmitigated order blocks where bulls may defend positions if price retraces.
Resistance / Liquidity Area:
111,800 – 112,000 USD — short-term liquidity above current price; a breakout here could lead to another impulse leg toward 113,200 – 113,600 USD.
Outlook
As long as the structure maintains higher lows, bias remains bullish.
Price may retest the 110,400 – 110,000 zone before continuation.
A confirmed break and close above 112,000 can trigger momentum toward 113,600–114,000.
Summary
✅ Bias: Bullish
📈 Possible Long Entry: Around 110,400 – 110,000 (on bullish reaction)
🎯 Targets: 112,000 → 113,200 → 114,000
❌ Invalidation: Break below 109,600 would weaken the bullish structure.

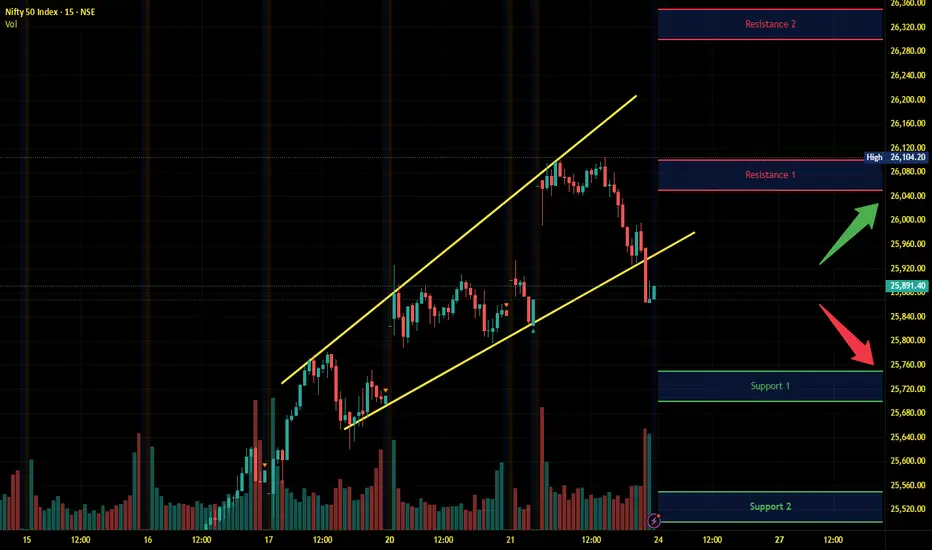
Nifty Intraday Analysis for 24th October 2025NSE:NIFTY
Index has resistance near 26050 – 26100 range and if index crosses and sustains above this level then may reach near 26300 – 26350 range.
Nifty has immediate support near 25750 – 25700 range and if this support is broken then index may tank near 25550 – 25500 range.
Banknifty Intraday Analysis for 24th October 2025NSE:BANKNIFTY
Index has resistance near 58500 – 58600 range and if index crosses and sustains above this level then may reach near 5900– 59100 range.
Banknifty has immediate support near 57700 - 57600 range and if this support is broken then index may tank near 57200 - 57100 range.

Finnifty Intraday Analysis for 24th October 2025 NSE:CNXFINANCE
Index has resistance near 27750 - 27800 range and if index crosses and sustains above this level then may reach near 27975 - 28025 range.
Finnifty has immediate support near 27350– 27300 range and if this support is broken then index may tank near 27125 – 27075 range.

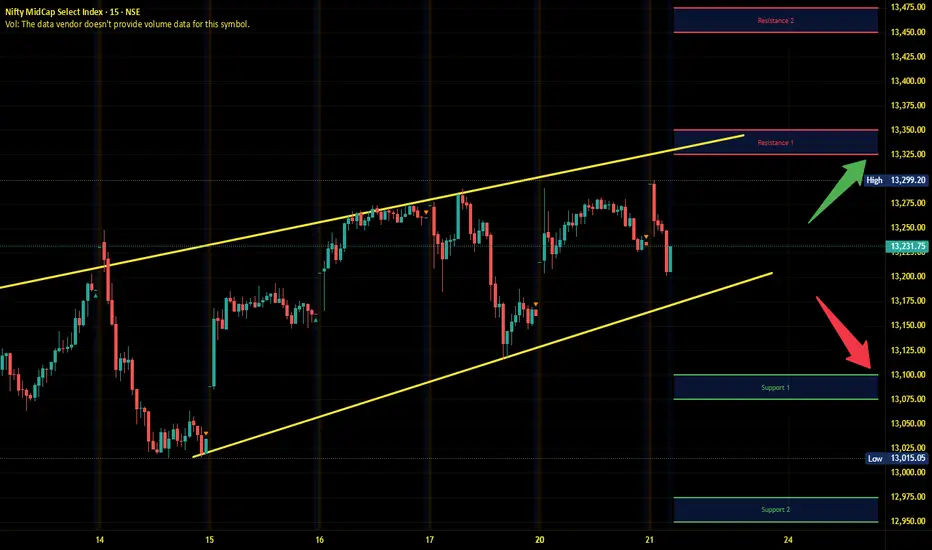
Midnifty Intraday Analysis for 24th October 2025NSE:NIFTY_MID_SELECT
Index has immediate resistance near 13325 – 13350 range and if index crosses and sustains above this level then may reach 13450 – 13475 range.
Midnifty has immediate support near 13100 – 13075 range and if this support is broken then index may tank near 12975 – 12950 range.

Gold Stuck Near ₹4,100 Ahead of CPIMarket Pulse:
Gold is holding steady around ₹4,100, caught between uncertainty and opportunity as traders brace for the US CPI release and new developments in US–China trade talks.
The yellow metal has paused its recovery from ₹4,050 → ₹4,160, while the US Dollar and bond yields edge higher amid renewed geopolitical tension and surging oil prices.
This is the classic “calm before volatility” moment — the market is simply waiting for data to decide the next wave.
If CPI comes in softer or trade talks disappoint, liquidity could flood back into gold, breaking above ₹4,155–₹4,160 and opening the path toward ₹4,215 → ₹4,261.
But a strong CPI surprise could flip sentiment fast — dragging price back into the ₹4,056 and ₹4,018 buy zones, where the next reaction will decide direction.
📊 Technical Outlook (M30)
Price continues to coil within a tight structure between ₹4,100 – ₹4,155, forming a “spring compression” right below trendline resistance.
Market flow suggests accumulation beneath ₹4,100, hinting that liquidity is building before the next expansion.
Key Structure Zones:
Resistance Pivot: ₹4,154 – ₹4,155 → Key breakout level
Breakout Support (CP Zone): ₹4,056 – ₹4,060
Liquidity Buy Zone: ₹4,018 – ₹4,020
Sell Zone (Fibo Reaction): ₹4,215 – ₹4,261
🎯 Trading Plan – MMFLOW Style
🔹 BUY PLAN – Reaccumulation Base
Entry: ₹4,056 – ₹4,060
Stop Loss: ₹4,045
Targets: ₹4,100 → ₹4,140 → ₹4,155
Focus on reaction candles & liquidity grab confirmation.
🔹 BUY PLAN – Liquidity Sweep Setup
Entry: ₹4,018 – ₹4,020
Stop Loss: ₹4,005
Targets: ₹4,056 → ₹4,100 → ₹4,150
If liquidity sweeps this zone clean, watch for a sharp recovery flow.
🧭 Summary – MMFLOW View
Gold is in “decision mode”, waiting for CPI and macro catalysts to trigger the next trend.
The structure stays neutral-bullish as long as price holds above ₹4,056.
A confirmed breakout above ₹4,155 may unlock a fast rally toward ₹4,215–₹4,260, while a break below ₹4,018 could open the door for one more liquidity flush.
⚜️ MMFLOW Bias: No need to predict the move — just follow the flow when liquidity confirms.
📊 Do you expect gold to break higher after CPI, or trap traders before reversing?

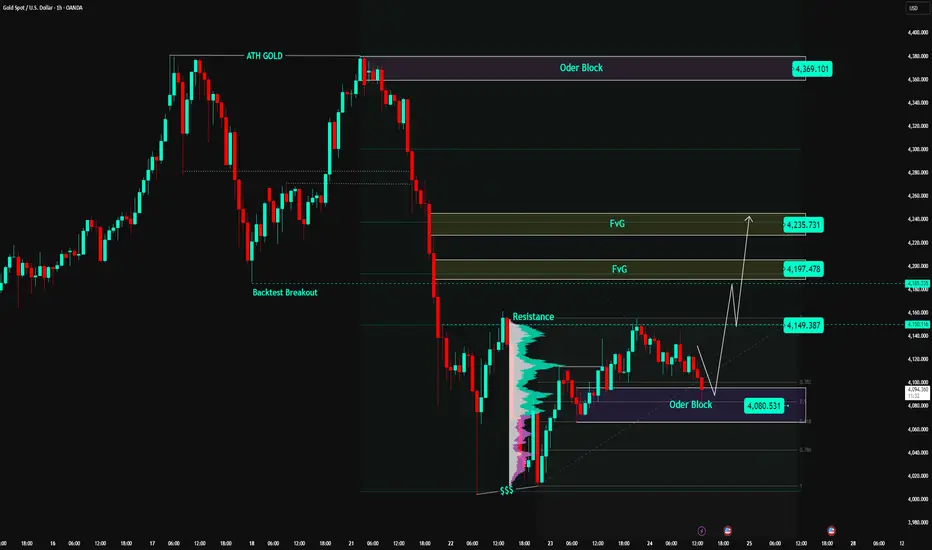
Gold Maintains Re-Accumulation Above OB, Wave Recovery Target🔍 Market Context
After a sharp decline from the ATH GOLD 4,371 USD peak, gold has completed a liquidity sweep around the 4,010 USD bottom and formed a stable accumulation zone above the Order Block 4,080 USD .
The buyers are gradually regaining control as the price holds firm at the OB and shows signs of short-term supply absorption.
The Resistance 4,149 USD zone is currently a temporary barrier; if successfully breached – gold could trigger a recovery wave towards the Fair Value Gap (FVG) zones at 4,197 and 4,235 USD.
The current price structure leans towards a bullish retracement structure – prioritising buy orders when the price reacts from the active demand zone.
💎 Key Technical Structure
Order Block (OB): 4,080 – 4,085 USD → crucial support zone, confluence with Fibo 0.786, serving as an accumulation base.
Resistance (Breakout Level): 4,149 USD → confirmation zone for upward direction, requires decisive breakout.
FVG1: 4,197 – 4,210 USD → first target, short-term supply test zone.
FVG2: 4,225 – 4,235 USD → confluence resistance zone, potential profit-taking for recovery wave.
ATH GOLD: 4,371 USD → long-term resistance, expanded target if the market maintains strong buying flow.
Overall Structure:
→ Short-term: bullish recovery.
→ Medium-term: re-accumulation after a deep correction phase.
📈 Trading Scenarios
1️⃣ BUY Setup #1 – Retest Order Block 4,080 USD
Entry: 4,080 – 4,085
SL: 4,060
TP1: 4,149
TP2: 4,197
TP3: 4,235
✅ Condition:
Wait for the price to retrace to the OB zone and show clear bullish reversal signals (rejection or bullish engulfing).
➡️ This is a classic “Buy the Dip” setup – aligning with the recovery structure, with high probability due to OB + strong Fibonacci confluence.
2️⃣ BUY Setup #2 – Break & Retest zone 4,149 USD
Entry: 4,149 – 4,155
SL: 4,130
TP1: 4,197
TP2: 4,235
✅ Condition:
Price breaks through the 4,149 resistance zone with good volume and lightly retests, without closing candles below 4,130.
➡️ Trend-following setup, aligning with the flow when the market confirms a short-term resistance break.
3️⃣ SELL Scalp – Reaction at FVG 4,235 USD (short-term)
Entry: 4,230 – 4,235
SL: 4,245
TP: 4,197 → 4,150
✅ Condition:
If gold reacts weakly and there is no follow-up buy at the FVG2 zone → a short-term technical sell can be considered on pullback.
➡️ Short-term sell – only execute if there is no confirmation of continued upward movement.
⚠️ Risk Management
Prioritise BUY according to the main structure (retracement bullish).
Do not FOMO buy within the zone (4,110 – 4,130).
If H1 closes candles below 4,060 → invalidates the bullish scenario, wait for structure reconstruction.
Maintain moderate order size when trading around the FVG zone to avoid noise.
💬 Conclusion
Gold is in the process of re-accumulation and preparing for a technical recovery phase.
As long as the price holds the Order Block 4,080 USD zone, the recovery structure remains valid, and the feasible target is 4,197 → 4,235 USD .
If it breaks through 4,235 USD, the market could extend the rally towards the 4,300 – 4,370 USD (ATH GOLD) zone.
👉 Reasonable Strategy:
Buy 4,080 → TP 4,197 / 4,235.
Buy more when 4,149 break confirms upward direction.
Sell short reaction at 4,235 if there is no signal of continued break.
🔥 “Patience at the base — profits come to those who wait for the OB reaction.”
⏰ Timeframe: 1H
📅 Update: 24/10/2025
✍️ Analysis by: Captain Vincent
XAUUSD SHORTAs per Trendline break I was looking to short gold was waiting for right opportunity then I lowered the time frame saw Head and shoulder pattern plus gold was already favouring for short so got this short term trade idea.
Tp around
4085
4075

Quess Corp - Monthly - Make or BreakWill Quess Corp able to give multifold return in next 6-8 month ? ?
CMP : ~234
SL M Close : 225
Up Side ?
expert's please share your thoughts :)

XAU/USD – Gold Completes Liquidity Sweep Phase🔍 Market Context
After a prolonged decline from the peak ATH GOLD 4,371 USD , gold has formed a Liquidity Sweep around the 4,010 USD zone, where the selling side was completely absorbed by strong buying pressure from the demand zone below.
The price structure shows signs of a Change of Character (ChoCH) for the first time since the peak, along with the appearance of an Order Block (OB) 4,081 USD – the starting point for a new upward momentum.
This indicates a high possibility that the market is entering a technical retracement phase , aiming to retest the FVG resistance zone above, or even expand back to the ATH zone if buying pressure continues.
💎 Key Technical Structure
Liquidity Sweep: 4,010 – 4,020 USD → liquidity sweep bottom zone, increased volume appears, confirming absorption of sell orders.
Order Block (OB): 4,081 – 4,090 USD → starting zone for recovery momentum; if the price retests this zone and holds → confirmation signal for an upward phase.
Fair Value Gaps (FVG):
• FVG1: 4,196 – 4,210 USD → first target for the recovery wave.
• FVG2: 4,234 – 4,250 USD → next target, confluence of medium-term resistance.
OB | ATH GOLD: 4,370 – 4,380 USD → major resistance zone, previous peak; if the price surpasses → confirmation of a new upward trend.
Current market structure:
→ Short-term: bullish recovery (recovering from the bottom zone).
→ Medium-term: waiting for confirmation to break 4,234 to transition to a complete bullish structure.
📈 Trading Scenarios
1️⃣ BUY Setup #1 – Retest the Order Block 4,081 USD
Entry: 4,081 – 4,085
SL: 4,060
TP1: 4,196
TP2: 4,234
TP3: 4,370
✅ Conditions:
Wait for the price to retest the OB 4,081 zone, a confirmation signal for an increase appears (rejection / engulfing bullish) or a small BoS on M15.
➡️ This is a classic buy-the-dip setup after a Liquidity Sweep – high probability due to the confluence of OB + ChoCH + strong demand zone.
2️⃣ BUY Setup #2 – Break & Retest FVG 4,196 USD
Entry: 4,196 – 4,200
SL: 4,180
TP: 4,234 → 4,370
✅ Conditions:
The price breaks up the first FVG with good volume, then lightly retests without closing candles below 4,180.
➡️ Trend-following setup, following the money flow when the price confirms breaking the short-term resistance zone.
📉 Alternative Scenario – SELL reaction at 4,234 USD (Short-term Scalp)
Entry: 4,234 – 4,240
SL: 4,255
TP: 4,196 → 4,100
✅ Conditions:
If the price reacts strongly and fails at the second FVG without follow-up volume increase → a short adjustment phase may appear.
➡️ Short-term sell, only execute if there is no continuation confirmation at FVG2.
⚠️ Risk Management
Prioritise BUY according to the main recovery trend, only SELL when there is a clear reaction.
Do not FOMO buy in the middle range (4,130–4,180).
If the price closes H1 candles below 4,060 → invalidate the recovery trend, pause all buy orders.
💬 Conclusion
Gold has completed the Liquidity Sweep phase and is signaling a sustainable technical reversal .
Two important zones to monitor:
4,081 USD (OB Zone): first rebound support zone.
4,234 USD (FVG Zone): zone confirming a new upward structure.
If the price holds OB and breaks through FVG, there is a high chance gold will resume its upward momentum towards the 4,370 USD (ATH GOLD) zone.
👉 Reasonable Strategy:
Buy 4,081 USD → TP 4,234 / 4,370 USD.
Sell reaction 4,234 USD only when a clear reversal signal appears.
🔥 “Liquidity has been swept — now it’s time to ride the recovery wave.”
⏰ Timeframe: 1H
📅 Updated: 23/10/2025
✍️ Analysis by: Captain Vincent

XAU/USD – Gold Tests Final Structure Before Deciding New Wave“If the 3,950 USD zone is breached, the long-term uptrend may end.”
🔍 Market Context
After reaching the historic peak ATH GOLD 4,381 USD , gold has sharply corrected and formed a clear Change of Character (ChoCH) on the H1 timeframe.
Currently, the price is technically recovering to the Resistance – FVG – Fibonacci 4,216 USD zone, which was previously a distribution peak.
The sellers are regaining short-term dominance, while the Order Block zone (3,953–3,960 USD) — which was the starting point of the strongest growth on H4/Daily — is becoming the most critical defense line of the uptrend.
If this zone is decisively broken, it is highly likely that the medium-term bullish structure will break and trigger a bearish expansion towards deeper liquidity zones like 3,689 USD.
💎 Technical Analysis
Resistance – FVG – Fib Zone: 4,216 – 4,228 → confluence resistance zone FVG + Fibo 0.618, suitable for sell reaction.
Liquidity Sweep Zone: 4,043 – 4,006 → intermediate liquidity sweep zone, may see a temporary pause.
Order Block | Structural Base: 3,953 – 3,960 → H4 momentum creation zone → ATH; if breached, long-term bullish structure is invalidated.
Liquidity Zone $$$: 3,689 – 3,685 → deep liquidity zone, potential target if OB is broken.
Overall Structure:
→ Short-term: bearish corrective phase.
→ Medium-term: bullish remains if 3,950 is not broken.
📉 Trading Scenarios
1️⃣ SELL Setup – Reaction at 4,216 – 4,228 USD zone
Entry: 4,216 – 4,228
SL: 4,240
TP1: 4,043
TP2: 3,956
TP3: 3,689
✅ Condition:
Wait for a clear reversal signal (strong rejection or bearish engulfing) on H1/M15 at the FVG resistance zone.
➡️ Classic “Sell the Rally” setup – follow the flow post-ChoCH, targeting the key OB zone 3,953 USD.
2️⃣ BUY Setup – Reaction at Order Block 3,953 – 3,960 USD
Entry: 3,956 – 3,953
SL: 3,940
TP: 4,043 → 4,216
✅ Condition:
Price holds OB and a strong reversal signal appears (bullish engulfing / increased volume / small BoS structure turns bullish again).
➡️ This is the decisive zone for the medium-term trend: if it bounces strongly, buyers will regain control; if it breaks, gold enters a new deep decline cycle.
⚠️ Risk Management
Prioritise SELL when price retraces to 4,216 – 4,228 with reversal signals.
BUY at 3,953 only with a clear reaction; if broken, cease all buy orders.
When price closes H4 candle below 3,950 → confirm bearish break, extend target to 3,689 USD.
💬 Conclusion
Gold is testing the Order Block foundation of the long-term uptrend (3,953–3,960 USD) .
If this zone holds, the market may rebound to 4,216 – 4,280;
but if breached, gold is likely to open a deep decline phase towards 3,689 USD – where a large liquidity pool is concentrated at the bottom.
👉 Reasonable Strategy:
Sell 4,216 – 4,228 USD if clear reversal signals appear.
Buy 3,953 – 3,960 USD if strong reaction;
If 3,950 is breached → confirm extended downtrend, prioritise SELL continuation.
🔥 “This Order Block built the last gold rally — if it breaks, the next leg down will be brutal.”
⏰ Timeframe: 1H – reference H4/Daily
📅 Update: 22/10/2025
✍️ Analysis by: Captain Vincent

Nifty Intraday Analysis for 23rd October 2025NSE:NIFTY
A gap up opening is expected as strong signals are emerging about the finalization of the trade deal.
Index has resistance near 26000 – 26050 range and if index crosses and sustains above this level then may reach near 26200 – 26250 range.
Nifty has immediate support near 25700 – 25650 range and if this support is broken then index may tank near 25500 – 25450 range.

Banknifty Intraday Analysis for 23rd October 2025NSE:BANKNIFTY
A gap up opening is expected as strong signals are emerging about the finalization of the trade deal.
Index has resistance near 58400 – 58500 range and if index crosses and sustains above this level then may reach near 58900– 59000 range.
Banknifty has immediate support near 57600 - 57500 range and if this support is broken then index may tank near 57100 - 57000 range.

Finnifty Intraday Analysis for 23rd October 2025NSE:CNXFINANCE
A gap up opening is expected as strong signals are emerging about the finalization of the trade deal.
Index has resistance near 27725 - 27725 range and if index crosses and sustains above this level then may reach near 27950 - 28000 range.
Finnifty has immediate support near 27350 – 27300 range and if this support is broken then index may tank near 27125 – 27075 range.

Midnifty Intraday Analysis for 23rd October 2025NSE:NIFTY_MID_SELECT
A gap up opening is expected as strong signals are emerging about the finalization of the trade deal.
Index has immediate resistance near 13325 – 13350 range and if index crosses and sustains above this level then may reach 13450 – 13475 range.
Midnifty has immediate support near 13100 – 13075 range and if this support is broken then index may tank near 12975 – 12950 range.
US 30 Quick setup US30 As it's been falling recently found this quick setup with small target as you can see small suppy zone , plus breakout gave confirmation for down side moment

XAUUSD – Awaiting a Breakout to Confirm the Next Bullish WaveGold remains under pressure, trading slightly below 4,100 USD/oz despite ongoing geopolitical tensions and weak global sentiment.
On the higher timeframe, the structure still respects its ascending channel, showing no signs of a deep breakdown yet.
During the early Asian session, renewed buying interest has started to emerge, supported by a stable inflow of safe-haven demand.
Technically, price is attempting to form a bullish continuation structure (Dow wave) around the 4,110 zone.
If a breakout above this key level occurs, gold could accelerate toward 4,155, and potentially extend into a corrective bullish wave targeting 4,220–4,260, aligning with the Fibonacci retracement confluence and the CP/OBS sell zone on the chart.
Technical Outlook (M30):
Price action suggests a potential wave recovery structure forming after last week’s steep decline.
The 4,155 level acts as a key inflection point — it will decide whether bulls regain control or bears push for another correction.
Key Levels:
CP Zone Up / Breakout Base: 4,053 – 4,055
Short-Term Key Level: 4,110 – 4,115
Mid-Level Resistance: 4,155 (structure pivot)
Fibo Sell Zone / Wave End Target: 4,220 – 4,263
Trading Plan:
🔹BUY Setup #1
💥Entry: 4,020 – 4,018
❌Stop Loss: 4,010
✔️Take Profit: 4,030 → 4,035 → 4,040 → 4,050 → 4,060 → 4,100
⏸Bias: Reaccumulation Phase (structure support)
🔹BUY Setup #2 (Scalp Play)
🔔Entry: 4,053 – 4,051
❌Stop Loss: 4,043
✔️Take Profit: 4,060 → 4,070 → 4,080 → 4,090 → 4,100 → 4,150
⏸Note: Ideal for intraday traders watching the breakout base.
🔹SELL ZONE (Liquidity Reaction Zone)
📊Entry: 4,263 – 4,265
❌Stop Loss: 4,273
✔️Take Profit: 4,255 → 4,250 → 4,240 → 4,230 → 4,220 → 4,210 → 4,200
⭐️Summary:
Gold continues to consolidate above 4,050, showing signs of early recovery after the recent 3,000-pip correction.
The 4,155 level remains the key pivot for short-term direction — a breakout here could confirm a Wave 3–5 recovery structure, while rejection could bring one more pullback.
Macro and geopolitical uncertainty still favour safe-haven flows, keeping the bullish scenario valid as long as 4,000–4,020 holds.
📊What’s your take — will gold break above 4,155 to start a new bullish wave, or reject and extend the correction further?

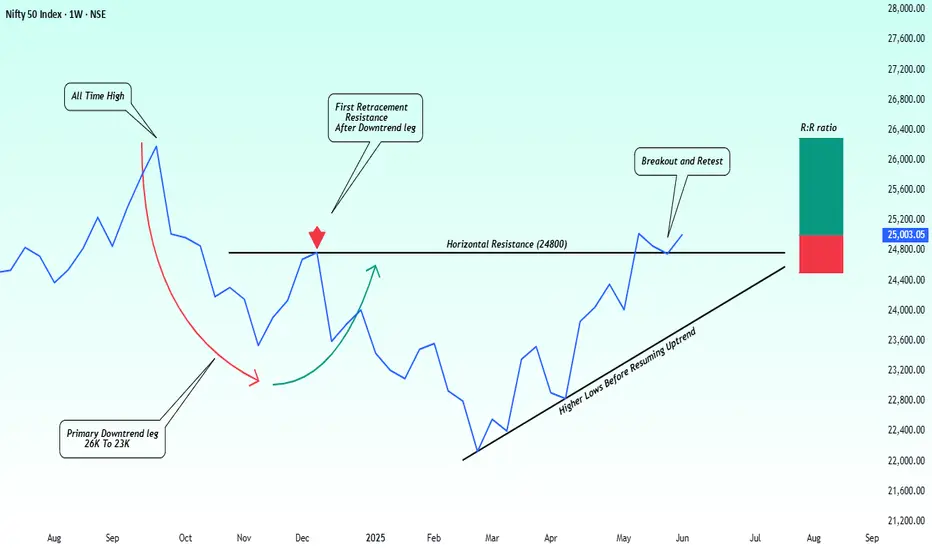
NiftY Weekly: From Primary Downtrend to BreakoutHi Traders, Sharing a clean structural setup spotted on the Nifty weekly chart. Hope this helps you in your planning. Feedback and thoughts are always welcome!
Nifty Weekly Trade Setup — Targeting 26,300--::
Following a significant correction from the all-time high near the 26000 zone Nifty formed a well defined primary downtrend leg bottoming around 22000. What’s developed since is a classic structural shift from distribution → accumulation → potential markup let's discuss.
After the downtrend price attempted a retracement rally, but it was rejected at the prior breakdown zone and creating a clear horizontal resistance. This rejection led to a base formation supported by a series of higher lows, indicating reduced selling pressure and early signs of buyer strength.
Eventually, Nifty broke above the resistance zone and more importantly held its retest, turning resistance into support. This clean breakout + retest structure is often a precursor to trend continuation.
Technical Highlights-:
Primary Downtrend: 26000 To 23000.
Failed Retracement Resistance: 24800.
Breakout Confirmation: Price moved above and retested 24800.
Structure: Series of higher lows.
Support Zone: 24800 To 24500.
Momentum: Bullish price action with controlled pullbacks.
Trade Setup-:
Bias: Long
Entry: Current levels or dips toward 24900
Stop-Loss: Below 24500
Target:26000, 26300 (previous all-time high zone)
Rationale-:
This trade aligns with classic price action principles:
Breakdown zone turned into support.
Structure of higher lows holding firm.
Valid breakout-retest confirmation.
Risk clearly defined with natural invalidation.
With Nifty respecting structure and momentum building gradually, a revisit to the 26300 zone looks increasingly probable in the coming weeks.
Hope you will like the idea, Best regards- Amit.
GOLD SHOWING A GOOD UP MOVE WITH 1:10 RISK REWARD GOLD SHOWING A GOOD UP MOVE WITH 1:10 RISK REWARD
DUE TO THESE REASON
A. its following a rectangle pattern that stocked the market
which preventing the market to move any one direction now it trying to break the strong resistant lable
B. after the break of this rectangle it will boost the market potential for break
C. also its resisting from a strong neckline the neckline also got weeker ald the price is ready to break in the outer region
all of these reason are indicating the same thing its ready for breakout BREAKOUT trading are follws good risk reward
please dont use more than one percentage of your capitalfollow risk reward and tradeing rules
that will help you to to become a bettertrader
thank you

Sensex - Expiry Day Analysis Oct 23The momentum is reducing once the price breaks 84000, and now it is moving within the range of 83900 to 84700. Support is in the 83900 - 84000 zone. Resistance is at the 84600 - 84700 zone.
If the price opens with a gap down and finds support at 84000, buy above 84080 with the stop loss of 83940 for the targets 84140, 84260, 84400, 84540, 84680, 84800 and 84960.
Sell below 83740 with the stop loss of 83860 for the targets 83600, 83480, 83340, 83200, 83060 and 82900.
Expected expiry day range is 83600 to 84500.
Always do your analysis before taking any trade.

XAUUSD _ 22/10/2025_ TP HIT Over all trend Bullish
1. Current day low sweep yesterday low ( POI confirmed )
2. Entry taken during London session
3. AMD formed during 4 hr candle also price took support near opening of the 4 hr candle open
4. entry in 5 min - closed full at 1:1.8
#ICT
