BTCUSD SHOWING A GOOD UP MOVE WITH 1:10 RISK REWARD BTCUSD SHOWING A GOOD
UP MOVE WITH 1:10 RISK REWARD
DUE TO THESE REASON
A. its following a rectangle pattern that stocked the market
which preventing the market to move any one direction now it trying to break the strong resistant lable
B. after the break of this rectangle it will boost the market potential for break
C. also its resisting from a strong neckline the neckline also got weeker ald the price is ready to break in the outer region
all of these reason are indicating the same thing its ready for breakout BREAKOUT trading are follws good risk reward
please dont use more than one percentage of your capitalfollow risk reward and tradeing rules
that will help you to to become a bettertrader
thank you
Support and Resistance

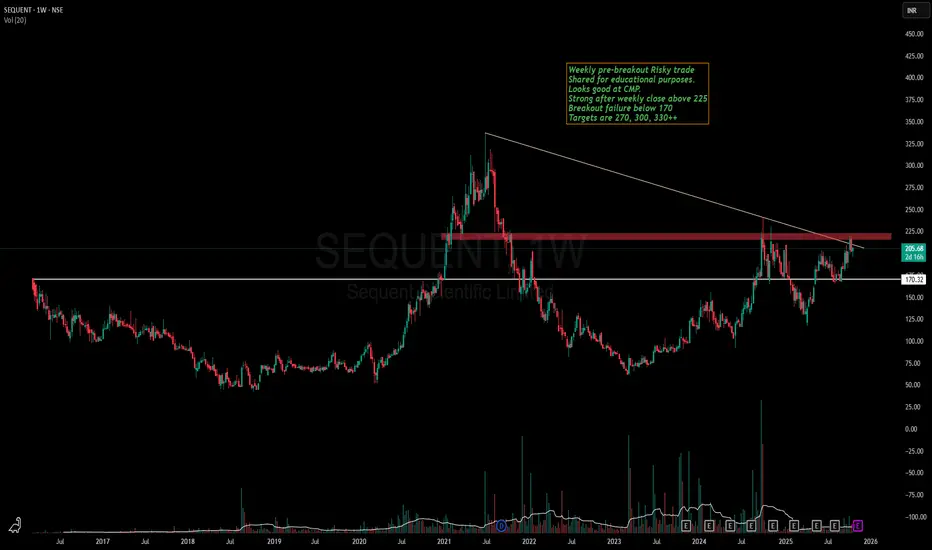
Sequent Scientific - Is it ready for a run towards ATH now?Sequent has been in my watchlist since the breakout of 170 levels.
Stock is making a good Higher high , Higher low pattern in weekly time frame and VCP in lower time frame.
Recently stock gave breakout of a strong resistance zone of 190-200 and is currently consolidating above the same.
If the breakout of 225 happens, we might see stock making a new ATH soon.
Keep this stock in watchlist and lets learn together how the patterns unveils.
This is not a recommendation and idea shared only for educational purposes
I am a NISM Certified RA & not SEBI registered.
NUVOCO | Simple trendline breakout - Looks good for 35-50%NUVOCO | Simple trendline breakout - Looks good for 35-50%
CMP : 422 (Dip : 380)

RBLBANK | Stock is getting re-rated - Looks good for doublingRBLBANK | Stock is getting re-rated - Looks good for doubling
CMP : 325

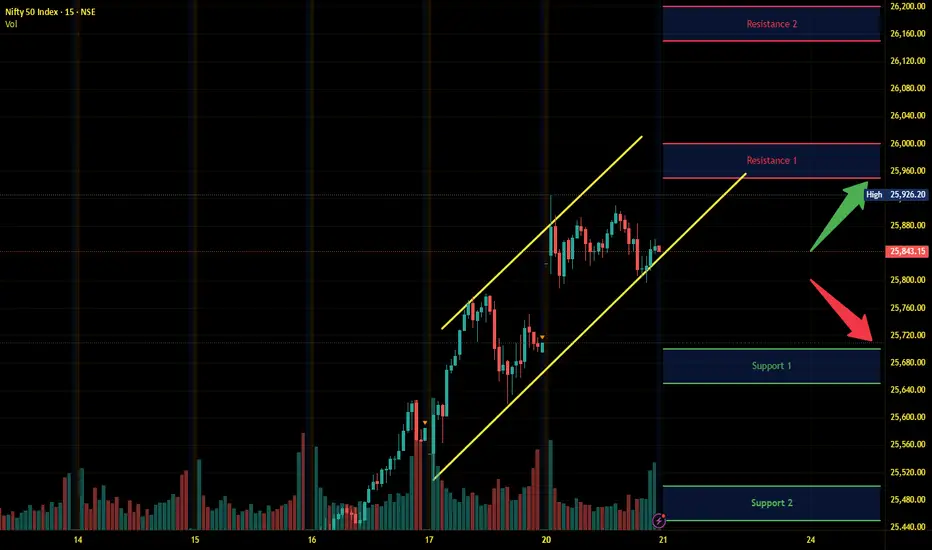
Nifty Intraday Analysis for 21st October 2025NSE:NIFTY
Diwali Muhurat trading day for one hour trading and low volume with narrow range expected.
Index has resistance near 25950 – 26000 range and if index crosses and sustains above this level then may reach near 26150 – 26200 range.
Nifty has immediate support near 25700 – 25650 range and if this support is broken then index may tank near 25500 – 25450 range.
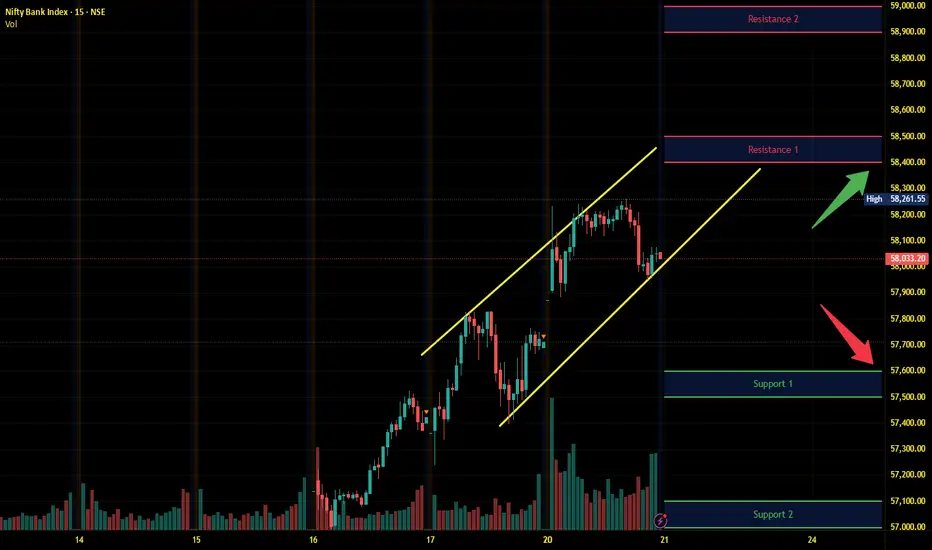
Banknifty Intraday Analysis for 21st October 2025NSE:BANKNIFTY
Diwali Muhurat trading day for one hour trading and low volume with narrow range expected.
Index has resistance near 58400 – 58500 range and if index crosses and sustains above this level then may reach near 58900– 59000 range.
Banknifty has immediate support near 57600 - 57500 range and if this support is broken then index may tank near 57100 - 57000 range.
Finnifty Intraday Analysis for 21st October 2025NSE:CNXFINANCE
Diwali Muhurat trading day for one hour trading and low volume with narrow range expected.
Index has resistance near 27725 - 27725 range and if index crosses and sustains above this level then may reach near 27950 - 28000 range.
Finnifty has immediate support near 27350– 27300 range and if this support is broken then index may tank near 27125 – 27075 range.

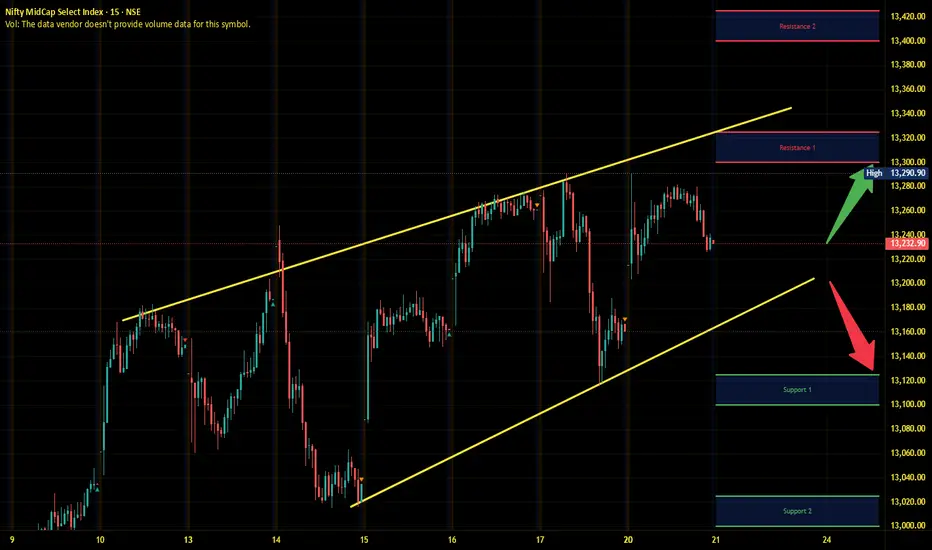
Midnifty Intraday Analysis for 21st October 2025NSE:NIFTY_MID_SELECT
Diwali Muhurat trading day for one hour trading and low volume with narrow range expected.
Index has immediate resistance near 13300 – 13325 range and if index crosses and sustains above this level then may reach 13400 – 13425 range.
Midnifty has immediate support near 13125 – 13100 range and if this support is broken then index may tank near 13025 – 13000 range.
Gold Holding Gains Ahead of Key US CPI DataGold extends its bullish momentum in early Asian trading, hovering near ₹4,370, supported by rate-cut expectations from the Fed and ongoing US government shutdown concerns, which continue to pressure the USD.
According to CME FedWatch, markets are now pricing in a 99% probability of another rate cut next week — a strong catalyst for gold bulls.
Lower interest rates reduce the opportunity cost of holding non-yielding assets like gold, reinforcing the medium-term uptrend.
However, all eyes are on the US September CPI report due later this week.
A hotter-than-expected reading could temporarily lift the USD and trigger short-term volatility in gold prices.
🔍 MMFlow Technical Outlook
Gold is currently consolidating around the ₹4,320–₹4,370 range after reaching the ATH zone.
Price action shows a clear liquidity sweep at the highs, followed by a minor retracement — still within the bullish structure.
The main trendline remains intact, suggesting that any dip toward ₹4,305–₹4,260 may attract new buyers.
⚙️ Trading Plan (MMFlow View)
🔼BUY SCALP
📌Entry: ₹4,302 – ₹4,300 (½ volume)
❌Stop Loss: ₹4,292
✔️Take Profit: ₹4,310 → ₹4,315 → ₹4,320 → ₹4,330 → ₹4,340 → ₹4,350+
🔼BUY ZONE (Swing)
✨Entry: ₹4,260 – ₹4,258
❌Stop Loss: ₹4,252
✔️Take Profit: ₹4,265 → ₹4,270 → ₹4,280 → ₹4,290 → ₹4,300+
📈Buy setups remain favored as long as price holds above ₹4,260.
Intraday sell reactions near ₹4,360–₹4,378 are short-term only — watch for liquidity grabs and bullish re-entry opportunities.
⚡️Key MMFlow Zones
CP Down Zone / OBS Sell Zone: ₹4,360
ATH Liquidity Sell Zone: ₹4,448
Retest Trendline / OBS Buy Zone: ₹4,305
End FVG Uptrend / OBS Buy Zone: ₹4,260
Sentiment: 🟢 Bullish Bias
Bias Confirmation: CPI Data & Fed Rate Expectations
Strategy: Buy-the-Dip → Target Liquidity Above ₹4,370–₹4,380
🔥 Stay patient — let liquidity drive the next leg. MMFlow tracks smart money zones, not emotions.

XAU/USD – Gold Technical Rebound Prepares for Next Waveb]🔍 Market Context
After reaching a peak at the ATH GOLD 4,391 USD region, gold has undergone a technical correction — reflecting temporary profit-taking following a strong upward trend.
The market structure still maintains a bullish bias as the support zones below (FVG + OB) remain intact and untested.
Currently, the price is hovering around 4,325 USD, indicating that selling pressure has weakened.
Buyers are likely to return at two strategic zones below — where institutional money (Smart Money) typically accumulates positions before the next upward wave.
💎 Technical Analysis
ATH GOLD: 4,391 USD
Liquidity Zone $$$: 4,465 – 4,424 USD → the upper liquidity zone, the main target for the next upward wave.
FVG Zone: 4,284 – 4,267 USD → an unfilled gap, likely to be retested.
Order Block Zone: 4,244 – 4,230 USD → deep discount zone confluence with Fibo 0.786, high probability of strong reaction.
Liquidity Clear $$$: 4,186 – 4,190 USD → the last defense zone of the main upward trend.
Overall structure remains bullish ; the current decline is merely a phase of adjustment to “accumulate liquidity” before continuing the upward momentum.
📈 Trading Scenarios
1️⃣ BUY Setup #1 – FVG Zone 4,267 USD
Entry: 4,267 – 4,270
SL: 4,255
TP: 4,330 → 4,366 → 4,391
✅ Condition: Confirming bullish candle (rejection / engulfing bullish) at the FVG zone or a small BoS appears on M15.
➡️ Short-term “buy-the-dip” setup, leveraging the unfilled FVG zone — where technical buyers often initiate positions first.
2️⃣ BUY Setup #2 – Order Block Zone 4,244 USD
Entry: 4,244 – 4,230
SL: 4,210
TP: 4,284 → 4,366 → 4,391 → 4,424
✅ Condition: Strong confirming candle (engulfing bullish) or a retracement pattern breaking a small BoS back up.
➡️ Swing-buy setup at deep discount zone — confluence of OB + Fibo 0.786, high probability and optimal R:R.
⚠️ Risk Management
Avoid FOMO buying in the middle of the range (4,320–4,340).
Prioritize waiting for clear reactions at 4,267 and 4,244 before entering trades.
If the price closes an H1 candle below 4,210 → pause all buy orders, re-evaluate price action at 4,186.
Maintain moderate trading volume during the current rebound phase.
💬 Conclusion
Gold is in a phase of healthy technical correction within a major upward trend.
The two zones 4,267 USD (FVG Zone) and 4,244 USD (Order Block Zone) are key “accumulation” areas for large capital.
When bullish confirmation signals appear, these will be safe buy positions before gold heads back to the peak 4,391 – 4,465 USD .
👉 Reasonable Strategy:
Buy at 4,267 – 4,270 USD if reversal confirmation occurs.
Buy at 4,244 – 4,230 USD if a strong OB reaction signal appears.
🔥 “Smart money waits at precise levels — not at the top. The next gold wave will emerge between 4.267 and 4.244.”

XAUUSD PLAN | When balanced breaks, strength leaves its mark.🔍 Market Context
After setting a short-term peak at the 4,385 – 4,372 USD zone, gold has entered a strong technical correction phase, with a series of consecutive red candles breaking the short-term upward structure.
The sellers temporarily dominate, pushing the price through the H1 upward trendline. However, the support zone below (Liquidity Zone + Order Block Bullish) is beginning to show absorption, indicating that buyers might return at discounted price zones.
💎 Technical Analysis
Previous Bullish BoS: confirms the main trend is still long-term bullish .
FVG Down Zone: 4,285 – 4,260 USD → a price imbalance zone left in the downtrend, possibly where the price may retrace to “fill the gap” before choosing a direction.
Liquidity Zone $$$: 4,222 – 4,218 USD → a short-term support zone where new buying liquidity appears.
Order Block Bullish: 4,203 – 4,185 USD → a confluence area between OB and Fibo 0.786, where large capital might return.
Deep Bullish OB: 4,142 – 4,128 USD → the last defensive zone for the main upward trend.
Order Block Bearish: 4,372 – 4,385 USD → a critical resistance zone, likely to react if the price retraces.
The current structure shows gold is in a retracement – liquidity rebalancing phase, with insufficient signals to reverse the trend.
📈 Trading Scenarios
1️⃣ Main Scenario – Buy reaction at Liquidity zone 4,222 – 4,203 USD
Entry: 4,222 – 4,203
SL: 4,185
TP: 4,260 → 4,318 → 4,372
✅ Condition: Strong rejection candle (rejection / engulfing bullish) appears at the support zone or small reversal BoS.
➡️ This is a “buy the dip” setup following the main trend, leveraging the liquidity zone and confluence OB.
2️⃣ Secondary Scenario – Sell reaction at FVG Down 4,285 – 4,260 USD
Entry: 4,260 – 4,285
SL: 4,300
TP: 4,222 → 4,203
✅ Condition: Strong bearish candle or rejection signal appears at the FVG zone.
➡️ This setup is for scalping traders or short-term shorts in the unfilled price balance zone.
⚠️ Risk Management
Do not FOMO buy when the price has not confirmed the 4,222 zone.
If the price breaks below 4,185 → wait for a re-test to continue selling towards the 4,128 zone.
Keep moderate volume, as the market is in a rebalancing phase – liquidity remains noisy.
💬 Conclusion
Gold is in a transitional phase after a strong decline .
The 4,222 – 4,203 USD zone will be key to determining whether the medium-term upward trend continues.
If this zone holds, gold is likely to retest the 4,318 – 4,372 USD zone.
👉 Reasonable Strategy:
Buy reaction at 4,222 – 4,203 USD when confirmed.
Technical Sell at FVG 4,260 – 4,285 USD if a clear rejection appears.
🔥 “When the market is unbalanced, the strongest side will leave a mark – and this time, the mark is around the 4,220 USD zone.”

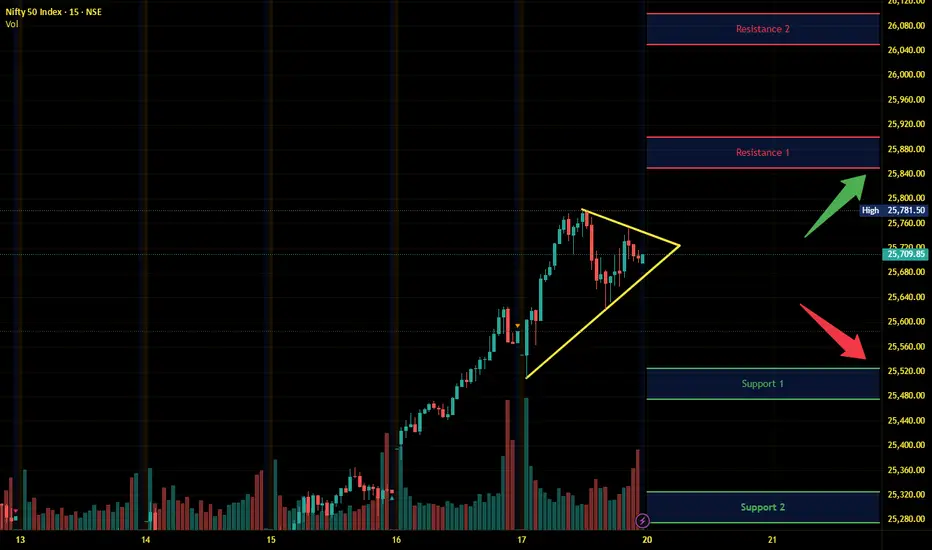
Nifty Intraday Analysis for 20th October 2025NSE:NIFTY
Index has resistance near 25850 – 25900 range and if index crosses and sustains above this level then may reach near 26050 – 26100 range.
Nifty has immediate support near 25525 – 25425 range and if this support is broken then index may tank near 25325 – 25275 range.
Market is expected to be range bound and profit booking expected on a higher level.
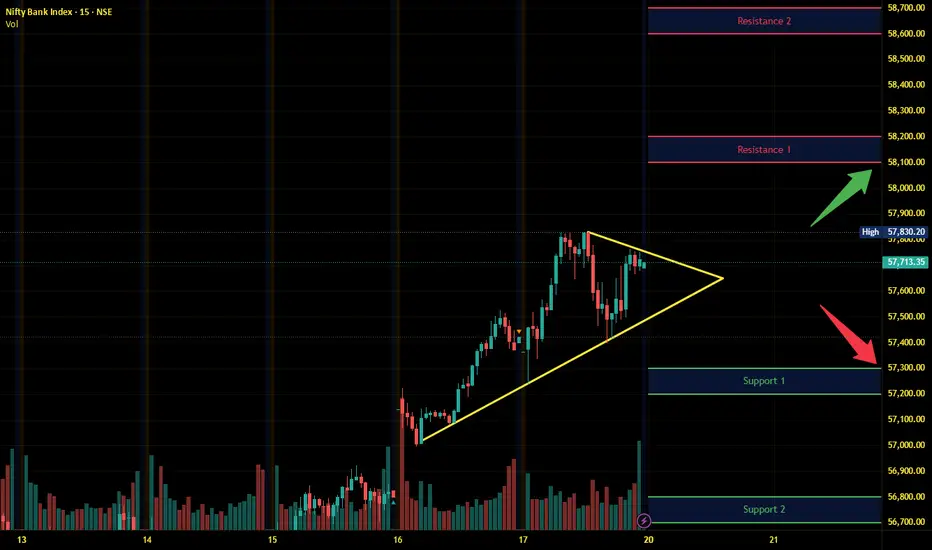
Banknifty Intraday Analysis for 20th October 2025NSE:BANKNIFTY
Index has resistance near 58100 – 58200 range and if index crosses and sustains above this level then may reach near 58600– 58700 range.
Banknifty has immediate support near 57300 - 57200 range and if this support is broken then index may tank near 56800 - 56700 range.
Market is expected to be range bound and profit booking expected on a higher level.
Finnifty Intraday Analysis for 20th October 2025NSE:CNXFINANCE
Index has resistance near 27750 - 27800 range and if index crosses and sustains above this level then may reach near 27950 - 28000 range.
Finnifty has immediate support near 27375– 27325 range and if this support is broken then index may tank near 27150 – 27100 range.
Market is expected to be range bound and profit booking expected on a higher level.

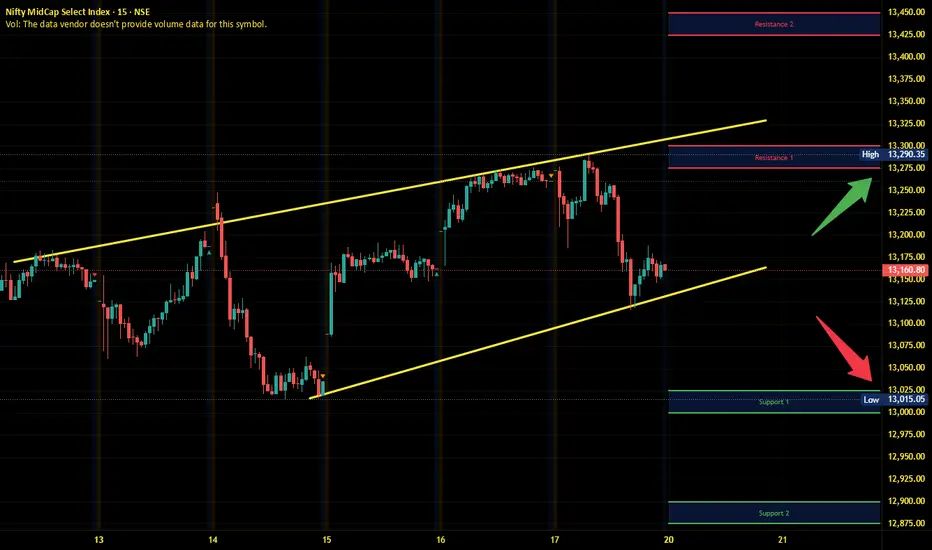
Midnifty Intraday Analysis for 20th October 2025NSE:NIFTY_MID_SELECT
Index has immediate resistance near 13275 – 13300 range and if index crosses and sustains above this level then may reach 13425 – 13450 range.
Midnifty has immediate support near 13025 – 13000 range and if this support is broken then index may tank near 12900 – 12875 range.
Market is expected to be range bound and profit booking expected on a higher level.
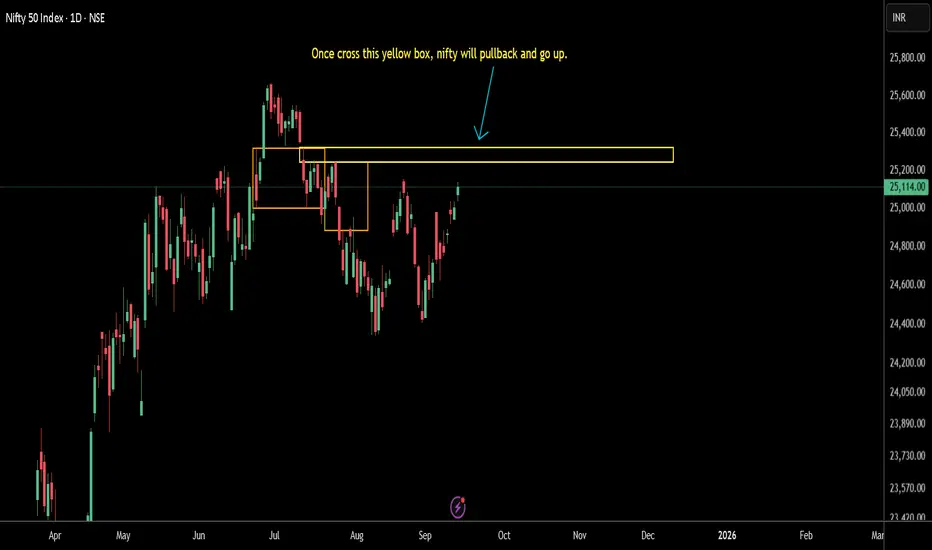
Nifty need to cross 25322.45 to go up !Nifty need to cross 25322.45 show the bullish sign. After crossing it should pullback and go up again.
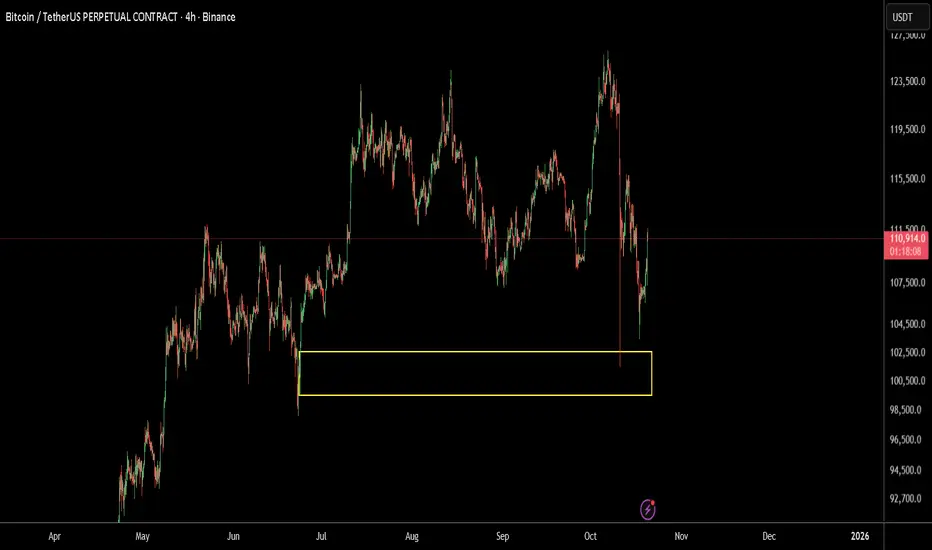
BTC not ready to go down yet!Many may be scared buy recent BTC fall and wondering what is next ? Well it needs to break the Origin of upmove (yellow box) to go down further. But right now it bounced from there so we need to wait for break of yellow box for more downside.
4,200 or 4,285? Gold’s Next Move Decides It All📊 Market Overview
Gold remains under pressure at the start of the week, trading below last week’s record highs, after a sharp correction from the 4,380s down to the 4,240 zone.
Investor sentiment is cautious as the market navigates a mix of uncertain U.S. economic data, a still-closed U.S. government, and renewed geopolitical tensions across multiple regions — all of which are fueling both fear and indecision in the market.
During early Asian hours, gold showed a mild recovery but continues to move sideways in a tight consolidation range, reflecting indecisive liquidity buildup before the next major move.
🧠 Technical Structure (MMFLOW View)
Gold is consolidating between short-term support near 4,206–4,204 and resistance around 4,285–4,287.
Liquidity has started to cluster above and below the current range, suggesting that a breakout is imminent.
The 4,166 – 4,140 region remains a major Smart Money re-entry zone, aligned with the CP BUY ZONE + OBS demand block.
On the upside, 4,313 – 4,342 stands as a key supply zone where large sellers previously stepped in.
Until price breaks out decisively, traders should expect choppy intraday conditions with limited follow-through.
🔑 Key Levels to Watch
🟢 BUY ZONE (Liquidity Re-entry Zone)
Zone: 4,206 – 4,204
SL: 4,200
TP: 4,210 – 4,215 – 4,220 – 4,230 – 4,240 – 4,250 – ???
🔴 SELL ZONE (Liquidity Reaction Zone)
Zone: 4,285 – 4,287
SL: 4,292
TP: 4,280 – 4,275 – 4,270 – 4,260 – 4,250 – ???
⚙️ MMFLOW Scenarios
1️⃣ Bullish Scenario:
If gold sustains above the 4,200 – 4,210 support area, a short-term rebound toward 4,270 – 4,285 can be expected.
Breaking above 4,287 would open room toward 4,313 – 4,342 (OBS Sell Zone), where Smart Money may begin distributing again.
2️⃣ Bearish Scenario:
A clean break below 4,200 could trigger a deeper retracement toward 4,166 – 4,140 (CP BUY ZONE).
This would still represent a healthy correction within the broader bullish macro structure.
⚡️ MMFLOW Insights
Market remains neutral-to-bullish, but current movement reflects accumulation within a compression range.
Sideway structure indicates the market is loading liquidity for the next impulsive leg.
Patience is key — traders should wait for clean breakout confirmations before scaling positions.
⚠️ Trading Notes
✅ Use tight Stop Losses — gold’s volatility remains unpredictable during macro uncertainty.
✅ Avoid over-leveraging while price stays inside the sideway channel.
✅ Focus on reaction zones (CP, OBS, and liquidity sweeps) for precise entries.
🧭 Quick Summary
Gold trades sideways below record highs.
Key support: 4,206 – 4,204, key resistance: 4,285 – 4,287.
Short-term bias: Range-bound with bullish undertone.
Best approach: Buy dips at liquidity zones; wait for breakout confirmation before trend trades.

Nifty - Expiry day analysis Oct 20Price was moving from one support to another. The nearby support/resistance levels are 25500, 25620 and 25800.
If the price opens with a gap up and faces resistance at the 25800 zone, then the price will try to find support at 25620 and 25500.
Buy above 25820 with the stop loss of 25780 for the targets 25860, 25900, 25940 and 25980.
Sell below 25640 with the stop loss of 25680 for the targets 25600, 25560, 25520 and 25480.
Expected expiry day range is 25600 and 25900.
Always do your analysis before taking any trade.

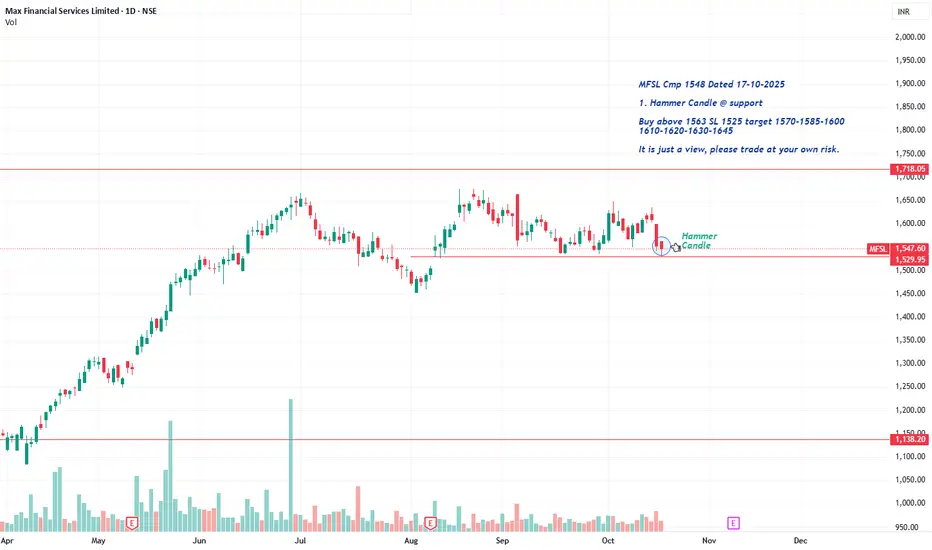
MFSL Cmp 1548 Hammer @ SupportMFSL Cmp 1548 Dated 17-10-2025
1. Hammer Candle @ support
Buy above 1563 SL 1525 target 1570-1585-1600-1610-1620-1630-1645
It is just a view, please trade at your own risk.
RAMKY INFRA TATrend and Structure
The stock is showing a clear uptrend channel since early 2025, marked by higher highs and higher lows.
Price is currently near the middle-upper part of this channel, signaling sustained bullish momentum.
The presence of a Fair Value Gap (FVG) area around 630–640 INR indicates a recent imbalance zone where lingering buy orders may fill, often acting as a support area.
Support and Resistance
Immediate support is the FVG zone near 630-640 INR.
Resistance levels are marked by two clear zones:
TGT-1: Around 680-700 INR, corresponding to a previous significant resistance.
TGT-2: Around 760-780 INR, near the major highs from late 2024.
Entry Strategy
Consider a long entry near the FVG zone (630-640 INR), if price shows bullish confirmation such as strong bullish candles or volume.
The FVG and the lower boundary of the uptrend channel provide a double support zone, reinforcing the long bias.
Stop Loss (SL)
Below the lower boundary of the uptrend channel, around 600 INR, allowing room for volatility while protecting downside risk.
Targets (TGT)
TGT-1: 680-700 INR — first profit booking zone.
TGT-2: 760-780 INR — extended profit target if momentum continues.

GOLD 1H Analysis for 20th October 2025 MondayThe 1H trend has shifted to bearish. The current price is above the 1H QML and has retested the 1H SBR zone.
The price is currently positioned in two areas: 1) Supply Zone and 2) Double Top.
The outcome of the market will be determined on Monday.

Hold ur horses!!!!!!# NIFTY Futures Technical Analysis
## Market Structure: Breakout → Channel → Consolidation
The classic three-phase pattern has unfolded:
### Phase 1: Breakout (April 7th)
- Strong breakout initiated the current bull move
- Established new higher ground
### Phase 2: Channel Formation
- Price entered channeling phase post-breakout
- Defined upper and lower boundaries
### Phase 3: Consolidation (May 8th onwards)
- Currently consolidating within the same channel range
- **Duration:** 5+ months of sideways action
- **Gap Fill Alert:** October 3rd, 2024 gap has been filled ✓
---
## Key Technical Observations
### Rising Trendline Support (from 2020)
- Long-term support line remains intact
- Critical level to watch for potential correction target
- Price is currently above this multi-year support
### Price Action Strength
- **No daily red candles formed so far** - indicates underlying strength
- Lack of bearish daily closes suggests bulls remain in control
- However, this also means no confirmed reversal pattern yet
---
## Seasonal Context
### "Most Bullish Week" Ending
- The historically strongest week of the year is concluding
- Post this period, seasonal headwinds may emerge
### November-December Seasonal Pattern
- Historically **NOT bullish months** for Nifty
- Increased probability of corrective moves
- Aligns with potential technical correction scenario
---
## Trading Strategy
### SHORT SETUP - Wait for Confirmation
**DO NOT short yet. Wait for:**
1. **Trigger:** Price forms a lower value **below Friday's low**
2. **Confirmation:** First daily red candle closes below Friday's low
3. **Target:** Rising trendline from 2020 (~23,850-23,970 zone)
### Risk Management
- Entry only after confirmation
- Stop loss above recent swing high
- Watch for support at channel mid-level
### Alternative Scenario
- If price holds and forms higher lows, consolidation may extend
- Breakout above channel top invalidates bearish setup
---
## Conclusion
While the setup suggests potential downside, **patience is key**. The absence of daily red candles indicates bulls haven't given up. Wait for clear price action confirmation below Friday's low before initiating short positions. The rising trendline from 2020 offers a logical target if correction materializes.
**Current Price:** 25,757.80
**Key Level to Watch:** Friday's Low
**Target Zone:** 23,850-24,000 (Rising Trendline)
---
*Not financial advice. Trade at your own risk. Always use proper risk management.*
