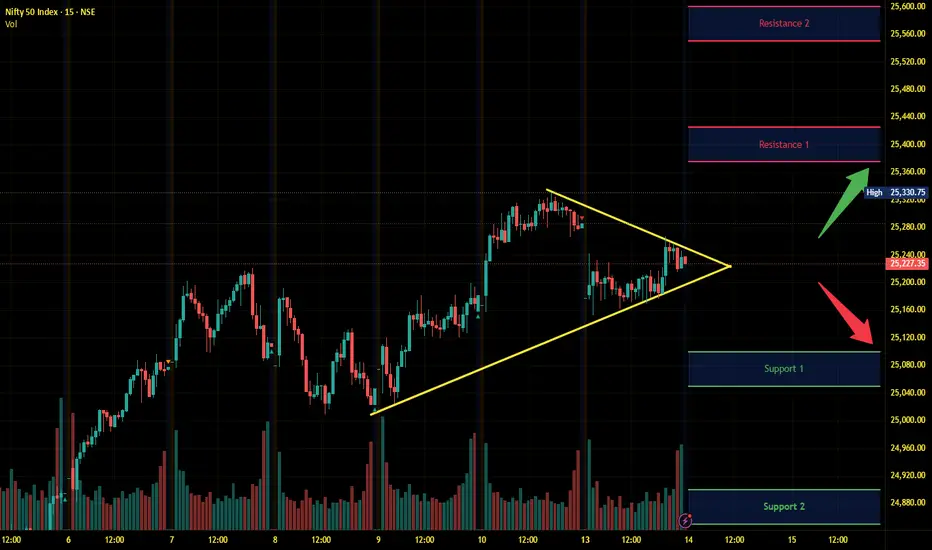
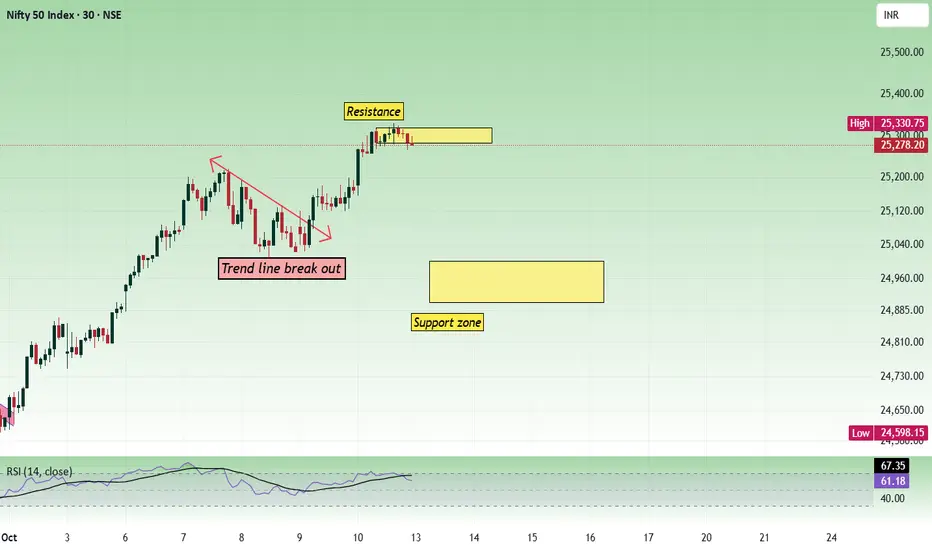
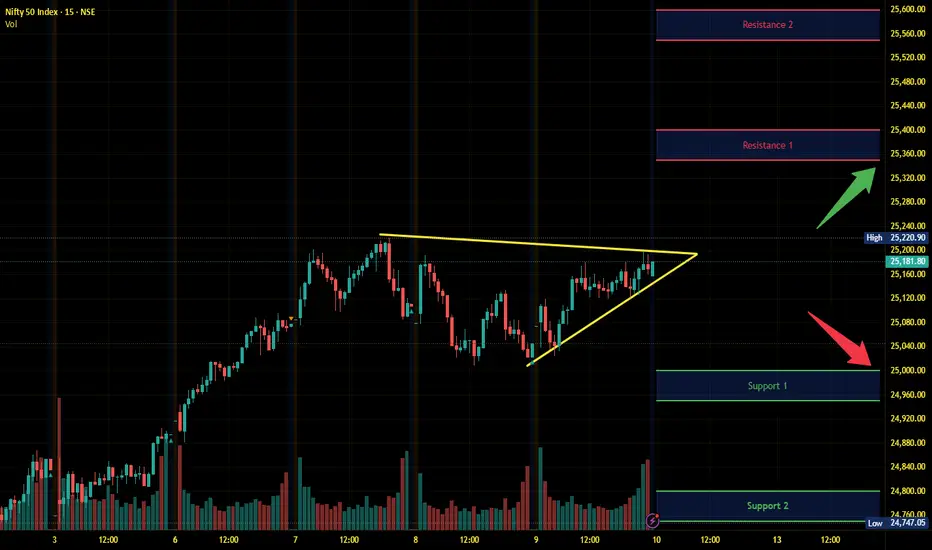
Nifty Intraday Analysis for 14th October 2025NSE:NIFTY
Index has resistance near 25375 – 25425 range and if index crosses and sustains above this level then may reach near 25550 – 25600 range.
Nifty has immediate support near 25100 – 25050 range and if this support is broken then index may tank near 24900 – 24850 range.
Support and Resistance
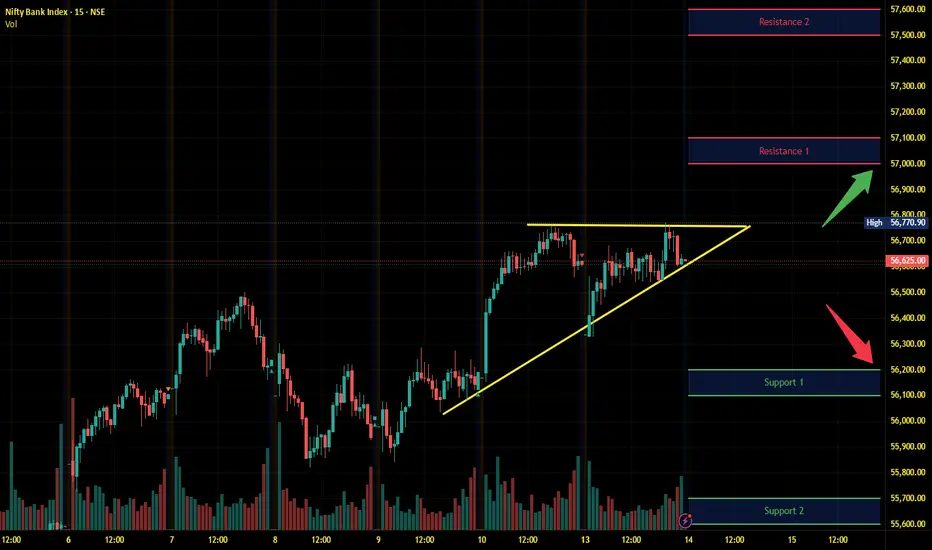
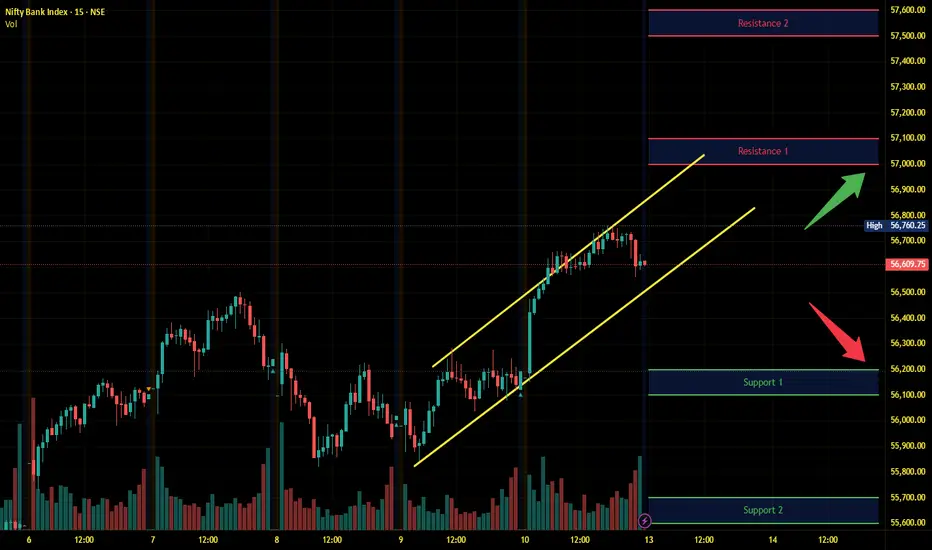
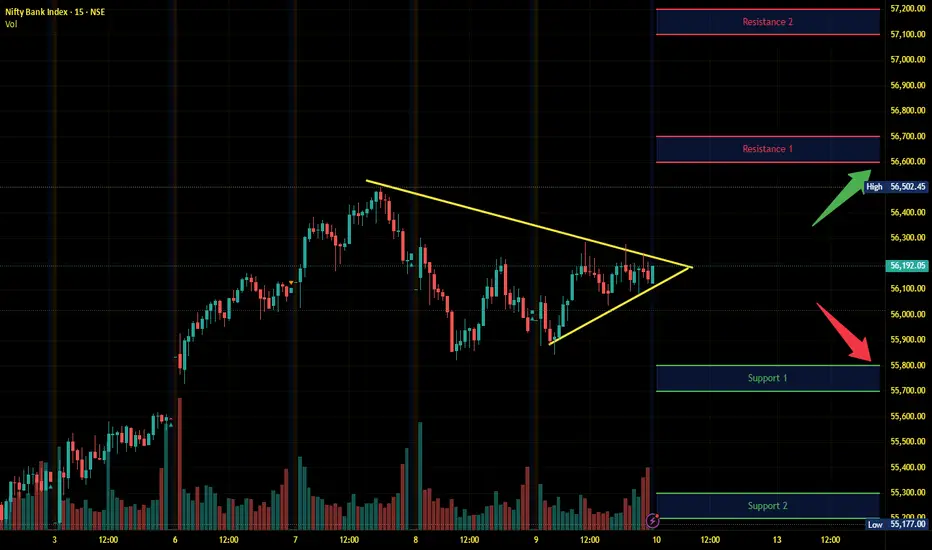
Banknifty Intraday Analysis for 14th October 2025NSE:BANKNIFTY
Index has resistance near 57000 – 57100 range and if index crosses and sustains above this level then may reach near 57500– 57600 range.
Banknifty has immediate support near 56200 - 56100 range and if this support is broken then index may tank near 55700 - 55600 range.
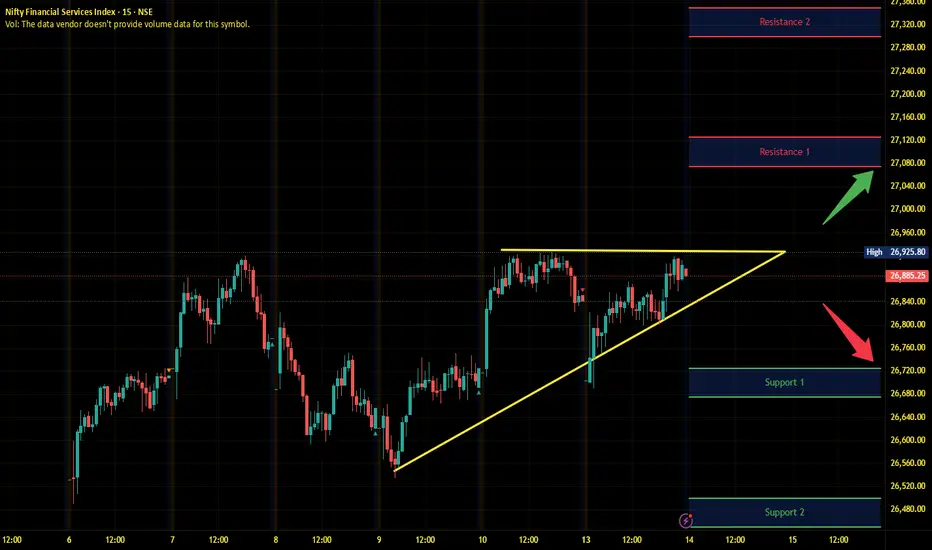
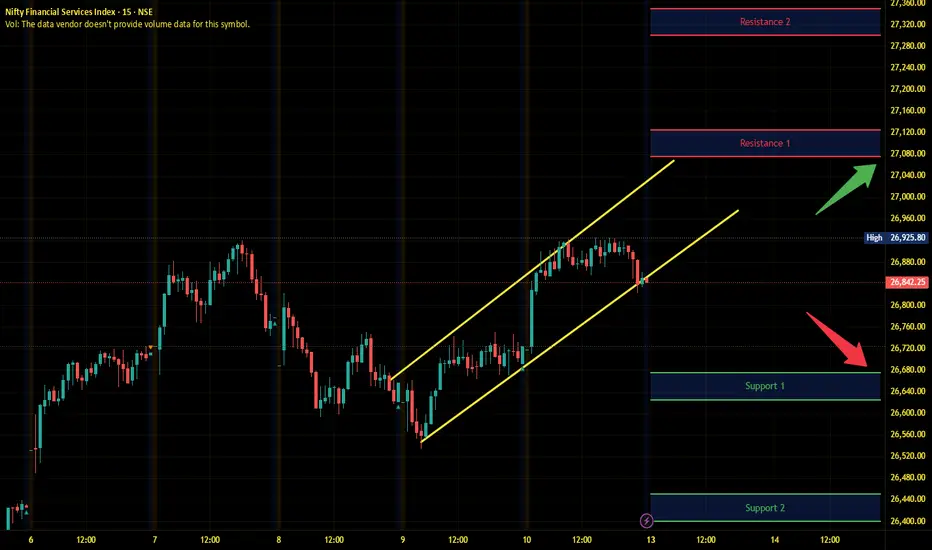
Finnifty Intraday Analysis for 14th October 2025NSE:CNXFINANCE
Index has resistance near 27075 - 27125 range and if index crosses and sustains above this level then may reach near 27300 - 27350 range.
Finnifty has immediate support near 26725 – 26675 range and if this support is broken then index may tank near 26500 – 26450 range.
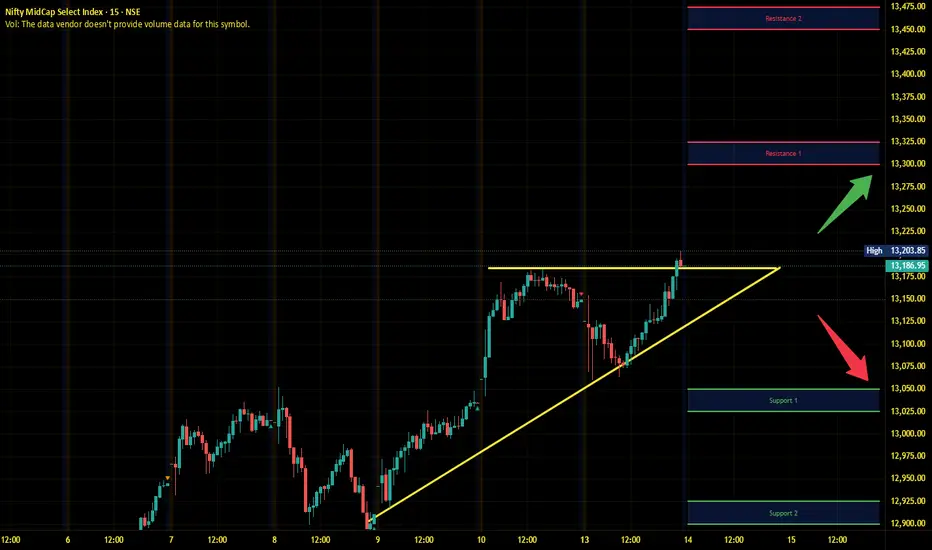
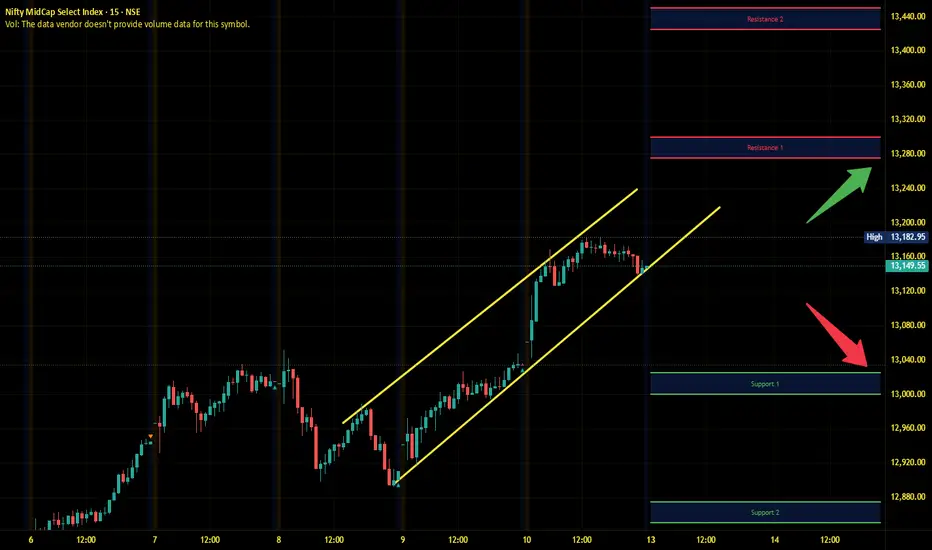
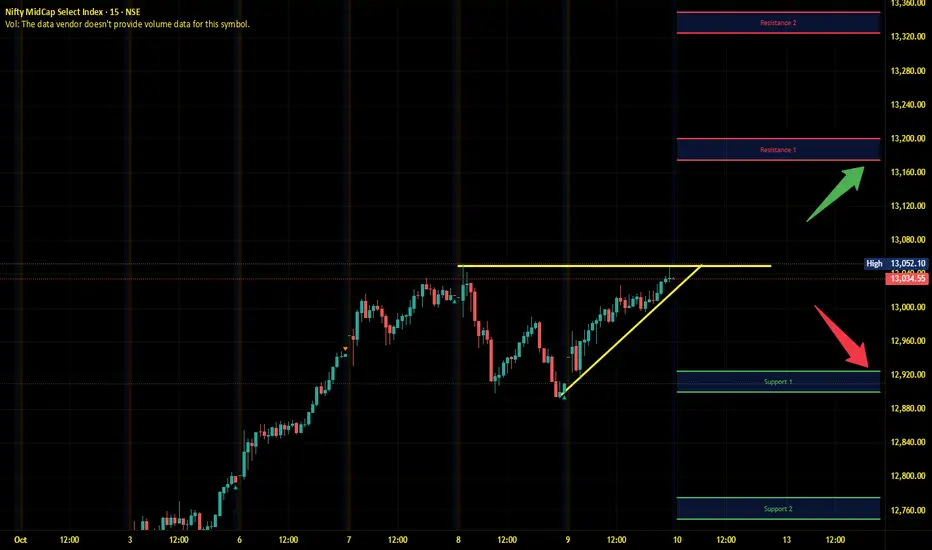
Midnifty Intraday Analysis for 14th October 2025NSE:NIFTY_MID_SELECT
Index has immediate resistance near 13300 – 13325 range and if index crosses and sustains above this level then may reach 13450– 13475 range.
Midnifty has immediate support near 13050 – 13025 range and if this support is broken then index may tank near 12925 – 12900 range.
XAUUSD – Sharp Pullback After Hitting New ATHMarket Context:
Gold has seen a steep intraday drop after hitting a fresh all-time high at 4,179 USD/oz, extending beyond the morning target of 4,170–4,172.
The move likely reflects profit-taking amid broader market caution, as the US Dollar strengthened and GBP fell sharply, indirectly weighing on XAUUSD.
Silver also followed the correction, down over 2%, trading near 51 USD/oz after peaking at 53.60 earlier.
Despite this drop, the overall market sentiment remains defensive — both metals are still up about 2% for the week, suggesting this is a technical retracement, not a full trend reversal.
Technical Outlook (M30):
Price has broken below the short-term rising channel and is now retesting key liquidity areas.
Watch the 4,134 – 4,135 zone for a potential retest (50% pullback) before continuation toward lower buy zones.
End Liquidity Sell Zone: 4,165 – 4,170
Retest Zone (50% Down): 4,134 – 4,135
CP Buy Zone / Fibo 0.618: 4,052 – 4,054
OBS Buy Zone: 4,000 – 4,005
Trading Plan:
🔹 Sell Setup (Correction Play):
Entry: 4,134 – 4,136
Stop Loss: 4,142
Take Profit: 4130 - 4125 - 4120 - 4110 - 4100 - ???
🔹 Buy Setup (Reaction Zone):
Entry 1: 4,052 – 4,054 (Fibo 0.618 Confluence)
Stop Loss: 4,044
Take Profit: 4056 - 4060 - 4065 - 4070 - 4080 - 4090 - ???
Summary:
Gold’s sharp drop after a new ATH signals a short-term correction phase while the broader bullish trend stays intact.
A pullback toward 4,052 or even 4,000 could attract buy-side liquidity before any recovery.
Keep an eye on 4,135 for a potential retest before continuation.
📊 What’s your view — is this just a healthy retracement or the start of a deeper correction?
👉 Follow MMFLOW TRADING for precise intraday setups and structure-based analysis.

XAU/USD – Liquidity Cleared, Gold Reloads for the Next Breakout🔍 Market Context
This morning, gold price (XAU/USD) experienced a classic liquidity sweep :
The price surpassed the previous high of 4058 , touched 4060 , wicked strongly , and short-term corrected – a textbook “liquidity hunt” by major funds.
After this drop, the price recovered back to the old ATH zone (4055 – 4060) .
This indicates that short-term sellers have weakened , and buyers are reclaiming the crucial structure zone .
Therefore, selling strategy is no longer optimal , instead, the market is preparing for a re-accumulation – next breakout.
💎 Technical Analysis
Current ATH: 4060 USD
Previous High: 4058 USD
This morning's liquidity sweep “cleared out” liquidity above, paving the way for a re-accumulation phase before the next rise.
The zone 4048 – 4052 is acting as a retest zone – if it holds, this could be the “launchpad” for a breakout to higher price zones.
Overall Structure: still bullish , no signs of medium-term reversal.
⚙️ Key Price Zones
Retest Zone: 4048 – 4052 → support zone after the sweep, where the price might bounce back.
Breakout Zone: 4065 – 4070 → zone confirming buyers regain dominance.
Extended Target: 4090 – 4100 USD.
Invalidation Zone: below 4040 USD → if breached, the short-term bullish structure will weaken.
📈 Trading Scenarios
1️⃣ Buy Continuation Scenario – Buy with the main trend
Wait for the price to retest the 4048 – 4052 zone , observe bullish candle reactions or confirmation signals (Engulfing, Rejection).
Open a buy order upon confirmation of holding the support zone.
Target: 4065 → 4090 USD.
Stop Loss: below 4040 USD.
➡️ This is a trend-following scenario, with the highest probability when the market has completed the liquidity sweep and is re-accumulating.
2️⃣ Buy Breakout Scenario – Buy on confirmed breakout
If the price breaks and closes above 4065 , it signals that major funds have returned.
Open buy stop or limit retest breakout around 4065 – 4070.
Extended Target: 4090 → 4100 USD.
Stop Loss: below 4050 USD.
➡️ This scenario suits momentum traders, avoiding the risk of “fake breakout” by waiting for clear confirmation.
⚠️ Risk Management
Do not sell against the trend at the ATH zone, as liquidity above has been taken.
Maintain reasonable volume when trading around the peak zone.
Prioritize buying when there is confirmation of the bullish structure holding the 4050 zone .
💬 Conclusion
This morning's liquidity sweep has shaken out weak hands , while helping gold pave the way for the next rise .
Currently, the price is re-accumulating around the old peak zone 4055 – 4060 , and if the zone 4048 – 4052 continues to hold, there is a high possibility that gold will break out to the 4090 – 4100 USD zone in the upcoming sessions.
👉 Reasonable Strategy:
Wait to buy at the support zone or buy when the price breaks above 4065.
Avoid selling against the trend now – the risk is very high as major funds have shifted to the accumulation phase.

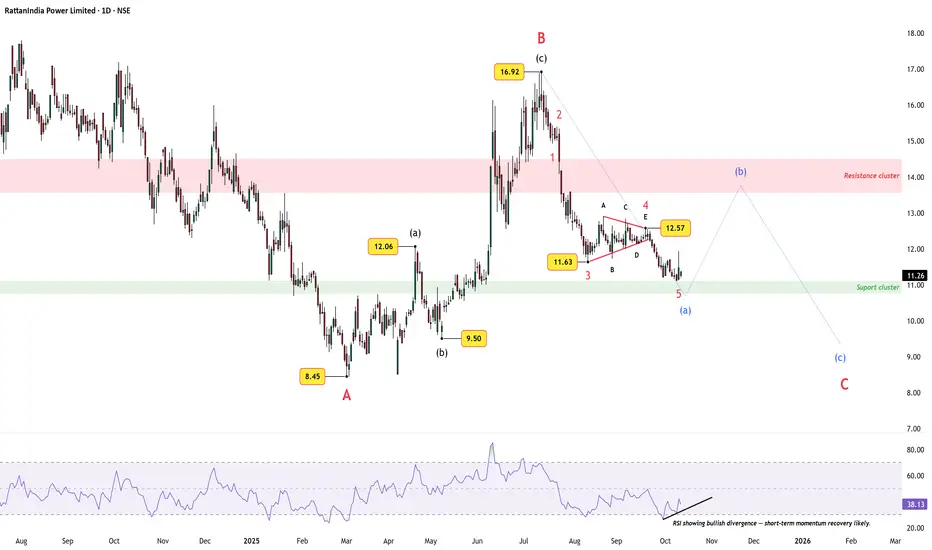
RattanIndia Power: Short-Term Bounce Within Larger CorrectionAfter an extended five-wave decline from the ₹16.92 peak, RattanIndia Power appears to have completed a smaller-degree Wave (a) near the support cluster around ₹11. The substructure shows a clean 1-2-3-4-5 sequence, with Wave 4 forming a contracting triangle and Wave 5 bottoming right into the green support zone.
Momentum Check
RSI has registered a clear bullish divergence, suggesting that downside momentum is fading and a short-term recovery in Wave (b) could unfold soon. Initial resistance sits near the ₹13.50–₹14.50 band — the previous supply and resistance cluster.
Bigger Picture
Despite this potential bounce, the higher-degree outlook remains corrective and bearish, with a subsequent Wave (c) decline likely to test or undercut the ₹9–₹9.50 region before the larger corrective pattern (A-B-C) completes.
In short: a short-term bounce may be in play, but the broader down-cycle is not yet over.
Disclaimer: This analysis is for educational purposes only and does not constitute investment advice. Please do your own research (DYOR) before making any trading decisions.
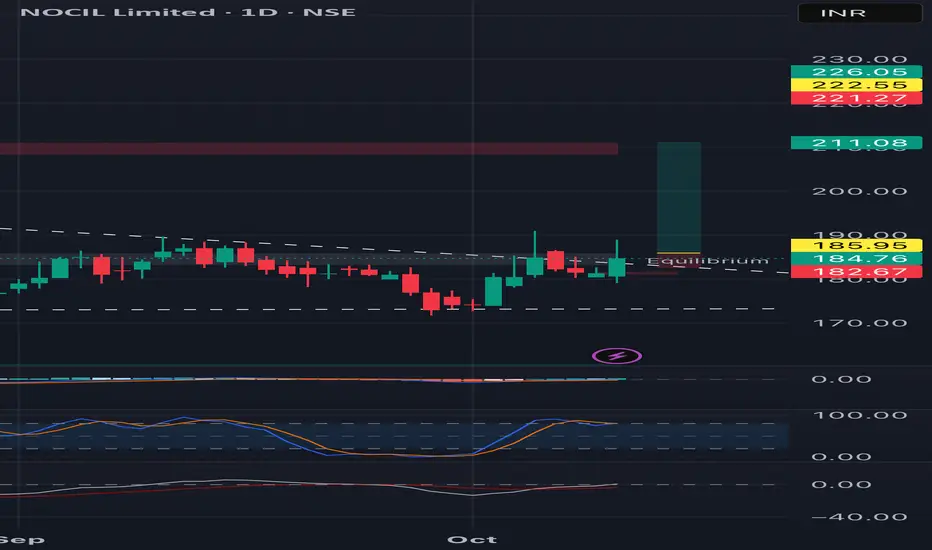
Breakout in NOCILPossibility of a strong breakout in NOCIL.
One can enter above 186 for a possible target of 210.
Note - I am not SEBI registered. This is only for educational purpose..
BUY TODAY SELL TOMORROW for 5%DON’T HAVE TIME TO MANAGE YOUR TRADES?
- Take BTST trades at 3:25 pm every day
- Try to exit by taking 4-7% profit of each trade
- SL can also be maintained as closing below the low of the breakout candle
Now, why do I prefer BTST over swing trades? The primary reason is that I have observed that 90% of the stocks give most of the movement in just 1-2 days and the rest of the time they either consolidate or fall
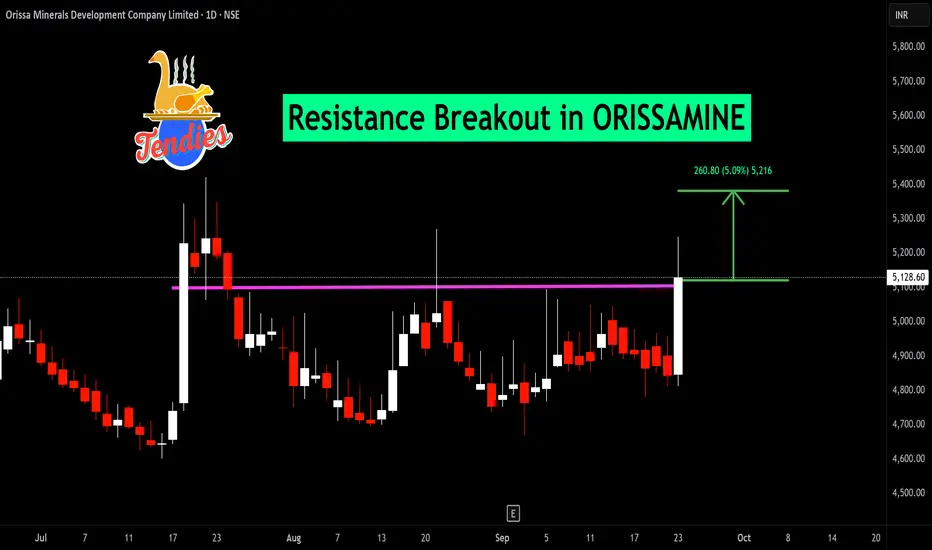
Resistance Breakout in ORISSAMINE
BUY TODAY SELL TOMORROW for 5%
BUY TODAY SELL TOMORROW for 5%DON’T HAVE TIME TO MANAGE YOUR TRADES?
- Take BTST trades at 3:25 pm every day
- Try to exit by taking 4-7% profit of each trade
- SL can also be maintained as closing below the low of the breakout candle
Now, why do I prefer BTST over swing trades? The primary reason is that I have observed that 90% of the stocks give most of the movement in just 1-2 days and the rest of the time they either consolidate or fall
Resistance Breakout in KMCSHIL
BUY TODAY SELL TOMORROW for 5%

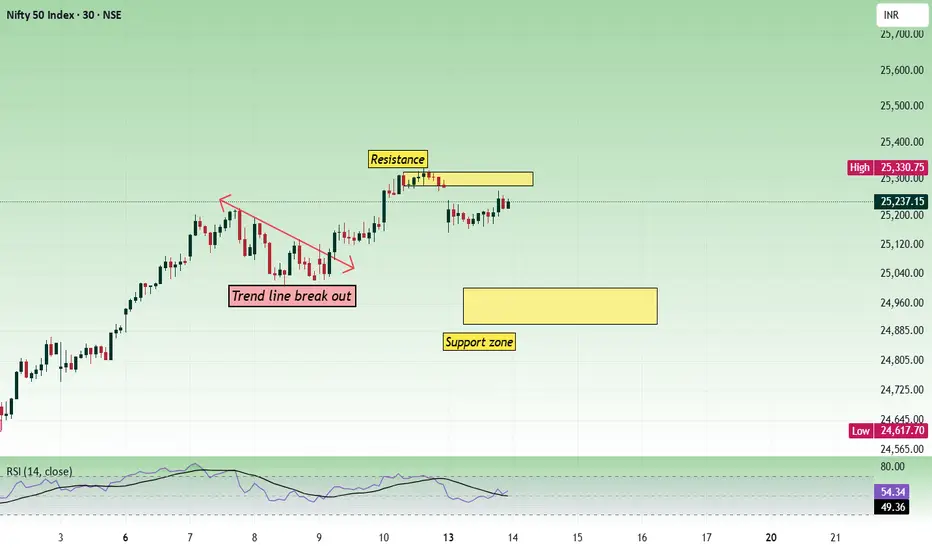
Nifty - Expiry day analysis Oct 14Price moved within a very narrow range today between 25150 and 25250. Nearby resistance is seen at the 25300 - 25320 zone. And nearby support is at the 25000 zone. Bank Nifty was bullish and did not fall, giving strength to Nifty to sustain above 25150.
Let us assume the price opens flat without any big gap up or gap down. In that case, buy above 25200 with the stop loss of 25150 for the targets 25240, 25280, 25320, 25380 and 25420.
Sell below 25100 with the stop loss of 25150 for the targets 25060, 25020, 24980, 24920 and 24880.
Expected expiry day range is 24900 to 25400.
Always do your own analysis before taking any trade.
Nifty Intraday Analysis for 13th October 2025NSE:NIFTY
Index has resistance near 25475 – 25525 range and if index crosses and sustains above this level then may reach near 25675 – 25725 range.
Nifty has immediate support near 25150 – 25100 range and if this support is broken then index may tank near 24950 – 24900 range.
A gap-down opening is expected following the imposition of an additional 100% tariff by the US on Chinese imports effective November 1st. However, buying interest may emerge at lower levels as signals indicate possible finalisation of the India-US trade deal in the coming weeks.

Banknifty Intraday Analysis for 13th October 2025NSE:BANKNIFTY
Index has resistance near 57000 – 57100 range and if index crosses and sustains above this level then may reach near 57500– 57600 range.
Banknifty has immediate support near 56200 - 56100 range and if this support is broken then index may tank near 55700 - 55600 range.
A gap-down opening is expected following the imposition of an additional 100% tariff by the US on Chinese imports effective November 1st. However, buying interest may emerge at lower levels as signals indicate possible finalisation of the India-US trade deal in the coming weeks.
Finnifty Intraday Analysis for 13th October 2025NSE:CNXFINANCE
Index has resistance near 27075 - 27125 range and if index crosses and sustains above this level then may reach near 27300 - 27350 range.
Finnifty has immediate support near 26675 – 26625 range and if this support is broken then index may tank near 26450 – 26400 range.
A gap-down opening is expected following the imposition of an additional 100% tariff by the US on Chinese imports effective November 1st. However, buying interest may emerge at lower levels as signals indicate possible finalisation of the India-US trade deal in the coming weeks.
Midnifty Intraday Analysis for 13th October 2025NSE:NIFTY_MID_SELECT
Index has immediate resistance near 13275 – 13300 range and if index crosses and sustains above this level then may reach 13425– 13450 range.
Midnifty has immediate support near 13025 – 13000 range and if this support is broken then index may tank near 12875 – 12850 range.
A gap-down opening is expected following the imposition of an additional 100% tariff by the US on Chinese imports effective November 1st. However, buying interest may emerge at lower levels as signals indicate possible finalisation of the India-US trade deal in the coming weeks.
Nifty - Weekly Review Oct 13 to Oct 17Price has been facing resistance at the 25320 zone and has been unable to break through it on Friday. If we have a gap-down opening due to the weakness in global markets, 24900 - 25000 can act as a support zone. 24900 to 25000 can become choppy if there is no trend strength. If the support is broken, the next support will be 24600.
Let us assume we have a gap down opening near 25000.
Buy if there is any bullish strength above 25000 with the stop loss of 24950 for the targets 25040, 25080, 25120, 25200, 25280, 24320, 25360, and 24420.
Sell below 24880 with the stop loss of 24930 for the targets 24840, 24800, 24740, 24680, 24620, 24560, 24520, 24480, and 24400.
Always do your own analysis before taking any trade.
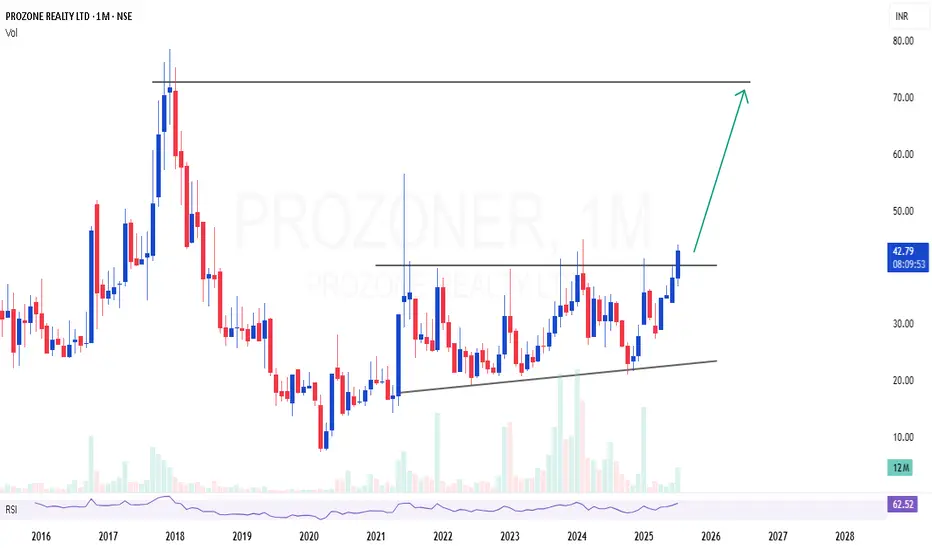
PROZONER | Excellent monthly breakout and closePROZONER | Excellent monthly breakout and close
Long consolidation and closed above the resistance in monthly time frame
Looks potential for 50-60% room
CMP : 42 (Dip : 35)
SL : 30
Nifty Intraday Analysis for 10th October 2025NSE:NIFTY
Index has resistance near 25350 – 25400 range and if index crosses and sustains above this level then may reach near 25550 – 25600 range.
Nifty has immediate support near 25000 – 24950 range and if this support is broken then index may tank near 24800 – 24750 range.
Banknifty Intraday Analysis for 10th October 2025NSE:BANKNIFTY
Index has resistance near 56600 – 56700 range and if index crosses and sustains above this level then may reach near 57100– 57200 range.
Banknifty has immediate support near 55800 - 55700 range and if this support is broken then index may tank near 55300 - 55200 range.
Finnifty Intraday Analysis for 10th October 2025NSE:CNXFINANCE
Index has resistance near 26900 - 26950 range and if index crosses and sustains above this level then may reach near 27150 - 27200 range.
Finnifty has immediate support near 26550 – 26500 range and if this support is broken then index may tank near 26300 – 26250 range.

Midnifty Intraday Analysis for 10th October 2025NSE:NIFTY_MID_SELECT
Index has immediate resistance near 13175 – 13200 range and if index crosses and sustains above this level then may reach 13325– 13350 range.
Midnifty has immediate support near 12925 – 12900 range and if this support is broken then index may tank near 12775 – 12750 range.
India Hotels enters bearish zone under heavy selling pressureTopic Statement:
India Hotels has faced persistent selling since the start of the year, breaking its uptrend and entering a bearish phase.
Key Points:
1. The stock is now moving within a down-trending channel, making channel-based trading effective
2. Price is trading below both the 50 and 200-day EMAs, marking it as highly oversold in the short to medium term
3. Strong support has been established at the 700 level, which serves as a key accumulation zone for long-term investors

XAUUSD – Breakdown After Ceasefire & Fed Comments📉 Market Overview
Gold (XAUUSD) dropped over 2%, sliding from $4,012/oz to $3,945/oz, marking a sharp $67 decline overnight.
The selloff came as two key catalysts hit the market:
🕊 Israel–Hamas ceasefire agreement cooled down geopolitical tensions.
💬 Fed’s Barr pushed back against October rate cuts, sending USD higher and pressuring gold.
Despite the drop, price action suggests a temporary corrective phase, with gold now stabilising near a short-term support zone.
📊 Technical Structure (MMFLOW View)
Gold has confirmed a Head & Shoulders (H&S) breakdown pattern, with a neckline retest around $4,014 – $4,033 acting as resistance.
After the breakdown, price rebounded slightly but continues to trade below the structure, showing that bears remain in control short-term.
The short-term support zone sits around $3,945, and if broken, could accelerate the decline towards $3,912 – $3,885, aligning with deeper liquidity areas.
🔑 Key Zones to Watch
Resistance (Breakdown Zone): 4,014 – 4,033
Support (Short-term): 3,945 – 3,912
Liquidity/Buy Zone: 3,885 – 3,878
💡 MMFLOW Trading Scenarios
🔵 BUY SCALP Zone: 3,912 – 3,910
🔴 Stop Loss: 3,905
✅ Take Profit: 3,916 – 3,920 – 3,925 – 3,930 – 3,940 – 3,950 – ???
Trading View:
The market is still digesting recent fundamentals; volatility remains high.
A short-term rebound from 3,910 is possible as liquidity builds up near this demand zone.
However, unless price reclaims 4,014, any bounce may only be corrective before further downside continuation.
🧭 MMFLOW Insight
Even though gold faces bearish momentum, macro risks still support a long-term bullish narrative:
U.S. government shutdown risks remain unresolved.
Fed may turn dovish later in Q4 if labour data weakens.
Liquidity gaps below $3,900 could attract smart money accumulation zones.
⚠️ Trading Notes
✅ Always set Stop Loss – NFP-style volatility can occur post-Fed comments.
✅ Avoid chasing after breakdown candles. Wait for pullback entries at key levels.
✅ Be patient — the best setups form when liquidity is fully absorbed.
📍 Summary
Gold continues to trade under pressure after geopolitical easing and hawkish Fed tones.
Watch for price action around $3,910 – $3,945; this range will likely define the next major impulse.
Stay alert — once liquidity clears, MMFlow will be watching for smart-money reentry signals from key OB/CP zones.
