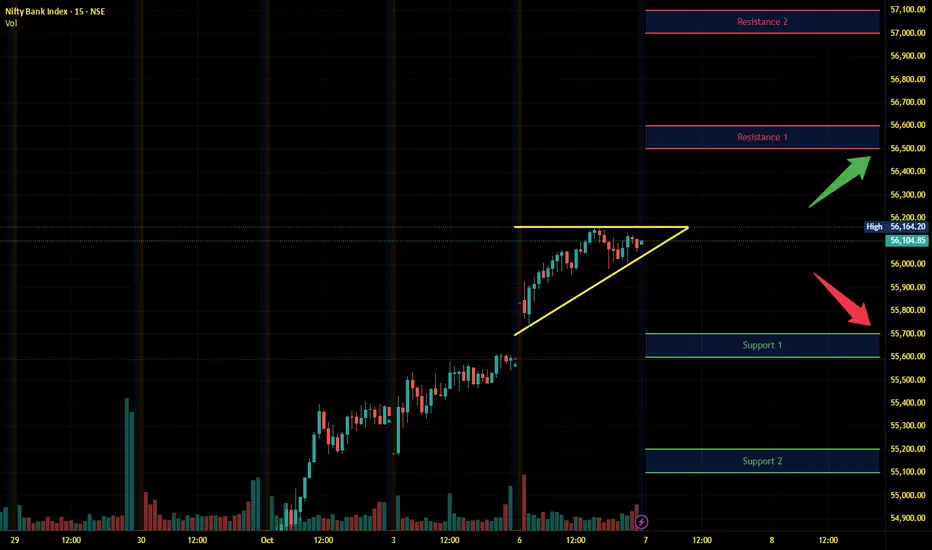
Banknifty Intraday Analysis for 07th October 2025NSE:BANKNIFTY
Index has resistance near 56500 – 56600 range and if index crosses and sustains above this level then may reach near 57000– 57100 range.
Banknifty has immediate support near 55700 - 55600 range and if this support is broken then index may tank near 55200 - 55100 range.
Support and Resistance
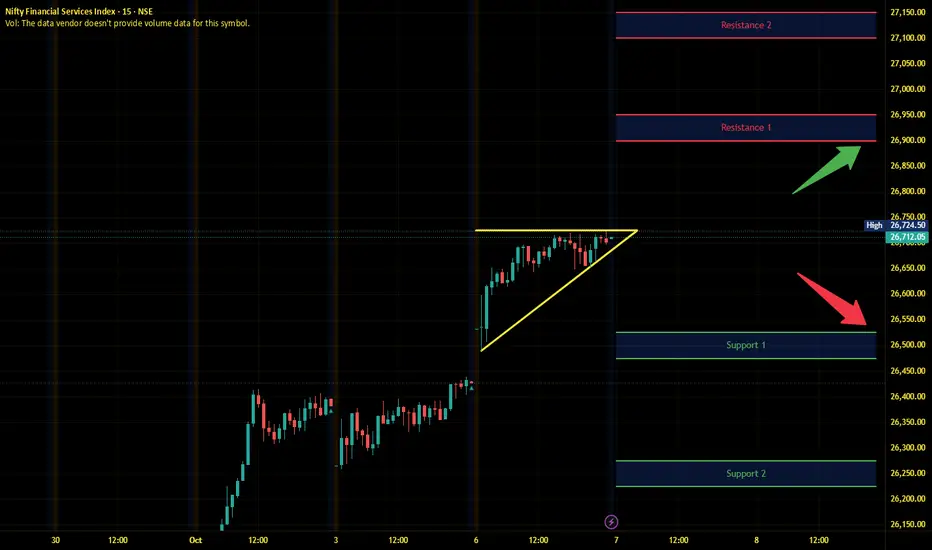
Finnifty Intraday Analysis for 07th October 2025NSE:CNXFINANCE
Index has resistance near 26900 - 26950 range and if index crosses and sustains above this level then may reach near 27100 - 27150 range.
Finnifty has immediate support near 26525 – 26475 range and if this support is broken then index may tank near 26275 – 26225 range.
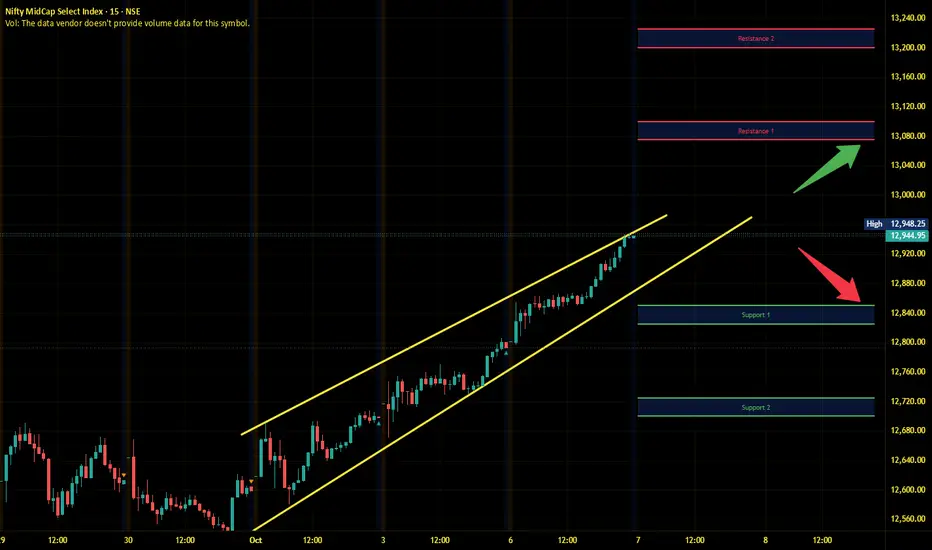
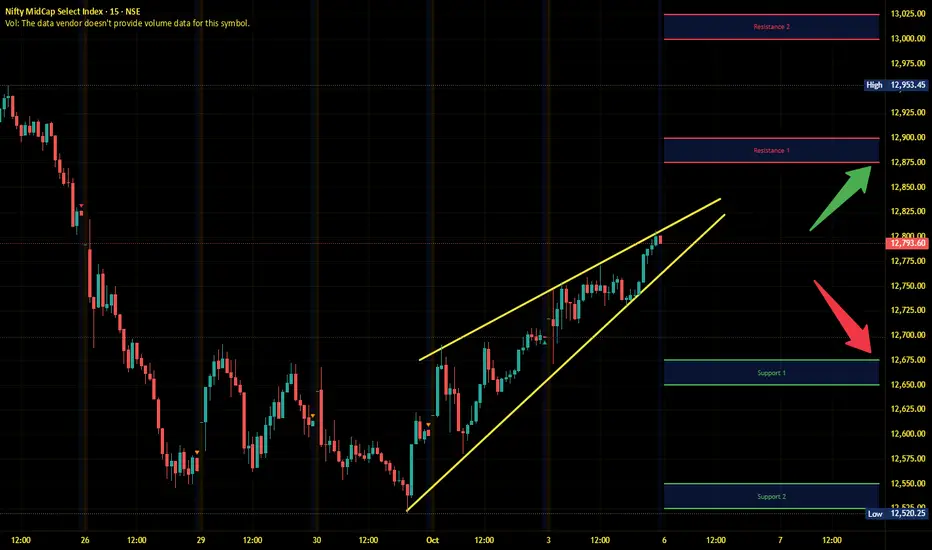
Midnifty Intraday Analysis for 07th October 2025NSE:NIFTY_MID_SELECT
Index has immediate resistance near 13075 – 13100 range and if index crosses and sustains above this level then may reach 13200 – 13225 range.
Midnifty has immediate support near 12850 – 12825 range and if this support is broken then index may tank near 12725 – 12700 range.
Gold Near ₹4000, BofA Warns of Mid-Cycle Adjustment 📊 Market Context
Gold prices are inching closer to the ₹4,000/oz mark, but a fresh warning from Bank of America has made the market cautious. Strategist Paul Ciana notes that gold is over 20% above the MA200 – a level seen before sharp corrections in historical peak cycles (2008, 2011, 2020, 2022).
However, medium-term forecasts from Goldman Sachs, UBS, and even BofA still suggest that gold could reach ₹4200–₹4900/oz next year. This means the long-term upward trend is still intact – but the current phase is prone to unexpected corrections to shake off FOMO buying pressure.
🔎 Technical Analysis (H1/H4)
Prices are fluctuating near the ATH Zone and the crucial liquidity area around ₹3990–₹4000.
Buy Zones: ₹3935–₹3933 (CP zone & FVG reaction) offer an opportunity to accumulate orders.
Sell Zone: ₹3993–₹3995 (Liquidity Zone) – a liquidity trap is likely when prices approach the ₹4000 mark.
🔑 Key Levels
BUY Zones: ₹3935–₹3933, main support at ₹3910.
SELL Zone: ₹3993–₹3995, closely watch liquidity.
Psychological resistance: ₹4000.
📈 Scenario & Trading Plan
✅ BUY ZONE 1: ₹3935–₹3933
SL: ₹3927
TP: ₹3940 - ₹3945 - ₹3950 - ₹3960 - ₹3970 - ₹3980 - ???
✅ SELL ZONE: ₹3993–₹3995
SL: ₹4000
TP: ₹3988 - ₹3984 - ₹3980 - ₹3970 - ₹3960 - ???
⚠️ Risk Management Notes
The ₹3990–₹4000 area is extremely liquid – a peak sweep is likely before reversal.
Only enter trades with clear price action confirmation, avoid FOMO as prices near the psychological mark.
Adjust volume sensibly as volatility may be higher than usual with the market debating the risk of a “mid-cycle correction”.

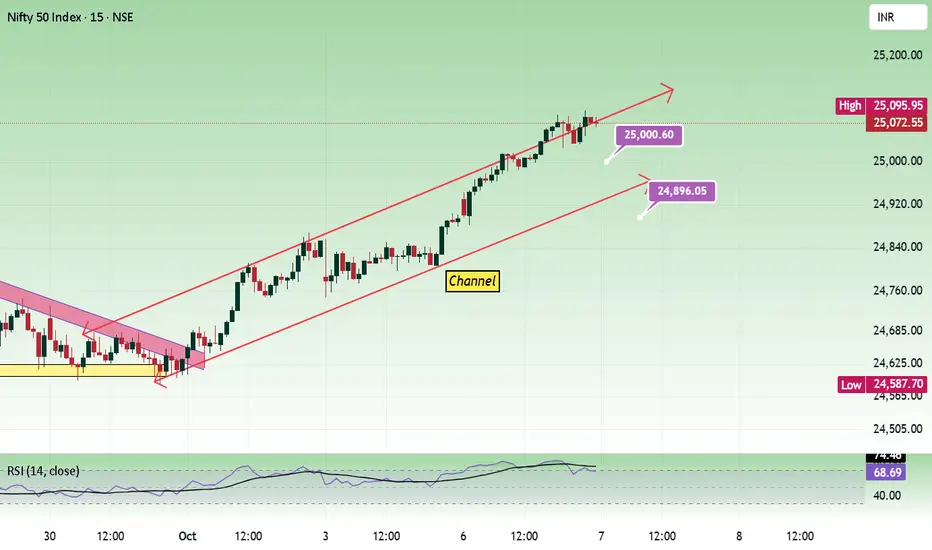
Nifty - Expiry Day Analysis Oct 7Today, the price moved along with the upper trend line of the channel and is sustaining above 25000. Now price has to break 25100 with bullish strength to move towards 25400.
The hourly chart shows the formation of a rounding bottom.
Buy above 25120 with the stop loss of 25070 for the targets 25160, 25200, 25260 and 25300.
Sell below 24960 with the stop loss of 25010 for the targets 24920, 24880, 24820 and 24780.
Expected expiry day range is 24900 to 24250.
Always do your analysis before taking any trade.
Sustainable Price Rise: Where’s the Next Optimal Entry?Hello TradingView community! 🚀
Gold (XAU/USD) is in an extremely sustainable upward structure. Instead of lengthy analysis, let's dive straight into the action plan: What is the optimal entry point and what target is Gold aiming for? Check out the details below.
1. Market Structure Analysis: The Strength of the Bulls 🐂
Looking at the chart, the first thing that catches our eye is a series of "BoS" (Break of Structure).
Every time Gold breaks an old peak, it not only creates a Higher High but also confirms that the upward trend is very strong and sustainable. This indicates that buying power is completely overwhelming and shows no sign of weakening. Smart Money is continuously pushing the price higher, and our job is to ride this "wave."
2. Potential Buying Zones - Where to Catch the Wave? 🧐
To optimize profits and minimize risks, finding a beautiful entry point after a price correction is extremely important. Based on the chart, we have 2 noteworthy potential buying zones:
Buying Zone 1 - Fibonacci Confluence ($3885): This is an extremely ideal "Buy Zone," coinciding with the golden Fibonacci ratio of 0.618. In technical analysis, this is a very strong support level, where prices often tend to reverse and continue the main trend. Professional traders always hunt for pullbacks to this zone.
Buying Zone 2 - Exploiting FVG ($3914 - $3933): Slightly higher, we have the FVG (Fair Value Gap) area at $3914 and the "Buy Scalping" zone at $3933. These are "price gaps" created by supply-demand imbalances when prices rise too quickly. The market tends to return to fill these gaps before continuing its journey. This could be an opportunity for those wanting to catch an earlier wave.
3. Target Conquest - What’s Gold’s Next Destination? 🎯
Once we have a buying position, where will our target be?
Short-term target: The "Sell Scalping FVG" zone around $3969 could be a minor resistance point where some traders will take profits.
Main target: The ultimate destination this structure is aiming for is the "Sell Gold Liquidity" zone at $3998. This is an important "liquidity" area, concentrating many stop-loss orders of the Sellers. Prices are often attracted to these zones like a "magnet" to sweep liquidity before making further moves.
Summary & Advice
Main trend: UP.
Primary strategy: Buy on dip when prices correct to important support zones.
Potential buying zones: $3885 (Fibonacci) and $3914 - $3933 (FVG).
Price targets: $3969 (short-term) and $3998 (main target).
Always remember, risk management is the key to surviving in the market. Set reasonable Stop-loss for all your trades.
WHAT DO YOU THINK ABOUT THIS PLAN?
Will Gold retrace to the Fibonacci zone $3885 or react right at the FVG zone $3914? Leave your opinions and perspectives in the comments below. We will discuss together to find the best opportunities!
👇 Don't forget to Like 👍 and Follow my TradingView channel to not miss daily Gold analyses!

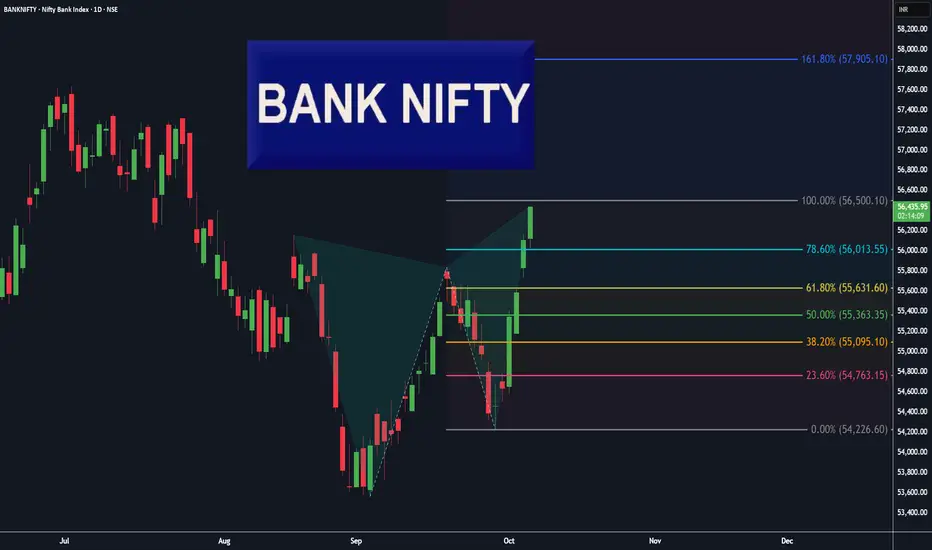
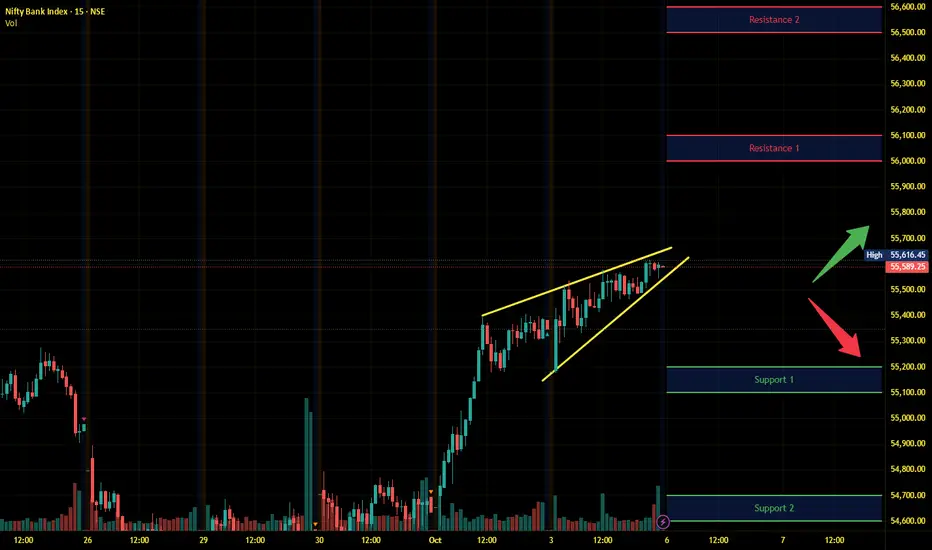
BankNifty Daily, Butterfly pattern completed!Beautiful Butterfly 🦋 pattern has completed on Daily chart of BankNifty.
Expect some profit booking or neutral trend in coming days up-to 55840 level.
Most near level is the re-test of 78.6% level ( 56013 ), for a new UP trend ( investors ).
" Buy 🟢 " above 56013 with the stop loss 🔻 of 55840, for the
🎯 Target 1: 56300
🎯 Target 2: 56500
🎯 Target 3: 57000
🎯 Target 4: open.
" Sell 🔴 " below 55631with the stop loss 🔺 of 55843, for the
🎯 Target 1: 55363
🎯 Target 2: 55095
🎯 Target 3: 54763
🎯 Target 4: open.
Smart Levels is Smart Trading. 👨🎓
⚠ RISK DISCLAIMER :
All content provided by "TradeWithKeshhav" is for information & educational purposes only.
It does not constitute any financial advice or a solicitation to buy or sell any securities of any type. All investments / trading involve risks. Past performance does not guarantee future results / returns.
Always do your own analysis before taking any trade.
Regards :
@TradeWithKeshhav & team
Happy Trading and Investing!
XAUUSD SHOWING A GOOD DOWN MOVE WITH 1:10 RISK REWARDXAUUSD SHOWING A GOOD DOWN MOVE WITH 1:10 RISK REWARD DUE TO THESE REASON
A. its following a rectangle pattern that stocked the marketwhich preventing the market to move any one direction now it trying to break the strong resistant lable
B. after the break of this rectangle it will boost the market potential for breakC. also its resisting from a strong neckline the neckline also got weeker ald the price is ready to break in the outer region
all of these reason are indicating the same thing its ready for breakout BREAKOUT trading are follws good risk reward
please dont use more than one percentage of your capitalfollow risk reward and tradeing rules that will help you to to become a bettertrader
thank you

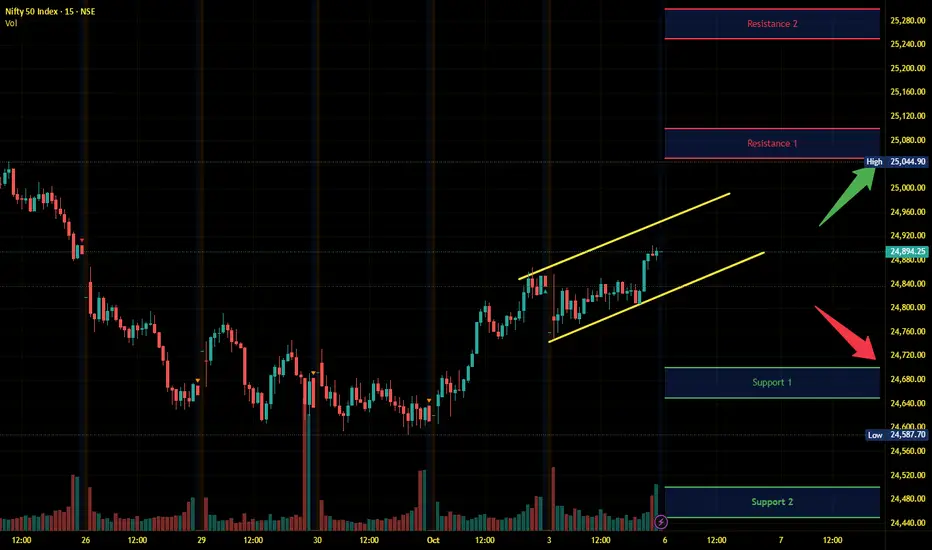
Nifty 50 Daily, Trend Based Fibonacci Extension (Natural levels)Hey Traders, I hope you all are doing well in your life.
Market is nature's response and Price is the God.
Let's check the market with the help of natural levels tool : Trend Based Fibonacci Extension .
After forming a ' W ' pattern on Daily chart, Nifty50 has given a pull-back ( base for Fib-Extension level tool, 24587 ).
Most near level is the re-test of 38.2% level ( 24980 ), for a new UP trend ( investors ).
" Buy 🟢 " above 25110 with the stop loss 🔻 of 24980, for the
🎯 Target 1: 25402
🎯 Target 2: 25650
🎯 Target 3: 26260
🎯 Target 4: 26500.
" Sell 🔴 " below 24960 with the stop loss 🔺 of 25110, for the
🎯 Target 1: 24880
🎯 Target 2: 24780
🎯 Target 3: 24680
🎯 Target 4: 24500.
Smart Levels is Smart Trading. 👨🎓
⚠ RISK DISCLAIMER :
All content provided by "TradeWithKeshhav" is for information & educational purposes only.
It does not constitute any financial advice or a solicitation to buy or sell any securities of any type. All investments / trading involve risks. Past performance does not guarantee future results / returns.
Always do your own analysis before taking any trade.
Regards :
@TradeWithKeshhav & team
Happy Trading and Investing!

Bank Nifty Neowave UpdateNSE:BANKNIFTY
Namaskaram Everyone
Welcome to intelligent investor, we provide market insights by synchronising and combining all the price action waves from different time frames and gives you single trend.
Degree Information

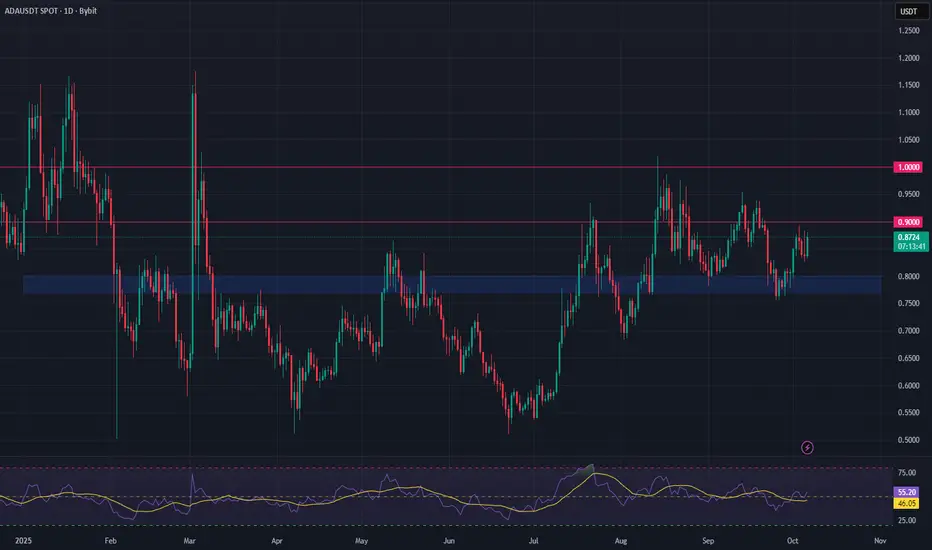
Cardano (ADA) – Bulls Regain Control, Eyes on $0.90 BreakoutCardano had a strong week, managing to hold above key support at $0.77 and closing with a bullish weekly candle. This price action signals a shift in momentum, with buyers back in control.
However, ADA now faces a critical test: the $0.90 resistance level. So far, bullish momentum hasn't been strong enough to force a breakout, but with the broader market showing strength, this level may not hold for long.
A confirmed breakout above $0.90 would be significant, opening the path for a potential move above $1 — a level not seen since mid-2022.
Looking forward, October has started with a strong bullish tone across the crypto market. If this continues, Cardano could be positioned for a fresh rally, provided bulls can take out the $0.90 resistance.
📌 Key Levels to Watch:
Support: $0.77
Resistance: $0.90
Target if breakout confirms: $1+
🟢 Bias: Bullish above $0.77
🔴 Risk: Failure at $0.90 could lead to a retest of support
XRP Breaks Above $3 – Bullish Momentum BuildsOverview:
XRP has officially closed the week above the $3 mark, a psychological resistance now turning into support. This is a major technical shift suggesting renewed bullish control.
🔑 Key Levels to Watch:
Support: $3.00
Short-Term Target: $3.20
Major Resistance / Magnet: $3.60 (All-Time High)
📊 Market Structure:
XRP appears to be breaking out of a consolidation zone between $2.70 and $3.00. This range held for several weeks, and a clean breakout could fuel a strong continuation toward previous highs.
🐂 Bullish Scenario:
Continued higher highs with volume could open the path to $3.20 and eventually $3.60.
A successful retest of the $3 level as support would further validate the breakout.
⚠️ Risk Note:
Watch for any fakeouts or low-volume rallies. A drop below $3 would negate the breakout and put the $2.70 support back in play.
📅 Outlook:
With Q4 2025 underway, a rally toward the ATH at $3.60 could be driven by both technical momentum and market sentiment.
💬 What’s your take? Are we heading for a new ATH this quarter?
📌 #XRP #Crypto #Altcoins #Breakout #TechnicalAnalysis #Q4Outlook

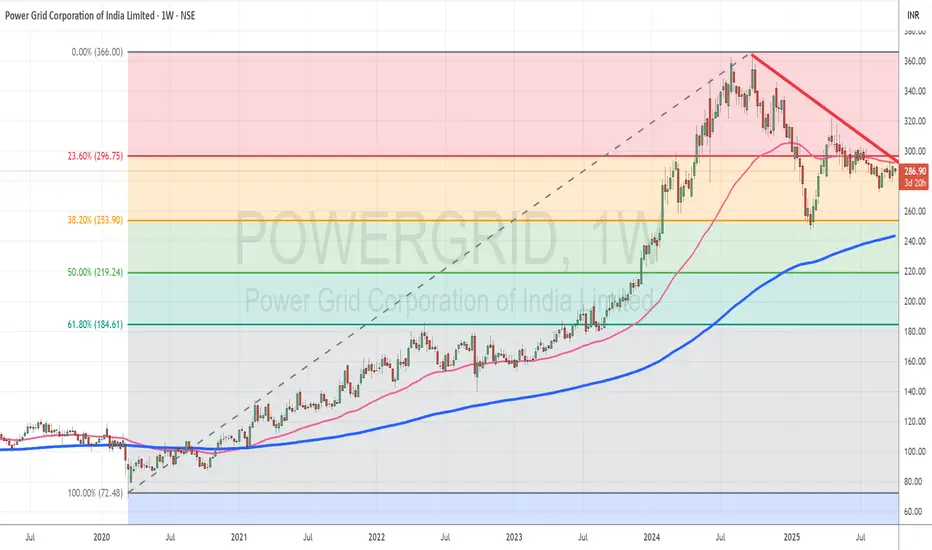
Powergrid stalls after failed V-shaped recoveryTopic Statement:
Powergrid attempted a V-shaped recovery but faced stiff resistance near 300, limiting its rebound and keeping the stock under short-term pressure.
Key Points:
1. The stock received strong support at the 38.2% Fibonacci retracement level, triggering an upward attempt
2. It is currently blocked by heavy resistance at the 23.6% retracement level at 296
3. Price remains below the 50-day EMA, making it moderately undervalued for short-term accumulation
4. The stock is following a downward trendline and faces resistance as it approaches it, with a breakout above this trendline likely to initiate a bullish move
XAUUSD : 06/10/25 - TP hit 1.Entry - NYSE session when FVG + P1 confirmed
2. MSS shift happend in 2 min during NY session
3. Entered during pullback
4. there are no High Resistance in either 4 hour or 1 hour but had one High resistance is there in 30 min TF , hence booked full at ATH
4. Closed full at 1:3
#ICT
Overall trend bullish hence looked for buy setups only

BUY TODAY SELL TOMORROW for 5%DON’T HAVE TIME TO MANAGE YOUR TRADES?
- Take BTST trades at 3:25 pm every day
- Try to exit by taking 4-7% profit of each trade
- SL can also be maintained as closing below the low of the breakout candle
Now, why do I prefer BTST over swing trades? The primary reason is that I have observed that 90% of the stocks give most of the movement in just 1-2 days and the rest of the time they either consolidate or fall
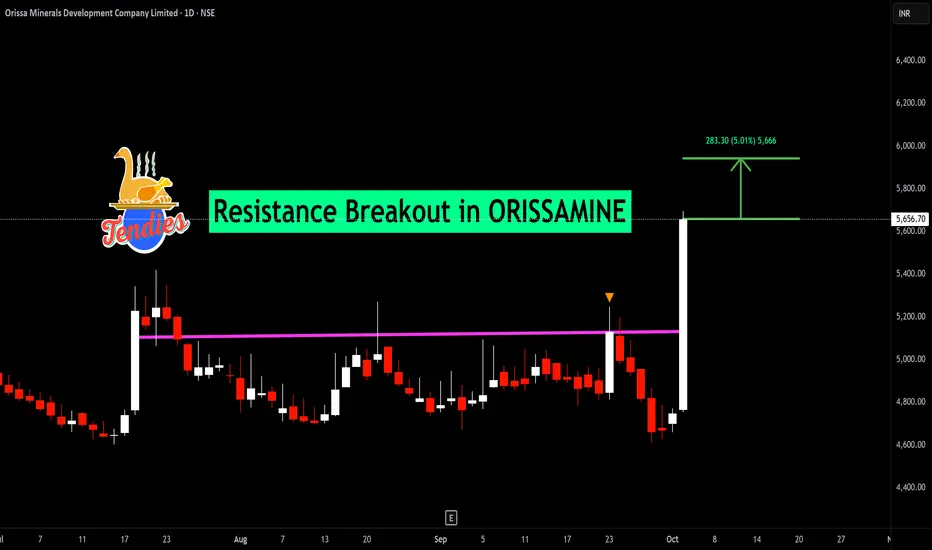
Resistance Breakout in ORISSAMINE
BUY TODAY SELL TOMORROW for 5%
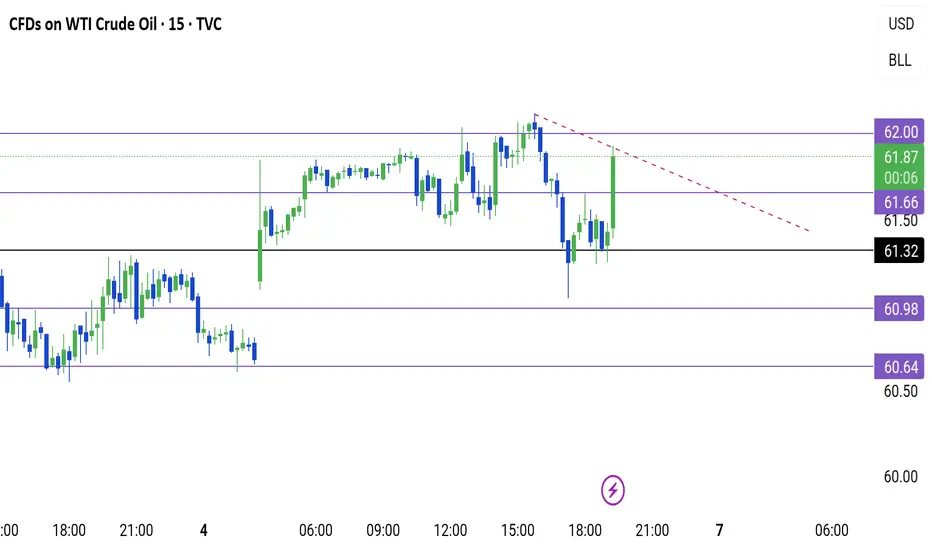
USOIL SUPPORT & RESISTANCE & TRENDLINEResistance at 61.66 and 62. If it breaks the said levels go for LONG.
For SHORT let it break 61.32 next at 60.98 and next at 60.64 if it breaks the last mentioned level it then a nice target downside.
If it breaks the trendline and sustains the plan for LONG.
Gold Breaks $3900: Safe-Haven Demand Soars & Fed Fuels the Rally📊 Market Context
Gold continues to assert its strength by breaking the psychological barrier of $3,900, becoming the central asset amidst financial and political turmoil.
US government shutdown → defensive capital flows strongly into gold.
Fed expected to cut interest rates by another 0.25 points → further strengthens the advantage for the non-yielding precious metal.
Lack of economic data → investors closely follow private reports, adding uncertainty and supporting gold's role as the “number 1 safe haven”.
👉 Market sentiment is perfectly aligned: USD under pressure, capital moving away from risky assets, BUY side FOMO continues to amplify → gold stands before the opportunity to climb and conquer the 3950–3990 range.
🔎 Technical Analysis (H1/H4)
Main trend: Strong uptrend, price holding above the rising trendline.
BUY ZONE 1: 3904–3902 → Volume CP Zone, supports momentum.
BUY ZONE 2: 3885–3883 → Retest old ATH, accumulation zone for the next rally.
SELL Zone: 3949–3950 → Liquidity Zone, prone to liquidity traps.
Extended target: 3994 (Fib 3.618).
🔑 Key Levels
BUY Zones: 3904–3902, 3885–3883
SELL Zone: 3949–3950
Resistance: 3950, 3994
Support: 3900, 3880
📈 Scenario & Trading Plan
✅ BUY ZONE 1: 3904–3902
SL: 3898
TP: 3910 - 3915 - 3925 - 3935 - 3945 - ???
✅ BUY ZONE 2: 3885–3883
SL: 3878
TP: 3895 - 3905 - 3920 - 3935 - 3945 - ???
⚠️ SELL ZONE (scalp/trap): 3949–3950
SL: 3955
TP: 3940 - 3935 - 3925 - ???
⚠️ Risk Management Notes
Liquidity may sweep above 3950 before adjusting → need to wait for price action confirmation.
Avoid FOMO at the peak, prioritize BUY only when price adjusts to support zones.
Order volume should be slightly reduced before unexpected Fed policy announcements.
✅ Summary
Gold is in the “golden phase” of an uptrend: political instability + dovish Fed + safe haven demand = BUY is the main strategy. Plan to accumulate around 3904–3902 and 3885–3883, with an extended target of 3950–3990. SELL is only a short-term strategy at the liquidity zone.
📢 Follow MMFLOW TRADING for real-time updates & BIGWIN setups with the team!

Nifty Intraday Analysis for 06th October 2025NSE:NIFTY
Index has resistance near 25050 – 25100 range and if index crosses and sustains above this level then may reach near 25250 – 25300 range.
Nifty has immediate support near 24700 – 24650 range and if this support is broken then index may tank near 24500 – 24450 range.
Banknifty Intraday Analysis for 06th October 2025NSE:BANKNIFTY
Index has resistance near 56000 – 56100 range and if index crosses and sustains above this level then may reach near 56500– 56600 range.
Banknifty has immediate support near 55200 - 55100 range and if this support is broken then index may tank near 54700 - 54600 range.
Finnifty Intraday Analysis for 06th October 2025NSE:CNXFINANCE
Index has resistance near 26600 - 26650 range and if index crosses and sustains above this level then may reach near 26800 - 26850 range.
Finnifty has immediate support near 26250 – 26200 range and if this support is broken then index may tank near 26050 – 26000 range.
Midnifty Intraday Analysis for 06th October 2025NSE:NIFTY_MID_SELECT
Index has immediate resistance near 12875 – 12900 range and if index crosses and sustains above this level then may reach 13000 – 13025 range.
Midnifty has immediate support near 12675 – 12650 range and if this support is broken then index may tank near 12550 – 12525 range.
Gold Soars on FOMO – 1000-Pip Opportunity Ahead!GOLD PLAN FOR 06.10 | Captain Vincent
✳️ Hello to all traders,
Today, we are not only analysing Gold (XAU/USD) from a purely technical perspective ⚙️, but also witnessing the perfect confluence between technicals and fundamental news. A bullish storm is forming, promising attractive trading opportunities.
📊 1. Technical Analysis: Sustainable Bullish Structure
From a technical standpoint, the uptrend of Gold on the H1 chart is undeniable.
🔹 Break of Structure (BoS):
Gold continuously breaks previous highs, indicating that buying pressure is completely dominant.
Each BoS point is a clear affirmation of the strength of the uptrend.
🔹 Potential Demand Zone:
After each rally, the price often takes a “pause” to accumulate.
Currently, the price may adjust to the $3,883,020 - $3,911,169 zone, where the confluence between Fair Value Gap (FVG) and Bullish Order Block (Bullish OB) – creates an ideal launchpad for the next rally.
🏦 2. Fundamental Analysis: The Fire Has Been Lit
If technicals show the way, then fundamental news is the fuel driving the uptrend.
🔸 US Government Shutdown:
This event creates political and economic instability, causing capital to flee from risky assets.
Gold – the number one safe haven – is directly benefiting as investors seek to preserve their assets.
🔸 Fed Ready to Cut Interest Rates:
The market is almost certain that the Fed will cut interest rates by 0.25%.
This reduces the appeal of the USD, further strengthening Gold's advantage, which is a non-yielding asset.
🔸 “Thirst” for Economic Data:
The government shutdown also disrupts the release of important economic data, leaving the market lacking information and increasing uncertainty.
In this environment, Gold continues to hold its safe haven role.
🎯 3. Comprehensive Trading Plan
When technicals and fundamentals align, the reliability of the trading strategy is significantly enhanced.
Strategy:
Wait to buy (Long) when the price adjusts to the demand zone $3,883,020 - $3,905,169.
Entry signals:
Observe confirmation of a bullish reversal in this zone such as:
Pin bar candles, engulfing
Or BoS on the M15 chart
Targets:
Short-term: $3950 – $3990
Long-term: Target “+1000 pips”
Risk management:
Place Stop Loss below the Bullish OB to protect the account.
🧭 Conclusion
The current market sentiment is very favourable for the Buyers:
USD is under downward pressure
Defensive capital flows are strongly moving into Gold
The FOMO effect can stimulate an extended rally
The combination of a solid technical structure and strong fundamental support is creating an almost perfect bullish picture.
👉 Be patient, stick to the plan, and await this golden opportunity.
💼 Wishing everyone an effective and victorious trading day!

SBI Cards : Double Bottom Breakout Ignites Bullish MomentumSBI Cards and Payments has given a strong bullish breakout from a well-defined double bottom pattern on the daily chart, indicating bullish potential
The price has crossed above the neckline zone, confirming the breakout strength. The structure suggests that buyers have regained control, and momentum indicators are supporting further upside.
Currently, the stock is showing sustained strength above its short-term moving averages, and the breakout candle has closed decisively above resistance.
Based on the pattern height and measured move projection, the next potential target comes around the ₹904 price level. Any retest towards the neckline could offer a fresh buying opportunity with a favorable risk-reward setup.
Key Levels:
Support: 845
Resistance: 904
Trend Bias: Bullish above 840
Conclusion:
The technical breakout from the double bottom pattern points towards renewed upward momentum in SBI Cards. A sustained move above 860–870 can accelerate the rally towards the 904 zone in the short term.
