Ola electric : Re entry opportunity Taking support.
Can re enter .
S loss can be 10% ..Long term stock .
Can generate generational wealth
Support and Resistance

Positive Momentum for Maruti SuzukiMaruti Suzuki is currently trading above a significant support level of ₹10,948 and is forming a triangle pattern. A breakout from this formation could lead to a bounce from these levels, potentially reaching the target of ₹13,530. Traders may consider entering at ₹10,942, with a minimum stop-loss placed slightly below the support zone at ₹10,660.
Fundamental Analysis of Maruti Suzuki for December 2024
Sales Performance: Maruti Suzuki sold 181,531 units in November 2024, with a significant portion coming from domestic sales.
Discount Offers: Year-end discounts are available across various models, enhancing customer incentives and potentially increasing footfall in dealerships.
Model Popularity: The Alto K10 and Swift are among the best-selling models this month, contributing to Maruti's strong market presence.

Investment Opportunity in Bajaj AutoBajaj Auto is currently trading around ₹8,600, presenting a potential buying opportunity as it has dropped 30% from its all-time high. This price level aligns with strong support, making it attractive for investors.
Fundamental Analysis of Bajaj Auto (2024):
Financial Performance:
Revenue: Increased from ₹33,145 crore in FY 2022 to ₹44,870 crore in FY 2024.
Net Profit: Rose from ₹6,166 crore in FY 2022 to ₹7,708 crore in FY 2024.
Profitability Metrics:
Operating Profit Margin: Improved from 16% to 20%.
Earnings Per Share (EPS): Increased from ₹212.5 to ₹272.7.
Market Valuation:
P/E Ratio: Approximately 31.27, suggesting a higher valuation.
Return on Equity (ROE): Strong at 26.43%.
Debt Management:
Low debt-to-equity ratio of 6.6, indicating sound financial health.

Apollo Tyres: Potential BounceApollo Tyres is currently positioned at a long-term trendline, which may indicate a potential bounce from these levels. Alternatively, investors might consider waiting for the stock to reach ₹440, a strong support level. The price has dropped approximately 20% from its all-time high.
Fundamental Points for Apollo Tyres (2024):
Market Capitalization: Approximately ₹33,260 crore.
P/E Ratio: Around 19.32, indicating reasonable valuation.
Debt-to-Equity Ratio: Low at 35.28, reflecting strong financial health.
Return on Equity (ROE): Approximately 13%, showcasing effective profit generation.
Sales Growth: Increased to ₹25,378 crore in FY 2024, up from ₹24,568 crore in FY 2023.

Jaiprakash Power Ventures:Support and Investment InsightsJaiprakash Power is currently at a strong support zone, making it an opportune time for investors to consider entry. There are three entry zones recommended for splitting investments. As a micro-cap stock, it’s advisable to allocate minor capital.
Fundamental Points for Jaiprakash Power (2024):
Market Capitalization: Approximately ₹12,110 crore.
P/E Ratio: Around 8.93, indicating reasonable valuation.
Return on Equity (ROE): Approximately 13.68%, reflecting decent profitability.
Debt-to-Equity Ratio: Low at 0.33, suggesting sound financial health.
Recent Performance: The stock has delivered a profit growth of 39.8% CAGR over the last five years.

Sundaram Fasteners: Potential Buying OpportunitySundaram Fasteners is currently at a strong support level around ₹1,000, having declined 30% from its all-time high. This presents a potential buying opportunity for investors.
Fundamental Points for Sundaram Fasteners (2024):
Market Capitalization: Approximately ₹22,566 crore.
P/E Ratio: Around 43.26, indicating a premium valuation.
Return on Equity (ROE): Approximately 16.33%, reflecting good profitability.
Debt-to-Equity Ratio: Low at 0.18, suggesting strong financial stability.
Dividend Yield: About 0.64%, providing some income to investors.
With solid fundamentals and current pricing near key support levels, Sundaram Fasteners may be an attractive investment opportunity for cautious investors.

DCB Bank: Potential Bounce at Key Support LevelsDCB Bank is currently positioned at a strong support level, coinciding with a trendline and the Value Area Level (VAL) in the volume profile. This alignment suggests a potential bounce from these levels. If the stock breaks above the trendline and reaches the Value Area High (VAH), a 30% upward movement could be expected.
Fundamental Points for DCB Bank (2024):
Market Capitalization: Approximately ₹3,621 crore.
P/E Ratio: Around 6.36, indicating it may be undervalued.
Return on Equity (ROE): Approximately 11.1%, reflecting decent profitability.
Gross NPA Ratio: Stands at 3.23%, indicating manageable asset quality.
Advances Growth: Reported a year-on-year increase of 19%, showcasing strong loan growth.
With solid fundamentals and current pricing near key support levels, DCB Bank presents an interesting opportunity for investors.

HBL Engineering: Key Support LevelsHBL Engineering is currently at a strong support level, sitting on a trendline, which could indicate a potential bounce. The stock has declined 22% from its all-time high, making it an interesting option for investors.
Fundamental Points for HBL Engineering (2024):
Market Capitalization: Approximately ₹6,500 crore.
P/E Ratio: Around 48.4, indicating a premium valuation.
Return on Equity (ROE): Strong at 23.01%, reflecting excellent profitability.
Revenue Growth: Impressive annual growth of 62.39%, outperforming historical averages.
Low Interest Expense: Less than 1% of operating revenues spent on interest, indicating financial efficiency.
With solid fundamentals and current pricing near key support levels, HBL Engineering may present a viable opportunity for investors.

Britannia Industries: Strong Support at Long-Term TrendlineBritannia Industries is currently at a significant support level, having touched a four-year long-term trendline. The stock has declined 24% from its all-time high, making it a potential buying opportunity for investors.
Fundamental Points for Britannia Industries (2024)
Market Capitalization: Approximately ₹1,19,229 crore.
P/E Ratio: Around 55.96, indicating a premium valuation.
Return on Equity (ROE): Approximately 54.28%, reflecting strong profitability.
Dividend Yield: About 1.48%, providing consistent income to investors.
Recent Performance: The stock has shown resilience with a recent increase of 3.06% on January 9, 2025.

Kalyan Jewelry: Technical Analysis and Investment OutlookFormation of Bat Pattern: Kalyan Jewelry has recently formed a Bat pattern, a bullish reversal pattern that suggests potential price increases in the near future.
Strong Support Level: The stock is currently trading at a significant support level around ₹525, which may provide a solid foundation for a price rebound.
Decline from All-Time High: The stock has already declined approximately 33% from its all-time high, indicating that it may be undervalued and presenting a buying opportunity for long-term investors.
Long-Term Investment Potential: Given the technical indicators and support levels, Kalyan Jewelry appears to be a promising option for long-term investment strategies.

BAJAJ AUTO - Buy for the target 9925/30Technical:
=> Internal Structure with strong Resistance Breakout done
=> Expecting to give good upside movement
=> Estimate target price will be 9925/30
=> Stoploss is around 9000 on closing basis
In Addition,
BAJAJ AUTO PASS ON THE FULL GST REDUCTION BENEFIT TO CUSTOMERS:
Bajaj Auto Ltd. has announced it will pass on the benefit of the recent GST reduction to customers across its motorcycle and three-wheeler range. Effective September 22, 2025,
The reduction is up to ₹20,000 on two-wheelers and up to ₹24,000 on the three-wheeler range.
== EDUCATIONAL PURPOSE ONLY ==

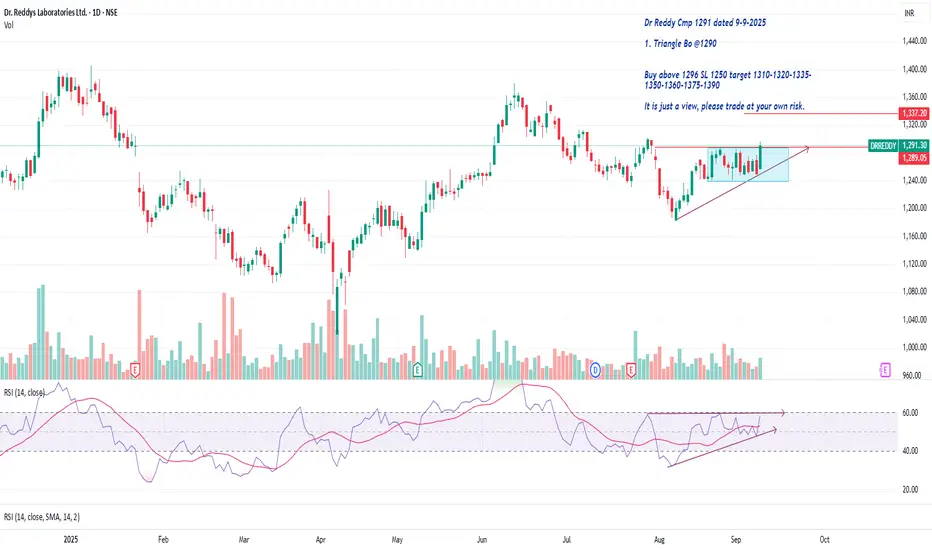
Dr Reddy Cmp 1291 Triangle BoDr Reddy Cmp 1291 dated 9-9-2025
1. Triangle Bo @1290
Buy above 1296 SL 1250 target 1310-1320-1335-
1350-1360-1375-1390
It is just a view, please trade at your own risk.
Gold Plan - Waiting for a pullback to Buy safely | New ATH ahead🟡 XAU/USD – 09/09 | Captain Vincent ⚓
🔎 Captain’s Log – News Context
FED : The probability of a September rate cut is now almost certain, reinforcing confidence that flows will continue moving into Gold.
Dollar : Dropped to a 7-week low due to FED rate cut expectations, adding further support for Gold.
US Economic Data : No major news today, the market focus remains on interest rates.
⏩ Captain’s Summary: Gold remains in a strong uptrend. However, Vincent advises waiting for a pullback into support to Buy safely , avoiding chasing price at higher levels.
📈 Captain’s Chart – Technical Analysis
Storm Breaker (Resistance / Sell Zone) :
Quick Boarding: 3654 – 3656 (Short-term Sell scalp)
Storm Breaker Peak: 3673 – 3675 (Sell zone – potential new ATH)
Golden Harbor (Support / Buy Zone) :
Buy Scalp Dock: 3615 – 3617
Main Golden Harbor: 3597 – 3599 (Strong support)
Price structure remains bullish after multiple BOS – Break of Structure. Current highs may trigger short-term profit-taking waves before Gold pulls back to Golden Harbor and then rallies toward ATH 367x .
🎯 Captain’s Map – Trade Scenarios
✅ Golden Harbor (BUY – Priority with trend)
Buy Scalp: 3615 – 3617 | SL: 3598 | TP: 3620 → 3623 → 3626 → 3630 → 36xx
Main Buy Zone: 3597 – 3599 | SL: 3589 | TP: 3660 → 3663 → 3666 → 3670 → 36xx
⚡ Quick Boarding (SELL Scalp – Only at resistance)
Sell Zone 1: 3654 – 3656 | SL: 3662 | TP: 3650 → 3647 → 3644 → 3640 → 36xx
Sell Zone 2 – Storm Breaker Peak (ATH test): 3673 – 3675 | SL: 3682 | TP: 3670 → 3667 → 3664 → 3660 → 36xx
⚓ Captain’s Note
“The interest rate winds from the FED continue to power the Golden sails. Golden Harbor 🏝️ (3597 – 3599) is the safe haven for sailors trusting the bullish tide. Quick Boarding 🚤 (3615 – 3617) is just a short ride before the voyage resumes. Storm Breaker 🌊 (3654 – 3675) may bring big waves, but it’s only suitable for technical scalps – as the main current still carries Gold toward new highs.”

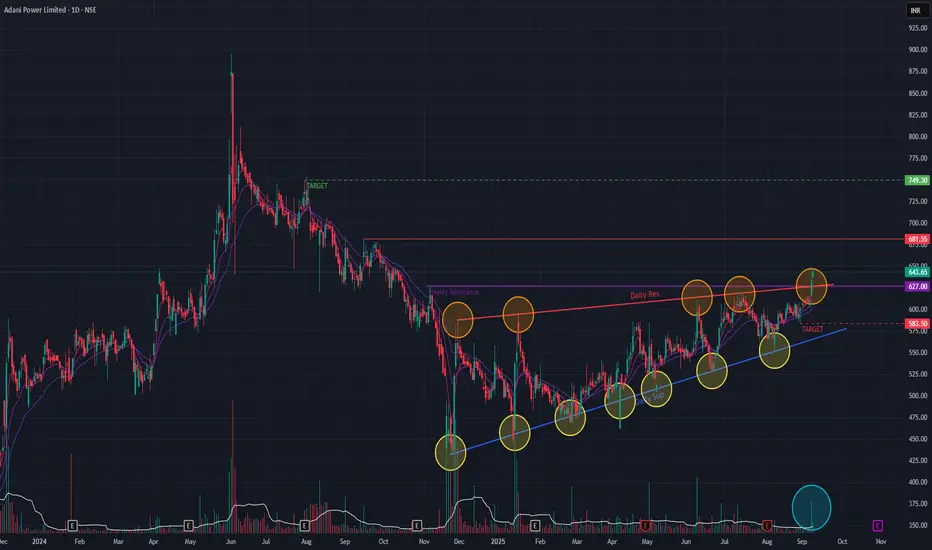
Adani Power (Daily Timeframe) - Bullish BreakOut or NotAdani Power has been in an uptrend since Nov 2024 & has formed a Triangle pattern. The past two days it has BrokenOut of the Triangle pattern with exceptionally huge volume indicating buyer interest. Short-term EMAs are in PCO state as well as the stock has breached two major resistance trendlines asserting Bullishness. A Golden Cross-over has formed since few days, indicating Bullishness
We may see levels of 749 if the momentum continues as well as a major resistance trendline is breached. It may go down to 583 levels if momentum is not sustained.
Keep monitoring the price-action !!
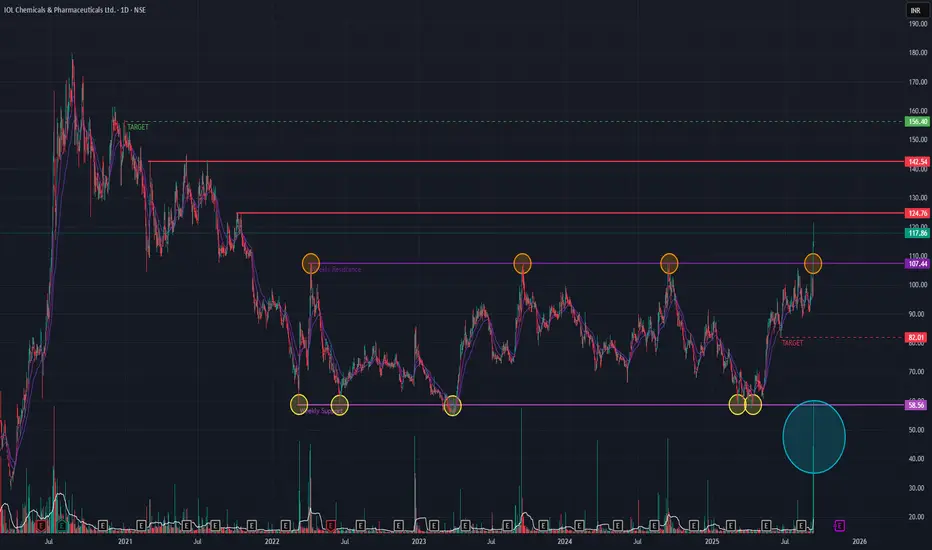
IOL CP (Daily Timeframe) - Has the Sideways Trend BrokenOut ??IOL CP in the past two sessions have BrokenOut of the sideways trend that it was in since Mar 2022. Several attempts in the past to BreakOut of this trend has failed as indicated. The past two days, the stock was able to BreakOut as well as maintain it with huge volume. Short-term EMAs are in PCO state as well as a Golden Cross-over has formed few days back indicating bullishness.
If upside momentum continues then we may see 156 levels provided few resistances are breached. The stock may see 82 levels if the momentum is not sustained.
Keep monitoring the price-action !!
Motherson Sumi (Daily Timeframe) - A new ATH ??MSumi has broken out of a major resistance trendline today after couple of earlier attempts as indicated. The volume has been exceptionally high since last week. Today as well the volume was huge indicating buyer interest. Short-term EMAs are in PCO state indicating Bullishness. If the momentum continues, we may see the stock making new ATH. Few major resistances to be breached before it can achieve new ATH.
If the stock is able to sustain the momentum, then we may see 67 levels on the upside & if the trend reverses, we may see 40 levels on the downside.
Keep watching!!

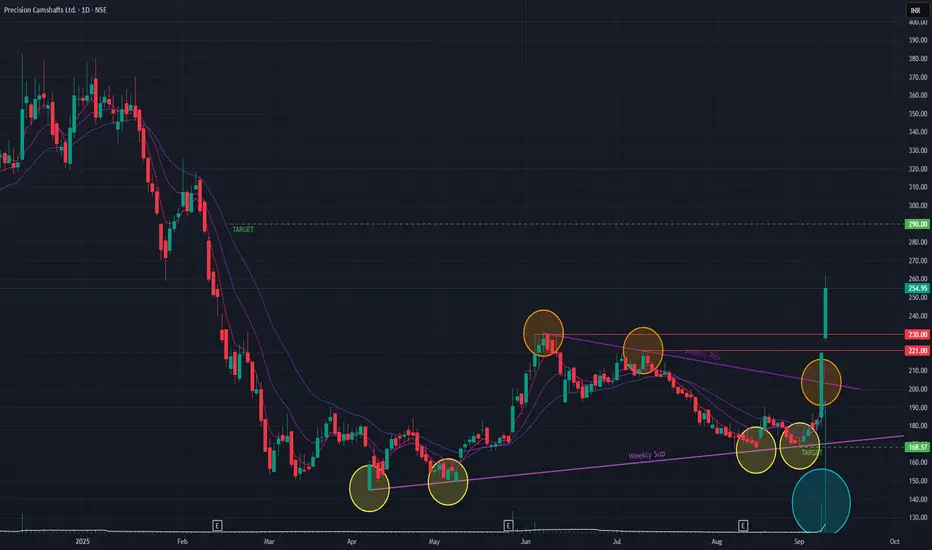
Precision Camshafts (Daily Timeframe) - Momentum Or NotPrecision Camshafts is on a bullish rally since yesterday, gaining +39.29%. Key observations to note are that since the ATH in Dec 2024, the stock was in a downtrend which has reversed since Apr 2025, as the stock been forming Higher Lows. and a Triangle pattern is formed as shown. Since the past two sessions, the stock is able to BreakOut of the Triangle pattern as well as BreakOut of the Daily resistance trendlines with huge volumes, showing buyer interest.
On an upside, if the momentum continues, we may see the stock go to 290 levels. If the stock is unable to sustain the momentum and goes down, we may see 168 levels.
Price-action in the coming days will dictate how the stock goes forward. Keep monitoring !!
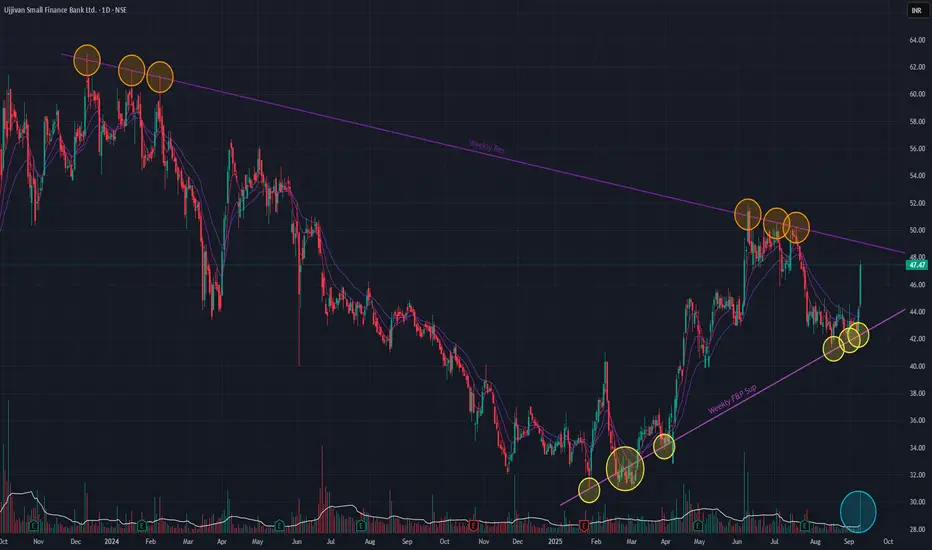
Ujjivan SFB (Daily Timeframe) - Potential BreakOut Candidate ??Ujjivan has been on a downtrend since making the ATH in Dec 2023. Since Feb 2025, there has been a reversal where the stock is making Higher Lows while respecting the support trendline. Since the ATH, the stock has attempted several occasions to BreakOut of the angular resistance trendline, but failed. The past two days there has been a surge in stock price accompanied by huge volume, showing bullishness. Short-term EMAs are also in a PCO state.
Let's wait for the stock to BreakOut of the resistance trendline. Keep monitoring!!
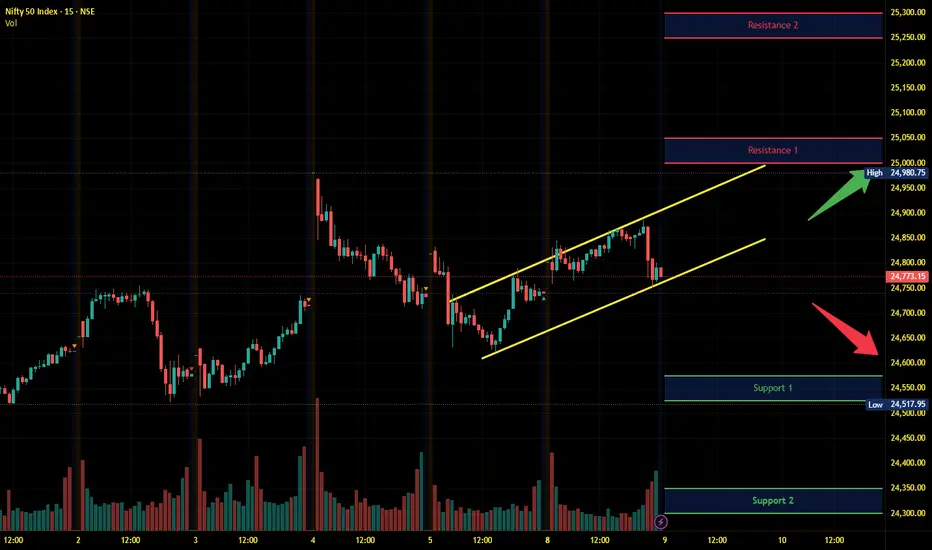
Nifty Intraday Analysis for 09th September 2025NSE:NIFTY
Index has resistance near 25000 – 25050 range and if index crosses and sustains above this level then may reach near 25250 – 25300 range.
Nifty has immediate support near 24575 – 24525 range and if this support is broken then index may tank near 24350 – 24300 range.
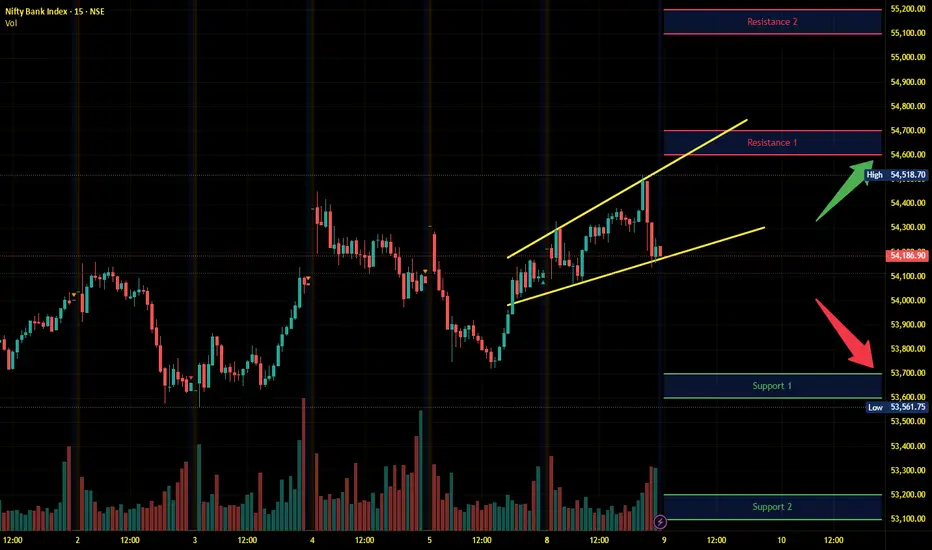
Banknifty Intraday Analysis for 09th September 2025NSE:BANKNIFTY
Index has resistance near 54600 – 54700 range and if index crosses and sustains above this level then may reach near 55100– 55200 range.
Banknifty has immediate support near 53700 - 53600 range and if this support is broken then index may tank near 53200 - 53100 range.
Finnifty Intraday Analysis for 09th September 2025NSE:CNXFINANCE
Index has resistance near 26100 - 26150 range and if index crosses and sustains above this level then may reach near 26300 - 26350 range.
Finnifty has immediate support near 25750 – 25700 range and if this support is broken then index may tank near 25550 – 25500 range.

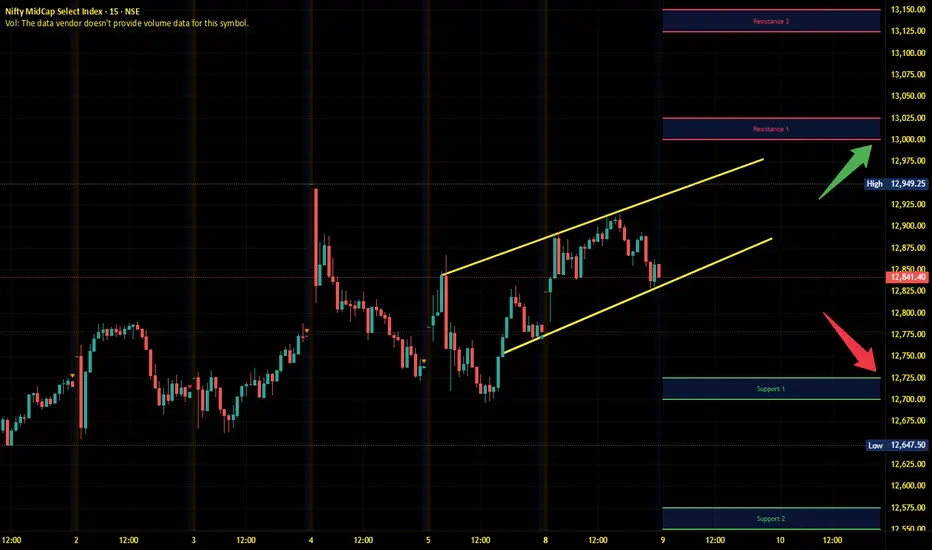
Midnifty Intraday Analysis for 09th September 2025NSE:NIFTY_MID_SELECT
Index has immediate resistance near 13000 – 13025 range and if index crosses and sustains above this level then may reach 13125 – 13150 range.
Midnifty has immediate support near 12725 – 12700 range and if this support is broken then index may tank near 12575 – 12550 range.
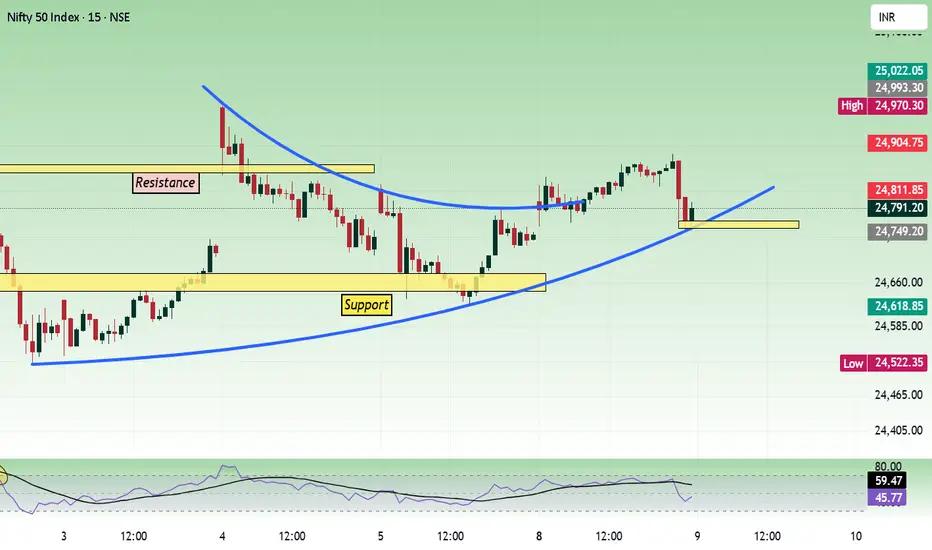
Nifty - Multi time frame analysis Sep 9Today, the price did not gain strength and moved in the range of 24700 to 24900. And 25000 is a psychological level. This type of nearby support/resistance can give choppy movement unless the price shows strength from the opening.
Support levels are 24500, 24600. Resistance levels are 24900, 25000.
We can buy if the price opens at support with bullish strength.
If the opening is flat, buy above 24820 with the stop loss of 24770 for the targets 24860, 24920, 24980, 25020, and 25080.
Sell below 24680 with the stop loss of 24730 for the targets 24640, 24600, 24540, 24500, 24460 and 24420.
As per the daily chart, the price is moving in a range, and it also has nearby trendline resistance.
Strong movement can happen if the trend line is taken with strength.
As per the hour chart, if the price does not gain strength when breaking the range it has formed today, then the expiry will be in range.
Expected expiry day range is 24400 to 24900.