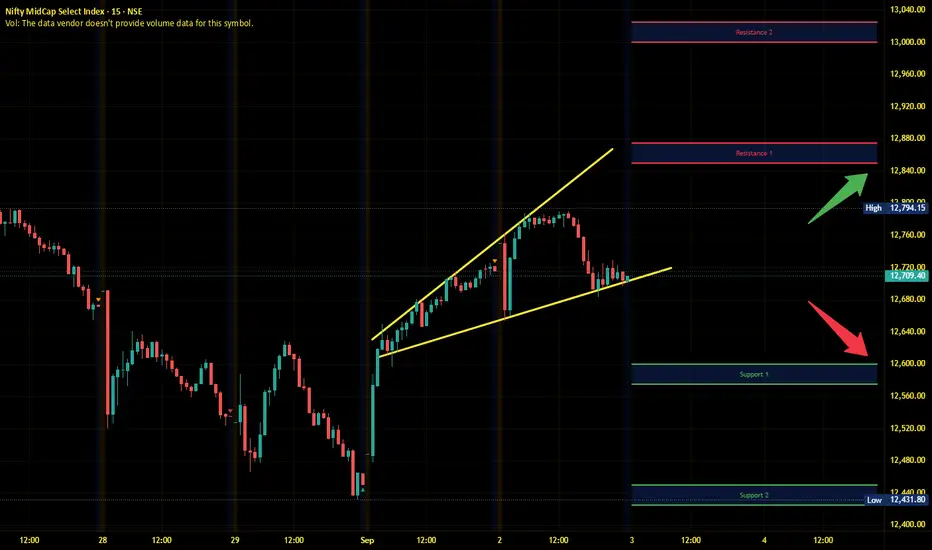
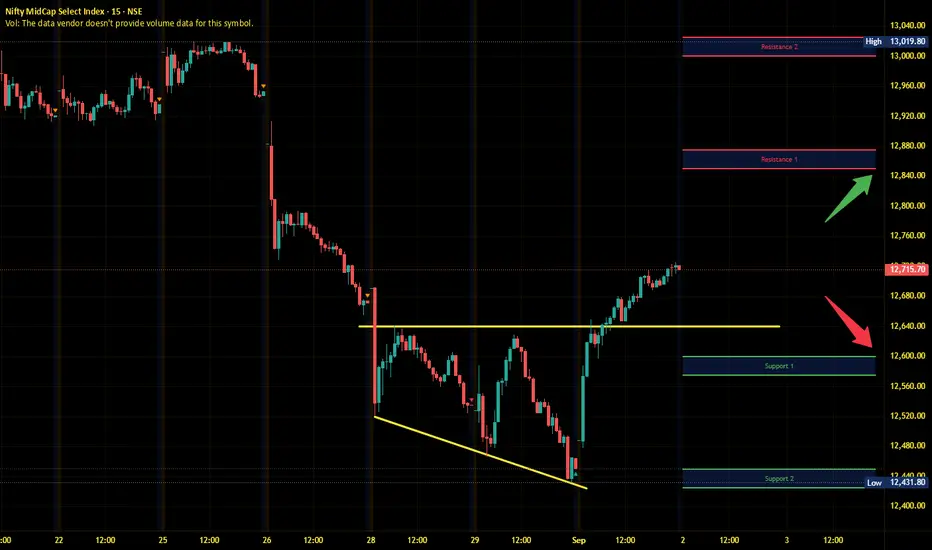
Midnifty Intraday Analysis for 03rd September 2025NSE:NIFTY_MID_SELECT
Index has immediate resistance near 12850 – 12875 range and if index crosses and sustains above this level then may reach 13000 – 13025 range.
Midnifty has immediate support near 12600 – 12575 range and if this support is broken then index may tank near 12450 – 12425 range.
Fresh escalation in trade war by the US will increase volatility in the global market.
Support and Resistance
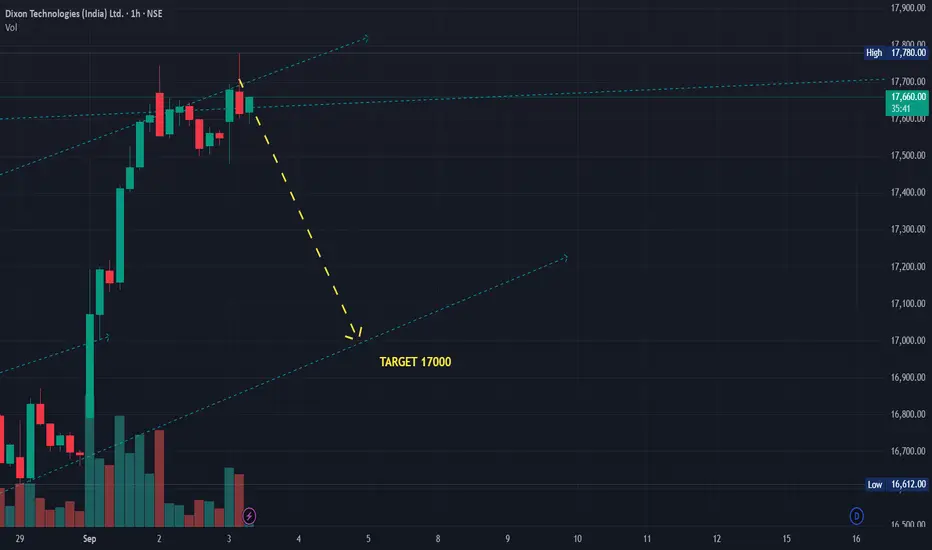
DIXON Short position - 1week overview and Price Targets AnalysisDIXON Short Term 1 week overview and Price Targets Analysis for Study Purpose only.
SHORT CMP around 17650 Target 17000 in next 5-10 days
SL if close in 1 hour candle is above the top channel in chart shown
Simple Support & Resistance Strategy on XAUUSDThis chart illustrates a simple but effective support and resistance trading approach.
Support Levels:
Support 1: Acts as a key demand zone where buyers may step in if price revisits this area.
Support 2: A minor intraday support that can provide short-term bounce opportunities.
Resistance Levels:
Resistance 1: The broader supply zone where sellers previously pushed price lower.
Resistance 2: A closer level that may act as a barrier for short-term upward moves.
What’s Happening:
Currently, price has broken below Support 2 and is testing downward momentum. Two possible scenarios are highlighted:
Price retests Support 1, holds, and then bounces back toward Resistance 2.
Price fails to hold at Support 1, leading to further downside continuation.
Probability Outlook:
If buyers defend Support 1 strongly, probability favors a bounce toward Resistance 2.
If Support 1 breaks with volume, probability favors a bearish continuation move to lower levels.
This setup shows how simple zone-to-zone trading can provide clear potential paths without overcomplication.
👉 Always remember: This is not financial advice, but an educational demonstration of support/resistance principles.

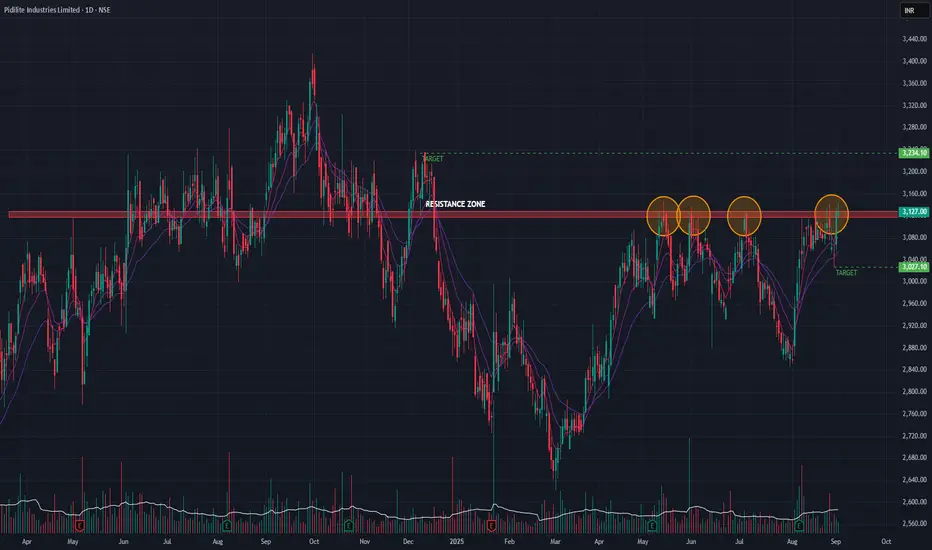
Pidilite Industries (Daily Timeframe) - Potential BreakOut??Pidilite, though with good earnings in the past quarter has not been able to BreakOut of the support turned resistance zone. Few attempts has been made but none of them were successful. The recent past, the stock has been making Equal Highs and Higher Lows. Volume has been decent though. Short-term EMAs are in Positive Cross-Over state.
On upside, the target may be around 3234 & on downside it may go upto 3027.
Monitor the price action in the coming days.
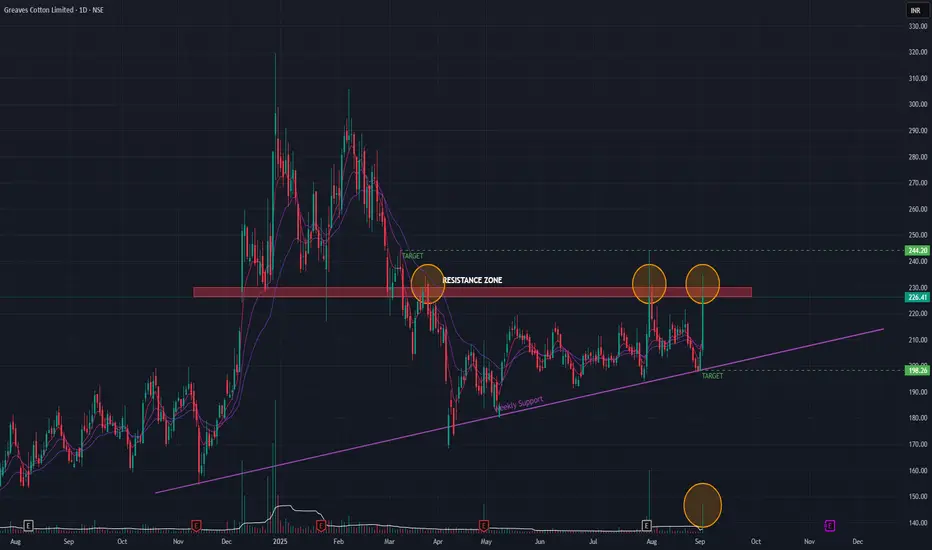
Greaves Cotton (Daily Timeframe) - Will it BreakOut or Not?Greaves Cotton since it's Double-Top formation has been in a downtrend. A key support level has become a resistance zone, which it's been trying to BreakOut few times. The stock has been forming Higher Lows for a while now. Few attempts to BreakOut has been futile. The recent BreakOut attempts been with huge volume spikes. Short-term EMAs are in positive cross-over state.
If it's able to BreakOut then the possible upside target is around 244. If not, we can expect the stock to go down to 198 levels.
Keep monitoring.
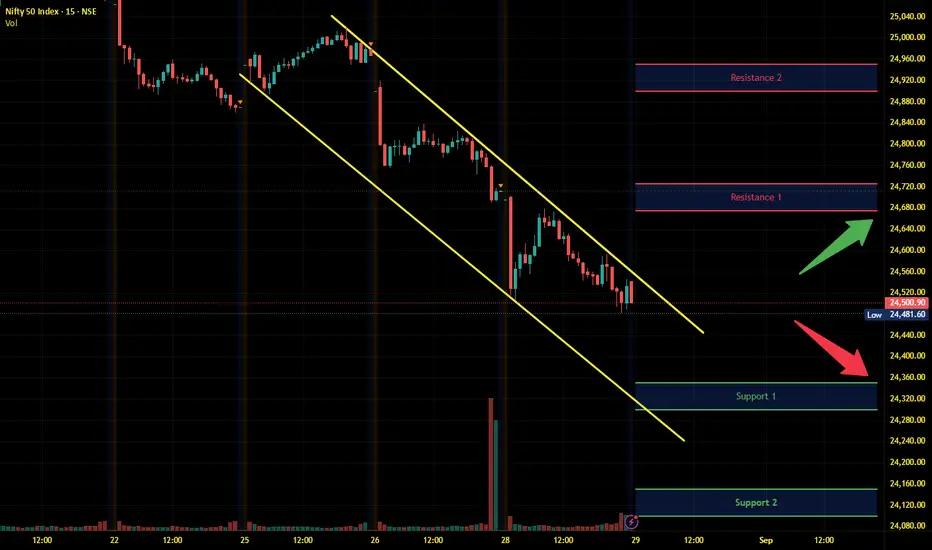
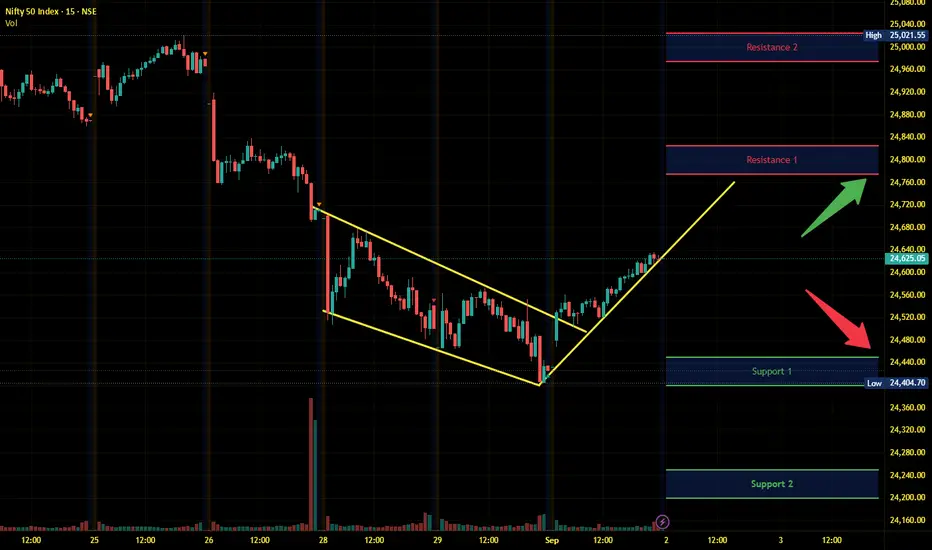
Nifty - Expiry Day Analysis Sep 2Nifty weekly expiry will be on Tuesday. Price gave a bullish move as per the falling wedge pattern. But the movement was slow and not that trending. Sustaining above 24600 can make the price move towards 24700. 24680 - 24700 is the nearby resistance.
Buy above 24620 with the stop loss of 24570 for the targets 24660, 24700, 24760, and 24820.
Sell below 24480 with the stop loss of 24530 for the targets 24440, 24400, 24340, and 24280.
Expected expiry day range is 24450 to 24750.
Always do your analysis before taking any trade.

Bullish trend intact, waiting for PMI to spark the next waveCaptain Vincent – Gold Plan XAU/USD
1. Market Waves 🌍
The USD continues to weaken as investors grow more confident that the FED will cut rates in the coming months. With the greenback losing appeal, large flows are leaving cash and moving into safe-haven assets → gold stands out as the number one choice .
👉 This supports gold’s sustainable bullish trend . If USD selling pressure persists, the market could see fresh breakouts into year-end.
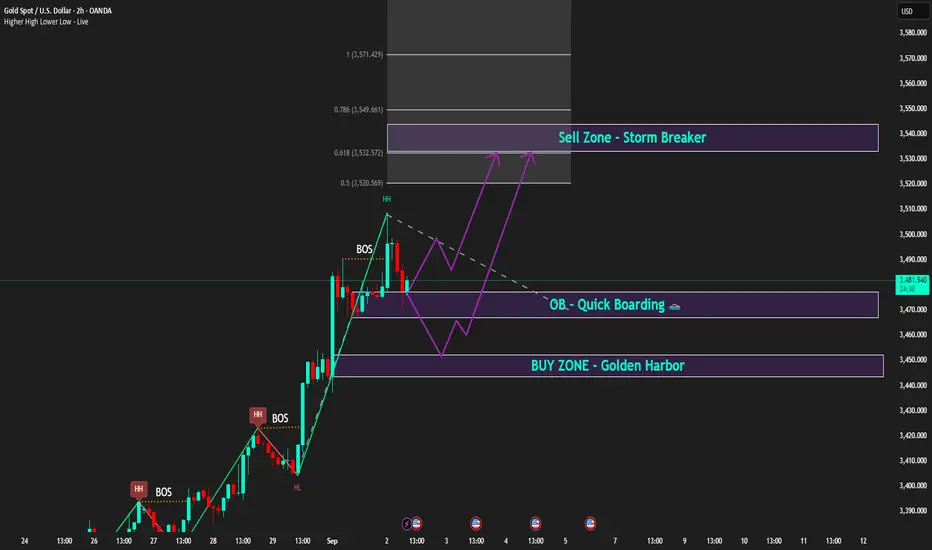
2. Technical Outlook ⚙️
H2 Chart: gold just created a Higher High after BOS , confirming bullish dominance.
Golden Harbor 🏝️ (Buy Zone 3,450 – 3,452): aligned with previous FVG , heavy liquidity zone.
Quick Boarding 🚤 (OB ~3,470): intermediate support, ideal for quick pullback entries.
Storm Breaker 🌊 (Sell Zone 3,538 – 3,540): resistance at Fibo 0.618 – 0.786 , strong chance of profit-taking if tested.
Intraday bias: Wait for pullback to Buy. Short-term Sell only if price hits Storm Breaker.
3. Captain Vincent’s Map – Key Levels 🪙
Golden Harbor 🏝️ (Buy Zone): 3,450 – 3,452
Quick Boarding 🚤 (OB Support): 3,470
Storm Breaker 🌊 (Sell Zone): 3,538 – 3,540
4. Trade Scenarios 📌
🔺 Golden Harbor 🏝️ (BUY – Priority)
Entry: 3,450 – 3,452
SL: 3,444
TP: 3,455 → 3,458 → 3,462 → 3,465 → 34xx
🔻 Storm Breaker 🌊 (SELL Reaction)
Entry: 3,538 – 3,540
SL: 3,548
TP: 3,535 → 3,532 → 3,529 → 35xx
5. Captain’s Note ⚓
“The gold sail is still filled with bullish wind, but Storm Breaker 🌊 above may create counter waves. Stay patient at Golden Harbor 🏝️ for precise entries, and watch the PMI at 21:00 – the catalyst for the next wave.”
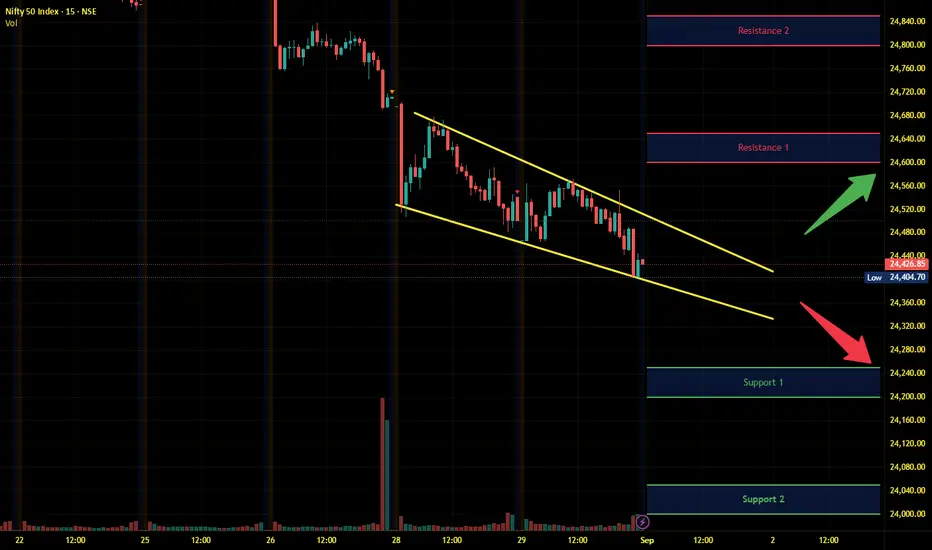
Nifty Intraday Analysis for 02nd September 2025NSE:NIFTY
Index has resistance near 24775 – 24825 range and if index crosses and sustains above this level then may reach near 24975 – 25025 range.
Nifty has immediate support near 24450 – 24400 range and if this support is broken then index may tank near 24250 – 24200 range.
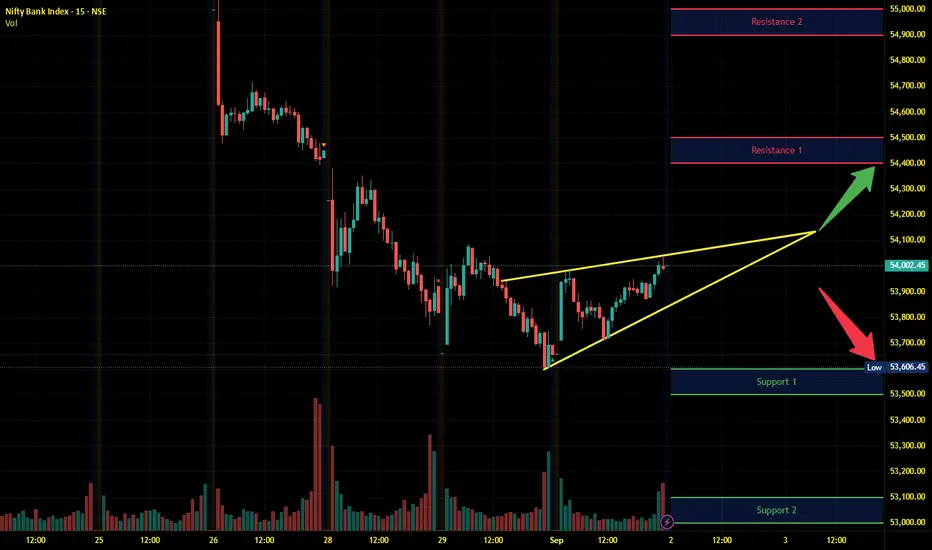
Banknifty Intraday Analysis for 02nd September 2025NSE:BANKNIFTY
Index has resistance near 54400 – 54500 range and if index crosses and sustains above this level then may reach near 54900– 55000 range.
Banknifty has immediate support near 53600 - 53500 range and if this support is broken then index may tank near 53100 - 53000 range.
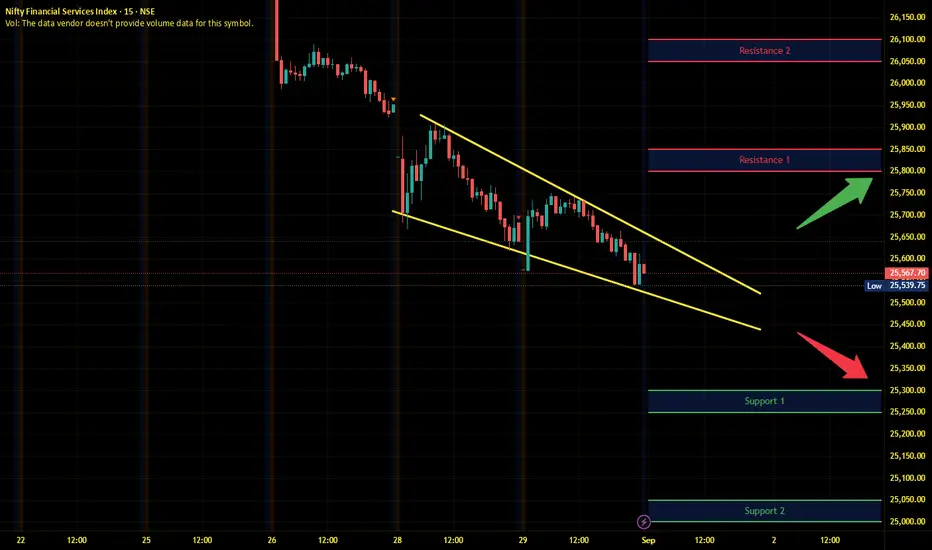
Finnifty Intraday Analysis for 02nd September 2025NSE:CNXFINANCE
Index has resistance near 25950 - 26000 range and if index crosses and sustains above this level then may reach near 26200 - 26250 range.
Finnifty has immediate support near 25550 – 25500 range and if this support is broken then index may tank near 25350 – 25300 range.

Midnifty Intraday Analysis for 02nd September 2025NSE:NIFTY_MID_SELECT
Index has immediate resistance near 12850 – 12875 range and if index crosses and sustains above this level then may reach 13000 – 13025 range.
Midnifty has immediate support near 12600 – 12575 range and if this support is broken then index may tank near 12450 – 12425 range.
Nifty Intraday Analysis for 01st September 2025NSE:NIFTY
Index has resistance near 24600 – 24650 range and if index crosses and sustains above this level then may reach near 24800 – 24850 range.
Nifty has immediate support near 24250 – 24200 range and if this support is broken then index may tank near 24000 – 23950 range.
Gap up opening expected due to better than projected India’s GDP growth in Q1 FY 2025-26 and bilateral agreements with Japan and China. Day closing is more important than opening and Positive closing will decide trends in the upcoming short term.
Banknifty Intraday Analysis for 01st September 2025NSE:BANKNIFTY
Index has resistance near 54000 – 54100 range and if index crosses and sustains above this level then may reach near 54500– 54600 range.
Banknifty has immediate support near 53100 - 53000 range and if this support is broken then index may tank near 52600 - 52500 range.
Gap up opening expected due to better than projected India’s GDP growth in Q1 FY 2025-26 and bilateral agreements with Japan and China. Day closing is more important than opening and Positive closing will decide trends in the upcoming short term.
Finnifty Intraday Analysis for 01st September 2025NSE:CNXFINANCE
Index has resistance near 25800 - 25850 range and if index crosses and sustains above this level then may reach near 26050 - 26100 range.
Finnifty has immediate support near 25300 – 25250 range and if this support is broken then index may tank near 25050 – 25000 range.
Gap up opening expected due to better than projected India’s GDP growth in Q1 FY 2025-26 and bilateral agreements with Japan and China. Day closing is more important than opening and Positive closing will decide trends in the upcoming short term.
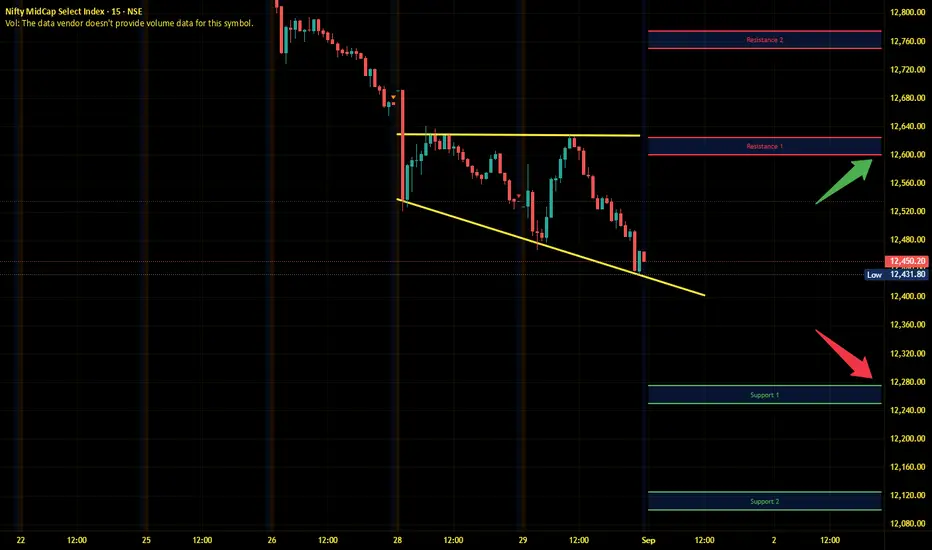
Midnifty Intraday Analysis for 01st September 2025NSE:NIFTY_MID_SELECT
Index has immediate resistance near 12600 – 12625 range and if index crosses and sustains above this level then may reach 12750 – 12775 range.
Midnifty has immediate support near 12275 – 12250 range and if this support is broken then index may tank near 12125 – 12100 range.
Gap up opening expected due to better than projected India’s GDP growth in Q1 FY 2025-26 and bilateral agreements with Japan and China. Day closing is more important than opening and Positive closing will decide trends in the upcoming short term.
Gold consolidates as new alliances emerge | Captain Vincent 1. News Wave 🌍
At the two-day summit in Shanghai, Prime Minister Modi and President Xi Jinping announced that India and China will become development partners rather than competitors.
The meeting also included Russia and four Central Asian nations, aiming to form a Southern Hemisphere bloc to counterbalance the US and the West.
👉 This signals a shift in geopolitical power, heightening concerns of global polarization → Gold continues to hold its safe-haven position.
2. Technical Analysis ⚙️
On the H2 chart, Gold has formed a Higher High after the recent strong breakout.
Storm Breaker 🌊 (Sell Zone 3511 – 3518): Strong resistance, potential for supply if price retests.
Golden Harbor 🏝️ (Buy Zone 3450 – 3448): Confluence with FVG + Fibonacci 0.5/0.618, a key support for pullback entries.
Main Trend: Gold likely to move sideways between 3450 – 3510 before choosing a major direction.
3. Captain Vincent’s Map – Trade Scenarios 🪙
🔻 Storm Breaker 🌊 (SELL Reaction)
Entry: 3511 – 3508
SL: 3518
TP: 3505 → 3500 → 3497 → 349x → 348x
🏝️ Golden Harbor (BUY Zone – Strong Support)
Entry: 3450 – 3448
SL: 3440
TP: 3453 → 3456 → 3459 → 3462 → 346x
4. Captain’s Note ⚓
"Political news continues to stir the golden sea 🌊. Bears are waiting at Storm Breaker 3511, but the safe harbor remains Golden Harbor 3450 – 3448. In such unpredictable waters, prioritise short-term sells to flow with safe-haven demand, rather than recklessly facing the storm."

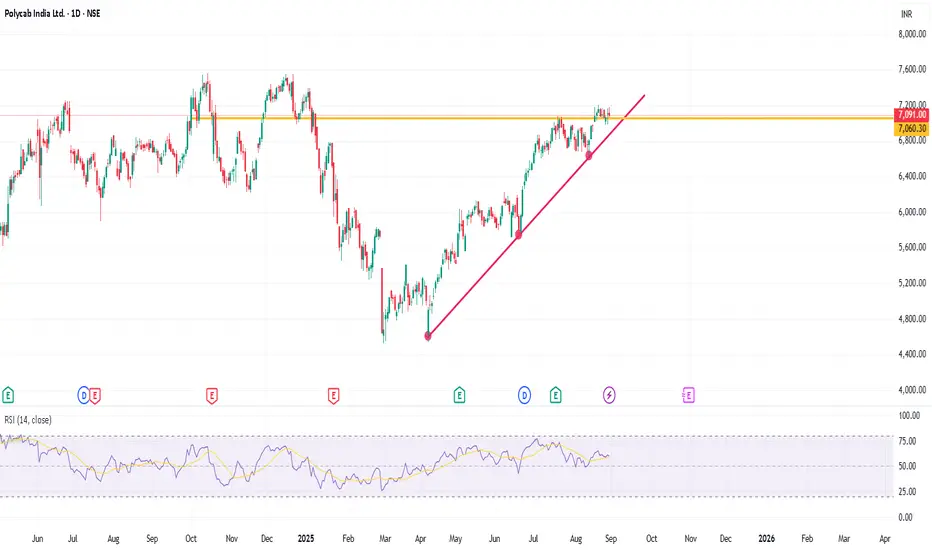
POLYCABThis analysis is intended solely for educational purposes and does not constitute financial advice.
Polycab is showing gradual bullish momentum, supported by a trendline reversal and trading above a key support level. The stock is currently in a minor consolidation phase, which may signal accumulation before a potential breakout.
Given the technical setup, there's a high probability of continued upward movement. However, to manage risk effectively, it's essential to use a stop-loss strategy.
SMHSMH VanEck SemiConductor ETF
CMP: $293.64
In July 2024, SMH posted a high of $281.82, followed by a consolidation phase with a bottom at $170.11.
The recent rally to $302.98 marks a strong recovery from those lows, confirming a breakout above the key resistance zone of $234–262. A retest of this breakout zone is still pending, with the weekly support cluster
$224–235 being an area of concern as gap formed on 12th May 2025.
Until a decisive move emerges, the price action may remain sideways in the weeks/months ahead.

Nifty - Weekly Review Sep 1 to Sep 5Price action has formed a falling wedge pattern in Nifty. The falling wedge pattern is bullish, and sustaining a price above 24500 is crucial. The zone 24400 to 24500 will act as a choppy zone.
Buy above 24520 with the stop loss of 24460 for the targets 24560, 24620, 24680, 24720, and 24760.
Sell below 24380 with the stop loss of 24430 for the targets 24340, 24280, 24220, 24160, 24120, and 24080.
The main trend is bearish, and the minor trend is bullish unless bulls show their strength.
Always do your analysis before taking any trade.

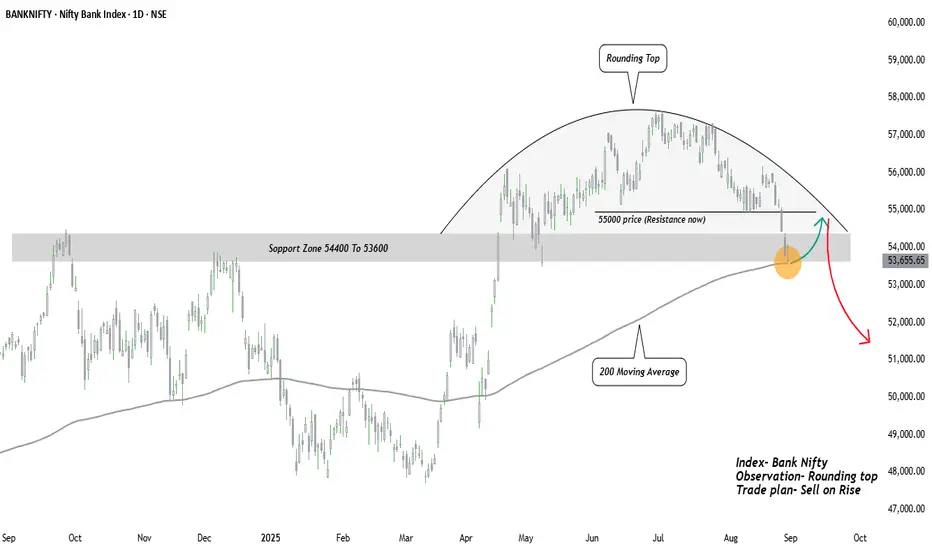
Distribution in Action: BankNifty AnalysisHello TradingView community, hope you’re doing well! Today I’m sharing an important BankNifty setup as the index approaches a critical make or break zone.
The BankNifty has recently displayed a rounded top structure, a classic sign of distribution and gradual weakness. After weeks of sideways-to-down movement, the index has now broken below the 55000 psychological mark, bringing attention to the major support zone, which also aligns with the 200-day moving average.
Key Observations-:
Rounded Top Distribution-: The slow curve down suggests that sellers are gaining strength while buyers are losing momentum.
Critical Zone at 55000-: Once a strong support, this level has now turned into resistance, confirming supply pressure.
200-Day Moving Average Test-: The index is currently testing its long-term trend indicator. A sustained breakdown below this line can accelerate bearish sentiment.
Volume Dynamics-: Notice how selling volumes are increasing on down days – a further sign of distribution.
Possible Scenarios-:
Bullish Case (Green Path): A short-term rebound from support zone back towards 55000 is possible, but will likely face strong resistance. Only a decisive close above 55500 can negate the bearish structure.
Bearish Case (Red Path): Failure to hold this support may trigger further downside, with potential targets around 52000 and even 51000 in the medium term.
Trading Viewpoint-:
This is a make-or-break zone for BankNifty. While short-term bounces are possible, the overall structure leans bearish unless bulls reclaim 55000+ with strength. Risk management is crucial here traders may consider positioning with caution and keeping stops tight.
This publication purely I am sharing for educational purpose and did not contain any trading advice.
Regards- Amit
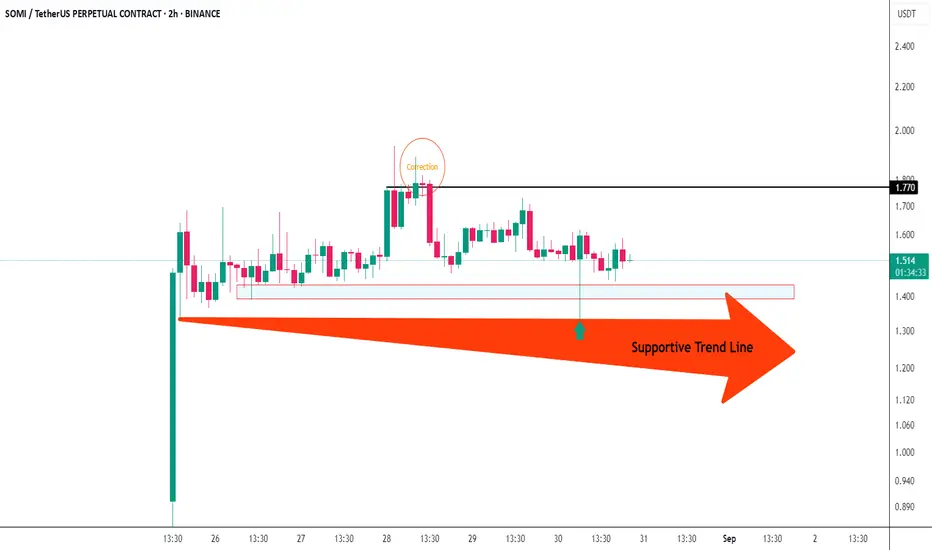
Newly Hot coin in Binance SOMI USDT is about to fall !!!!Based on the visual analysis, the asset is currently exhibiting a consolidation pattern within the defined price range of 1.9 to 1.3. This prolonged sideways movement suggests a potential breakdown scenario, aligning with the principles of zone range reversal correction. Should bearish momentum intensify, a downward move may materialize in the near term.
This observation is purely for analytical purposes and does not constitute financial advice.
Crypto Piner
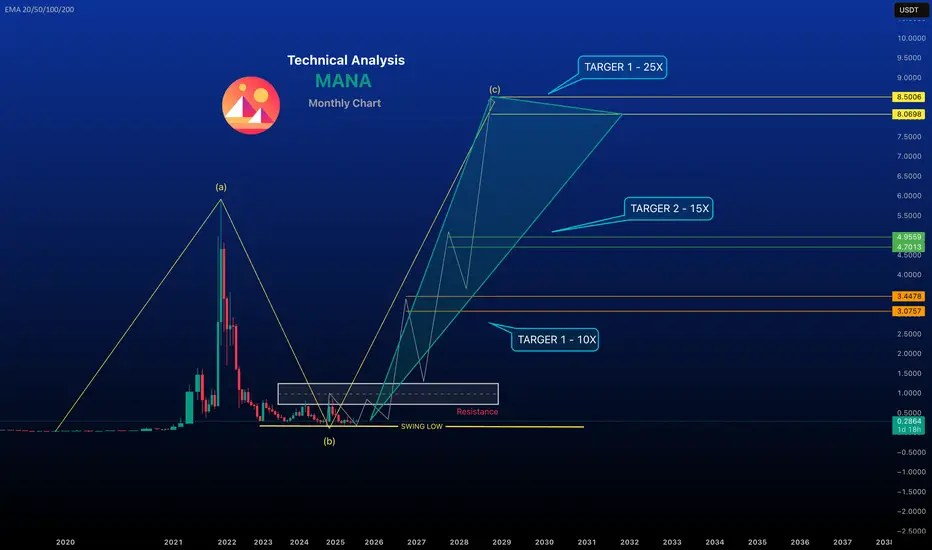
"Tracking the pulse of Decentraland: MANA/USDT price chart in reThe current price of Decentraland (MANA) to Tether (USDT) is approximately 0.2804 USDT, based on the latest data available, with a 24-hour trading volume of $36.04M. The price has risen by 0.66% in the past 24 hours but has fallen by -12.96% over the last week.
For real-time updates, you can check Chart
~~ Disclaimer ~~
This analysis is based on recent technical data and market sentiment from web sources. It is for informational \ educational purposes only and not financial advice. Trading involves high risks, and past performance does not guarantee future results. Always conduct your own research or consult a SEBI-registered advisor before trading.
# Boost and comment will be highly appreciated.
Nifty Intraday Analysis for 29th August 2025NSE:NIFTY
Index has resistance near 24675 – 24725 range and if index crosses and sustains above this level then may reach near 24900 – 24950 range.
Nifty has immediate support near 24350 – 24300 range and if this support is broken then index may tank near 24150 – 24100 range.
Volatility expected due to low carry forward OI in Weekly F&O Contracts with limited upside moment on weekly close.