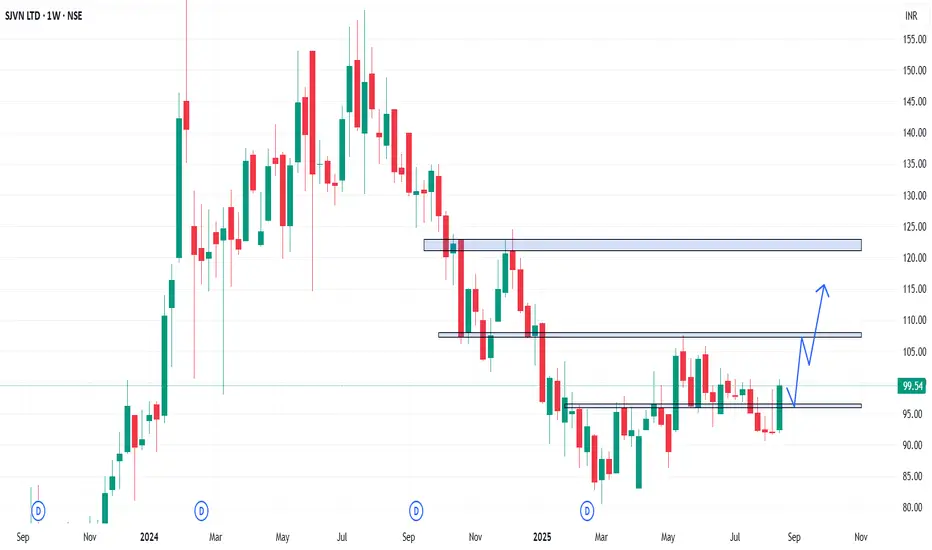
SJVN - Weekly AnalysisIn the Weekly Chart of SJVN ,
we can see that, it has given a strong comeback after the fall.
Let it retest and then enter with SL and targets.
Expected momentum is shown in chart.
Support and Resistance
EKC - Weekly AnalysisIn the Weekly Chart of EKC ,
we can see that, it has given a small Cup & Handle breakout.
let it retest properly and then enter with SL and targets.
Possible momentums are shown in chart.

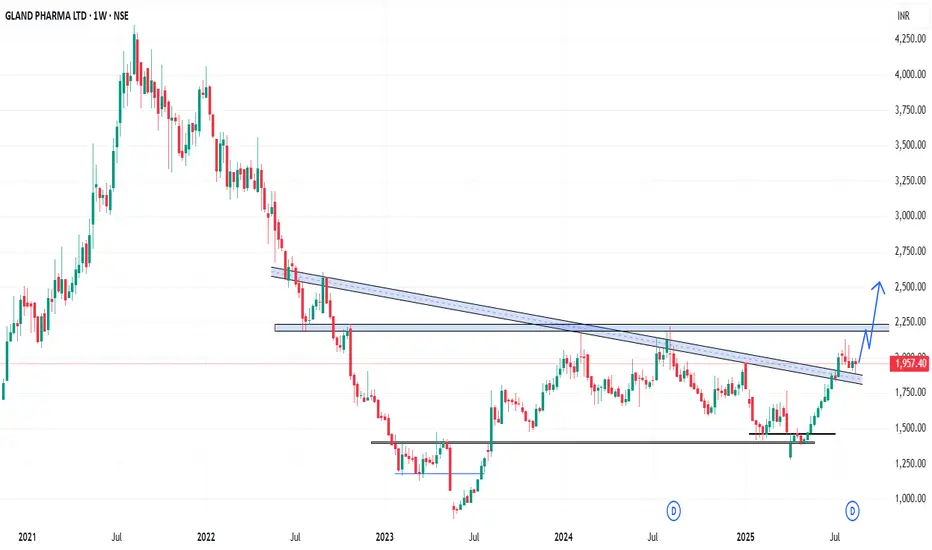
GLAND - Weekly AnalysisIn the Weekly Chart of GLAND ,
we can see that, it has created a Hammer candle on support..
Expected momentum is shown in chart.
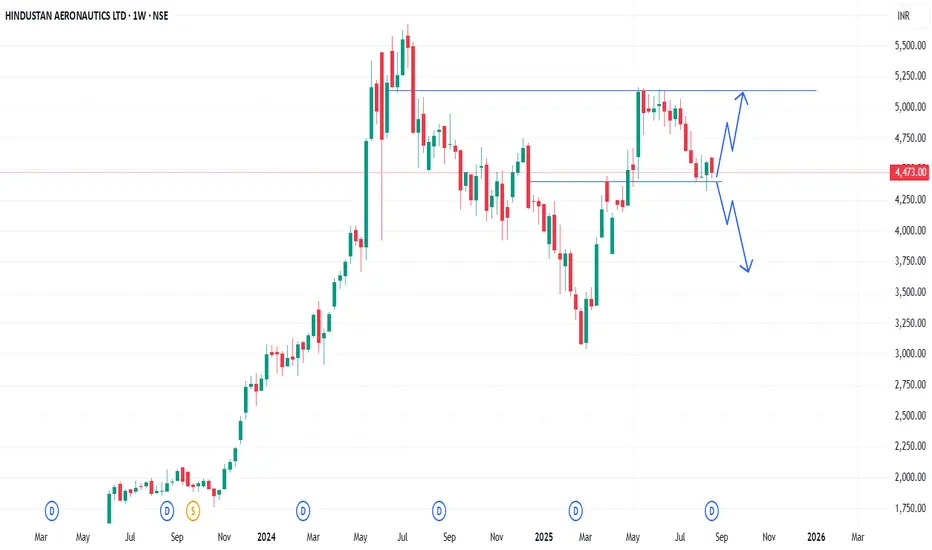
HAL - Weekly AnalysisIn the Weekly Chart of HAL ,
we can see that, it is at decision making point.
Possible momentums are shown in chart.
XPROINDIA - Weekly AnalysisIn the Weekly Chart of XPROINDIA ,
we can see that, it is at decision making point.
Possible momentums are shown in chart.

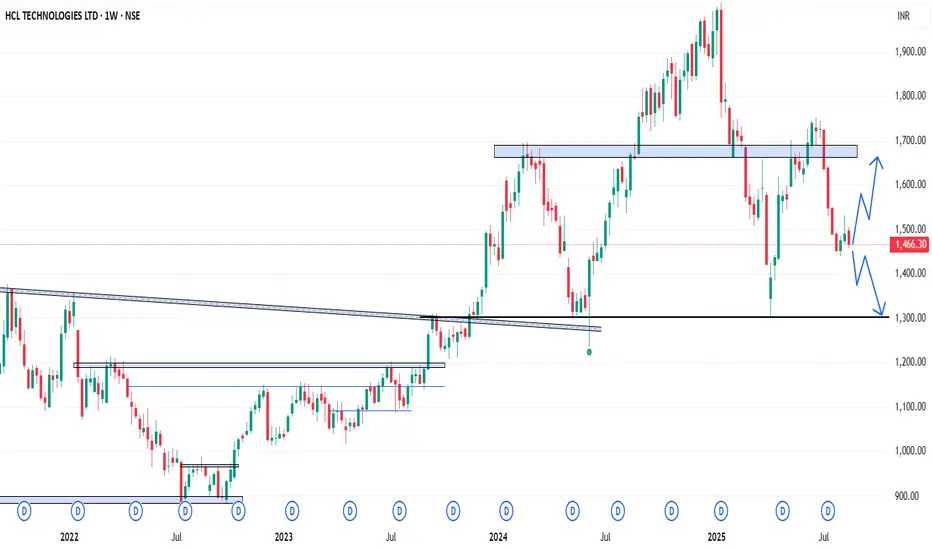
HCLTECH - Weekly AnalysisIn the Weekly Chart of HCLTECH ,
we can see that, it is at decision making point.
Possible momentums are shown in chart.
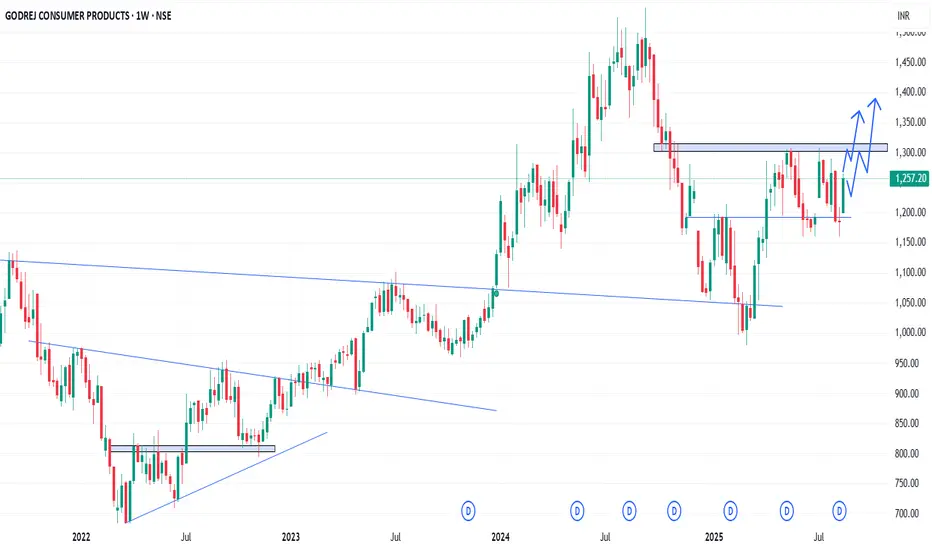
GODREJCP - Weekly AnalysisIn the Weekly Chart of GODREJCP ,
we can see that, it is about to give Cup & Handle breakout.
Expected momentums are shown in chart.
SBIN Blueprint
---
### **State Bank of India (SBI) – Overview**
* **Type:** Public Sector Bank (PSB)
* **Founded:** 1806 (as Bank of Calcutta), renamed SBI in 1955
* **Headquarters:** Mumbai, India
* **Presence:** 20,000+ branches and 60,000+ ATMs across India
---
### **Business Model**
SBI operates on a **classic banking business model**:
1. **Deposit & Lending**
* Collects money from customers via **savings accounts** and **fixed deposits**.
* Lends these funds as **loans** to individuals and businesses.
* Main profit comes from the **difference between loan interest and deposit interest**.
2. **Retail Banking**
* Services for individual customers:
* Current & Savings Accounts
* Home, Personal, and Car Loans
* Debit/Credit Cards, Net & Mobile Banking
3. **Corporate Banking**
* Services for businesses:
* Working Capital Loans
* Trade Finance (Import/Export)
* Cash Management Services
4. **Investment & Treasury**
* Sells Government Bonds, Mutual Funds, and Insurance products.
* Treasury operations (Forex trading, govt securities) generate additional income.
5. **Other Services**
* Insurance: Life & General (SBI Life, SBI General)
* Mutual Fund Distribution
* Demat & Wealth Management
---
### **Key Points**
* Main revenue sources: **interest income** and **fees & commissions**.
* Focuses on **financial inclusion**, reaching rural and semi-urban areas.
* Government of India owns approximately **57% stake**.
---

Supertrend retest in KPR MillsA very low risk setup in KPR Mills is seen.
A weekly retest of super trend serves as good entry point in trending stocks.
Tentative SL and targets are on chart.
Since SL is upto 10% buy on dips is recommended.

GBP/CHF – Potential Pullback to Supply ZoneGBP/CHF is currently trading around 1.0868 after bouncing from the demand zone near 1.0818.
Price is consolidating within a range, showing rejection from the lower support area.
Immediate upside target sits around 1.0858 (Target 1), with potential continuation towards the supply zone 1.0890 – 1.0900.
If the supply zone holds strong resistance, we could see another move back down to the demand zone 1.0818 – 1.0820.
Bias:
Bullish short-term towards 1.0858 – 1.0890.
Watching for rejection at supply for a potential reversal.
Key Levels:
Demand Zone: 1.0818 – 1.0820
Target 1: 1.0858
Supply Zone: 1.0890 – 1.0900

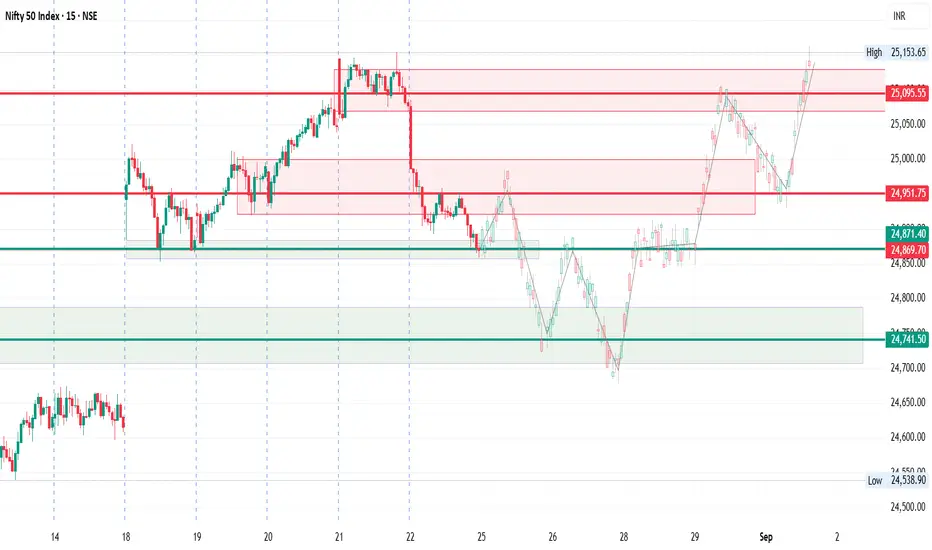
Nifty 15-Minute Analysis – Probable Supply/Demand Levels.Nifty closed today on a weak note when observed on the 15-minute timeframe, suggesting that the index still has room for further downside before any meaningful recovery.
Key Observations:
Weak Close – The index ended today without showing any strong buying interest near the close, signaling a continuation of bearish momentum.
Short-Term Resistance – The first hurdle for any recovery attempt sits near 24950, which aligns with intraday supply zones and minor moving average resistance.
Support Zone – The nearest visible support remains around 24700 – 24750, which has acted as a reaction level in the past.
Expected Price Action:
Immediate Move: A short pullback is likely towards 24950 as sellers allow a relief bounce.
Rejection Zone: If price struggles near 24950, fresh short positions may emerge.
Downside Continuation: From this rejection, Nifty may head lower towards 24700, with 24750 acting as an intermediate support.
Possible Swing Reversal: After testing 24700, there is a probability of a reversal attempt back towards 24870 (today’s closing level) before another leg of selling pressure resumes.
Levels to Watch:
Resistance: 24950 → 25020 (short-term supply zone)
Closing Pivot: 24870
Support: 24750 → 24700 (critical short-term floor)
Trading Plan (Not Financial Advice):
For Intraday Traders:
Look for short opportunities near 24950 if rejection candles form.
Target zones: 24800 → 24750 → 24700.
For Swing Traders:
Watch price behavior around 24700. A sharp bounce from here may give a short-covering rally back to 24870+.
Sustained break below 24700 could open further downside.
Risk Note:
This analysis is based purely on chart structure and momentum on the 15-minute timeframe. Broader market cues (global sentiment, sector performance, macro events) can override intraday patterns. Always use stop-loss and adjust position sizing according to risk appetite.
Nifty Intraday Analysis for 22nd August 2025NSE:NIFTY
Index has resistance near 25250 – 25300 range and if index crosses and sustains above this level then may reach near 25450 – 25500 range.
Nifty has immediate support near 24900 – 24850 range and if this support is broken then index may tank near 24700 – 24650 range.

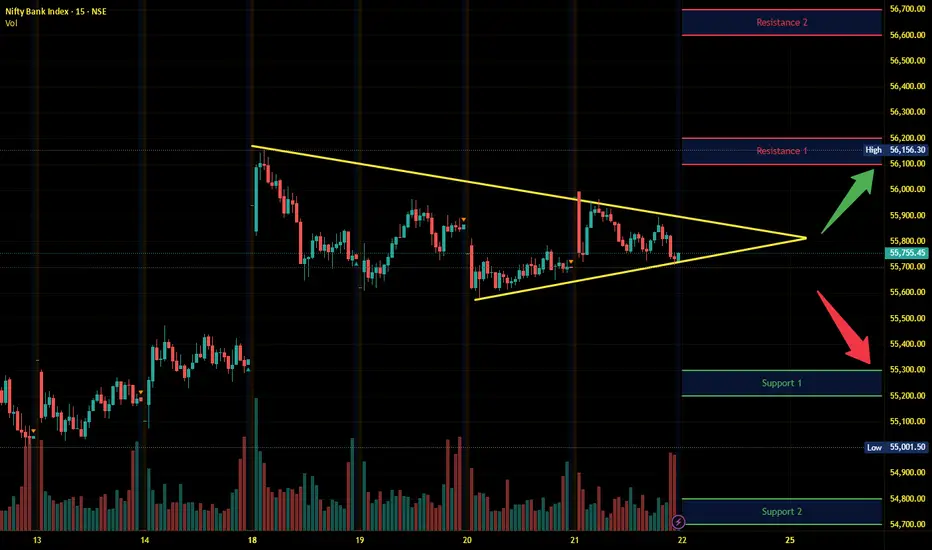
Banknifty Intraday Analysis for 22nd August 2025NSE:BANKNIFTY
Index has resistance near 56100 – 56200 range and if index crosses and sustains above this level then may reach near 56600– 56700 range.
Banknifty has immediate support near 55300 - 55200 range and if this support is broken then index may tank near 54800 - 54700 range.
Finnifty Intraday Analysis for 22nd August 2025NSE:CNXFINANCE
Index has resistance near 26800 - 26850 range and if index crosses and sustains above this level then may reach near 27050 - 27100 range.
Finnifty has immediate support near 26400 – 26350 range and if this support is broken then index may tank near 26200 – 26150 range.

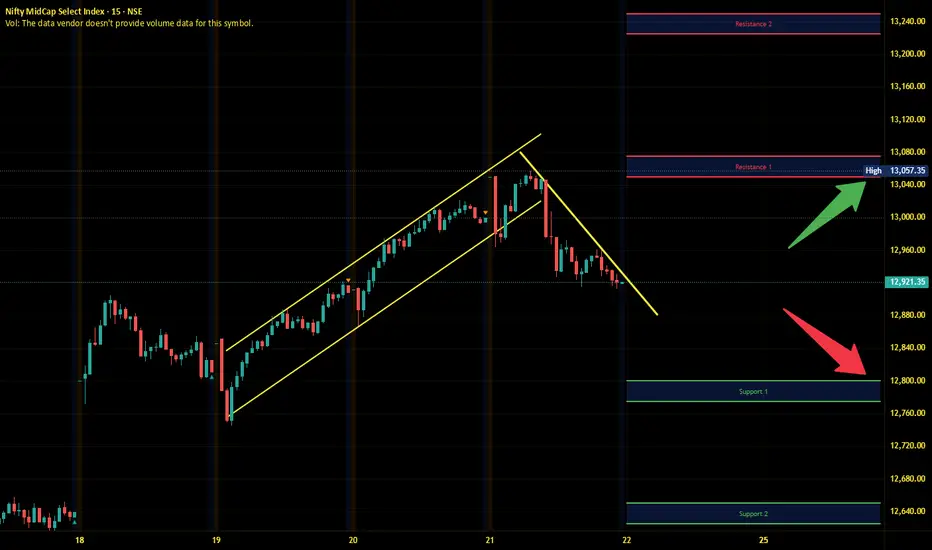
Midnifty Intraday Analysis for 22nd August 2025NSE:NIFTY_MID_SELECT
Index has immediate resistance near 13050 – 13075 range and if index crosses and sustains above this level then may reach 13225 – 13250 range.
Midnifty has immediate support near 12800 – 12775 range and if this support is broken then index may tank near 12650 – 12625 range.
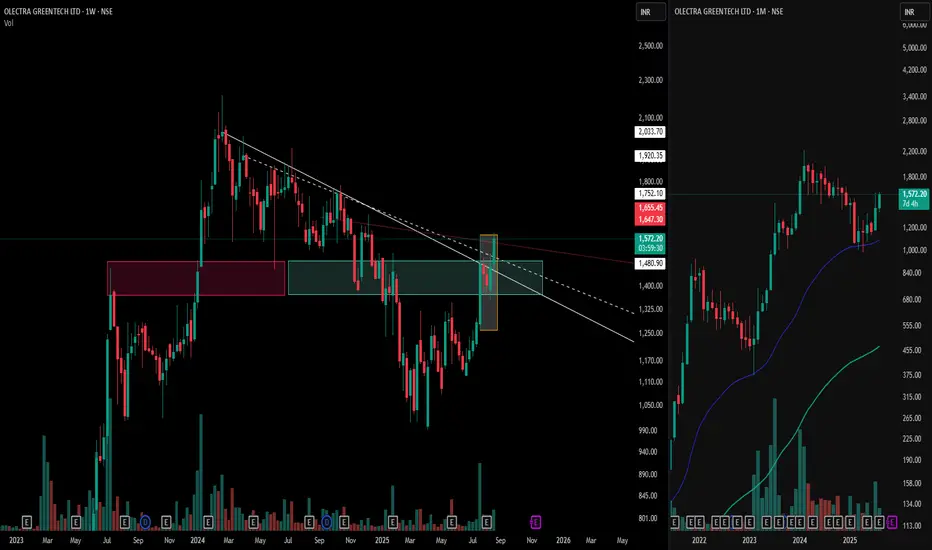
Olectra Greentech: Power of the Mother Candle & Zone Flip📊 White trendlines mark the crucial control trend and resistance levels.
🕯️ The bold Mother Candle (highlighted in the orange box) is marked .
💗 Notice the Pink Zone — formerly a tough resistance area — now flipped into strong support after the breakout, a classic supply-to-demand flip!
💎 The Cyan Box highlights an emerging demand zone, where buying interest gathers
⚡ Right side is a Representation of Market structure on the Biggest Time frame ( Monthly time frame ) showcasing a Higher high and Higher low formation and respecting the EMA plotted .
This is a stellar example of price structure and supply-demand dynamics in action—perfect study material for keen market observers.
⚠️ Disclaimer: This post is for educational and research purposes only. It does not constitute financial advice or a forecast. Always do your own analysis before making trading decisions.
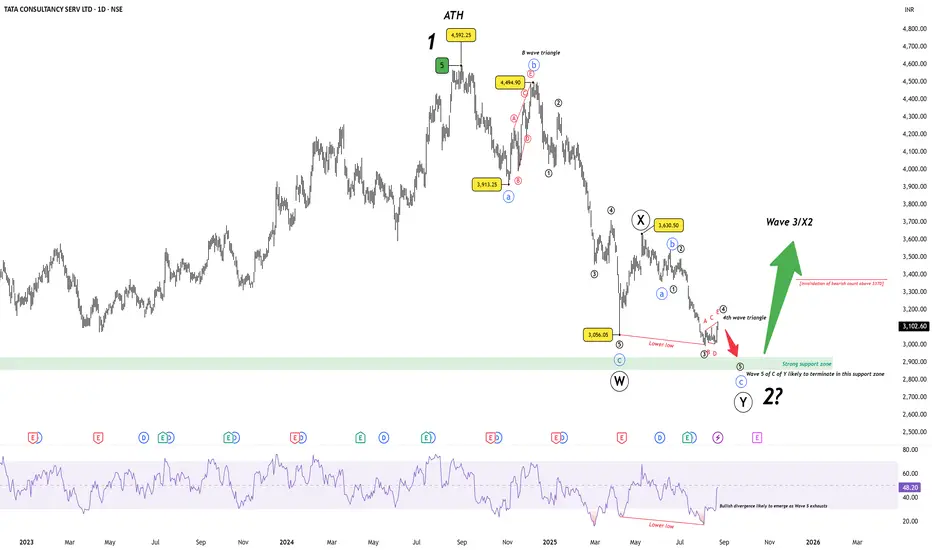
TCS – Wave 2 Correction Nearing Completion?TCS has been in a prolonged corrective phase since the all-time high at ₹4592. The decline has unfolded best as a W–X–Y double zigzag, with the current leg (Wave Y) progressing into its final stages.
Wave W ended at ₹3056 after a sharp A–B–C decline.
Wave X retraced to ₹3630.
Wave Y is in progress, and its C leg appears close to exhaustion. A mini 4th-wave triangle has developed, suggesting a final push lower remains.
The termination zone for Wave 2 is highlighted between ₹2926–₹2850, aligning with the prior Wave 4 support zone. Importantly, bullish divergence is likely to emerge on RSI if price makes a marginal new low.
Key Levels:
Support zone : 2926–2850 (probable Wave 2 low).
Bearish invalidation : A sustained move above 3370 would invalidate the immediate bearish count.
Bigger picture : If this structure holds, it would complete Wave 2 of a higher degree, setting the stage for a powerful Wave 3 rally ahead.
Disclaimer: This analysis is for educational purposes only and does not constitute investment advice. Please do your own research (DYOR) before making any trading decisions.
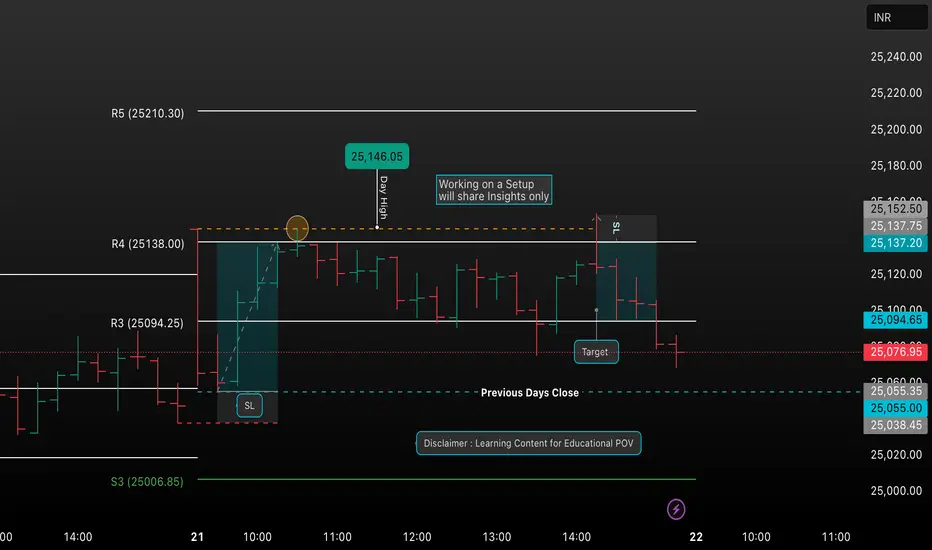
Learn & Trade: Nifty StrategiesDaily Nifty chart setups, insights, and detailed trade ideas. Follow for real-time analysis and educational tips—ideal for new and experienced traders looking to learn disciplined market strategies.”
2. “Sharing structured Nifty setups, key trading zones, and transparent trade planning. Join in for actionable analysis, risk management techniques, and a supportive learning environment for all traders.”
3. “A platform dedicated to simplifying technical analysis and real-world trading. Expect clear charts, honest reviews of trades, and an open community to discuss and improve each other’s strategies.”
You can use or adapt any of these as your TradingView chart post description or as a community introduction. This combination emphasizes your focus on actionable setups, ongoing learning, and engaging with fellow traders.
Indian Hotel Cmp 796 Dark Cloud Cover Candle @ top Indian Hotel Cmp 796 dated 21-8-2025
1. Dark Cloud Cover Candle @ top
2. RSI reversal
Sell below 790 SL 812 target 785-780-775-770-765
760-755-750
It is just a view, please trade at your own risk.

XAUUSD GOLD ANALYSIS ON(21/08/20025)#XAUUSD UPDATEDE
Current price - 3328
If price stay above 3310 then next target 3355,3375 and below that 3310
Plan;If price break 3328-3323 area,and stay above 3330,we will place buy order in gold with target of 3355,3375 & stop loss should be placed at 3310

Jindal Stainless Cmp 774 Shooting Star Candle @ TopJindal Stainless Cmp 774 dated 21-8-2025
1. Shooting Star Candle at Top in uptrend
Sell below 768 SL 798 target 765-760-755-750-740-730-720
It is just a view, please trade at your own risk.

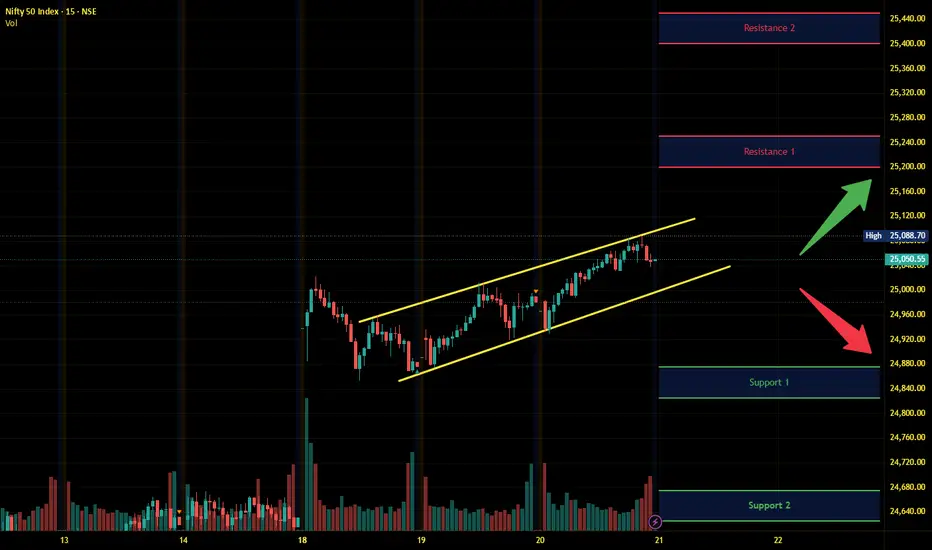
Nifty Intraday Analysis for 21st August 2025NSE:NIFTY
Index has resistance near 25200 – 25250 range and if index crosses and sustains above this level then may reach near 25400 – 25450 range.
Nifty has immediate support near 24875 – 24825 range and if this support is broken then index may tank near 24675 – 24625 range.
Banknifty Intraday Analysis for 21st August 2025NSE:BANKNIFTY
Index has resistance near 56100 – 56200 range and if index crosses and sustains above this level then may reach near 56600– 56700 range.
Banknifty has immediate support near 55300 - 55200 range and if this support is broken then index may tank near 54800 - 54700 range.
