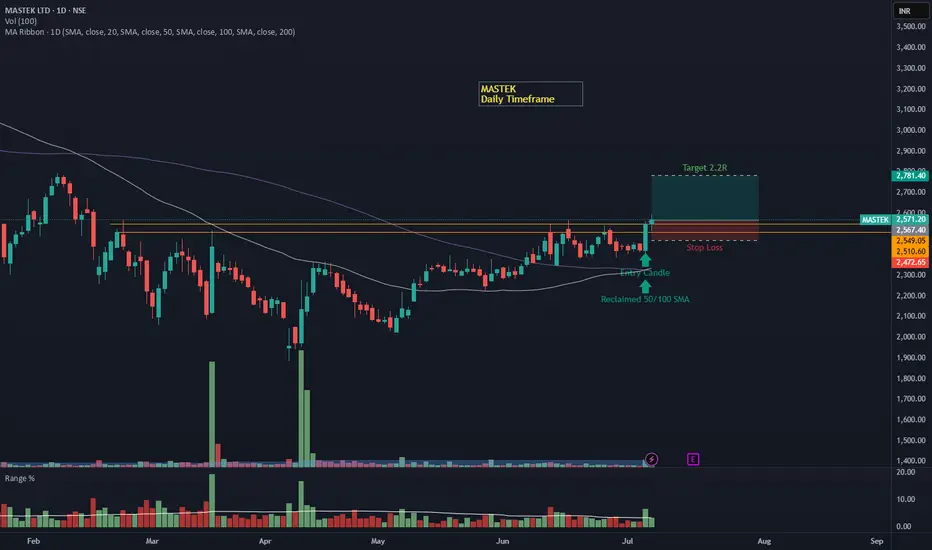
MASTEK – Daily Timeframe Breakout Idea (Resistance Zone Break)MASTEK has broken above a key resistance zone on the daily timeframe, backed by a strong bullish candle and a significant volume surge.
📌 Breakout Context:
The stock consolidated near the ₹2460–2480 zone for several sessions, forming a horizontal resistance zone.
On July 4th, the price broke out with strong bullish momentum, closing above the resistance with a wide-range green candle and a volume spike.
The breakout candle also closed above both 50- and 100-day Simple Moving Averages, confirming a bullish bias.
💡 Trade Setup:
Entry: ₹2550–2570 (near breakout)
Stop Loss: Below the breakout zone at ₹2472
Target: ₹2780+ (2.2R setup)
Risk-Reward: ~1:2.2 (ideal for swing trades)
🎯 Why This Setup Stands Out:
Volume on the breakout day is notably higher than average, confirming institutional interest.
Clean horizontal breakout from a multi-week range.
SMA structure is bullish, with the price reclaiming key MAs.
⚠️ Disclaimer: This post is for educational purposes only and not financial advice. Always consult your financial advisor before making trading decisions.
Supportandresistancezones
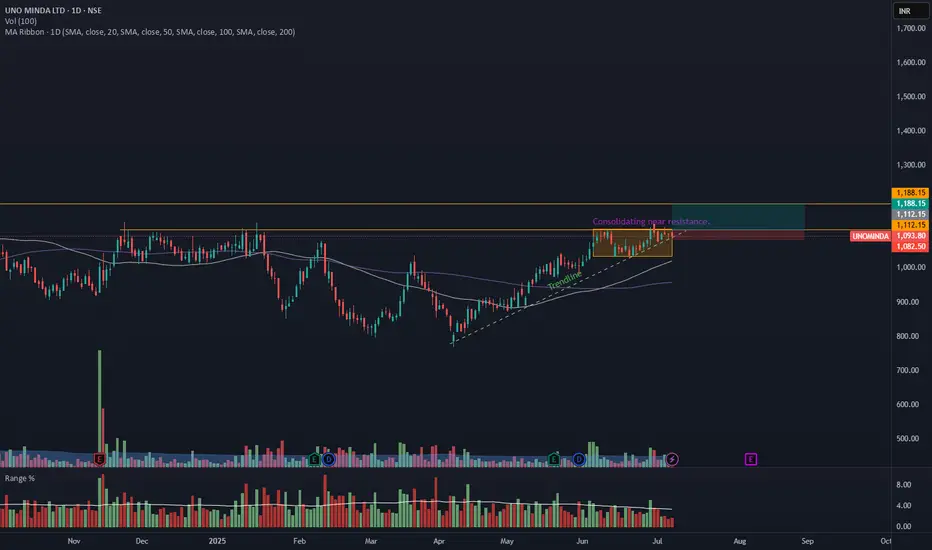
UNOMINDA – Daily Timeframe Breakout Idea (Resistance Zone Break)UNO MINDA LTD. has shown a breakout above a key horizontal resistance level on the daily chart, accompanied by a nearly 1.5 times volume surge near the breakout, as seen earlier, supported by strong momentum.
🔍 Breakout Context:
- Price might break above the ~₹1110 horizontal resistance, which had held for over 6 months.
- Breakout supported by more than average volume and just above average range near the resistance zone.
- The price is also trading above both the 50- and 100-day SMAs, indicating strong trend continuation.
- This aligns with a bullish continuation setup.
📉 Trade Plan:
- CMP: ₹1093
- Entry: Near ₹1112
- Target: ₹1188 (~7% upside from CMP)
- Stop-Loss: ₹1082
- Risk-Reward Ratio: ~1 : 2.0
📌 Note:
- Look for a confirmation candle to enter the trade.
- Avoid chasing the extended move unless confident in intraday momentum.
⚠️ Disclaimer: This post is for educational purposes only and not financial advice. Always do your research or consult a financial advisor before trading.
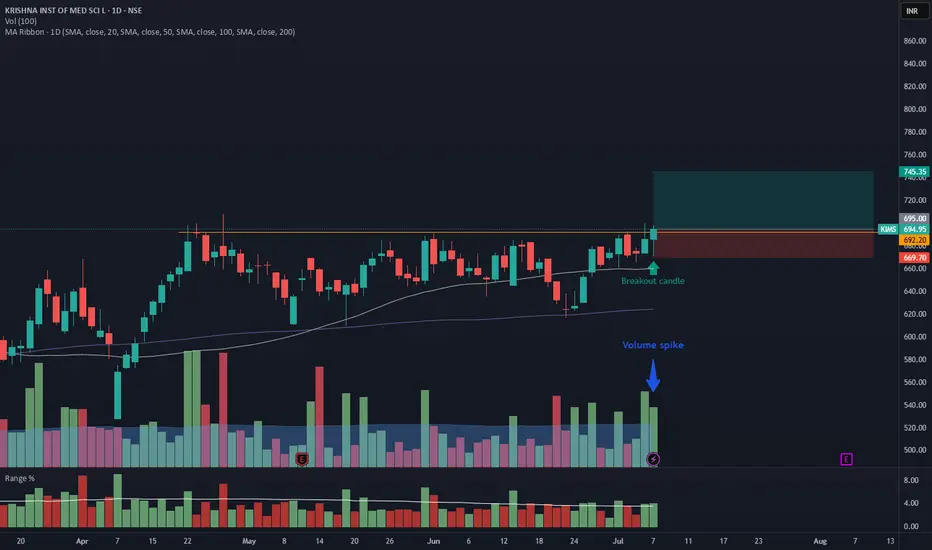
KIMS – Daily Timeframe Breakout Idea (Resistance Zone Break)
KRISHNA INSTITUTE OF MEDICAL SCIENCE has shown a breakout above a key horizontal resistance on the daily chart, accompanied by a ~2x volume surge, supported by strong momentum.
🔍 Breakout Context:
- Price broke above the ~692.20 horizontal resistance, which had held for over 2 months.
- Breakout supported by <2x average volume and just above average range on the breakout candle.
- The price is also trading above both the 50- and 100-day SMAs, indicating strong trend continuation.
- This aligns with a bullish continuation setup.
📉 Trade Plan:
- CMP: ₹694
- Entry: Near ₹695
- Target: ₹746 (~7.25% upside from CMP)
- Stop-Loss: ₹669
- Risk-Reward Ratio: ~1 : 2.0
📌 Note:
- Avoid chasing the extended move unless confident in intraday momentum.
⚠️ Disclaimer: This post is for educational purposes only and not financial advice. Always do your research or consult a financial advisor before trading.
GBP/USD Technical Insight – Reversal Opportunity from Demand GBP/USD Technical Insight – Reversal Opportunity from Demand Zone
The GBP/USD chart showcases a classic liquidity sweep and bullish reaction from a clearly defined support zone (1.3360 – 1.3400). After an extended bearish move, price entered the demand area, rejected strongly, and formed a potential bullish reversal setup, signaling a possible move toward the resistance zone near 1.3740 – 1.3800.
The use of Supertrend Indicator confirms a shift in market structure, supporting the bullish bias. This setup reflects a textbook example of smart money behavior — where price mitigates imbalance, grabs liquidity, and rallies from institutional zones.
⸻
🧠 Educational Key Points:
• Support & Resistance Zones are well-respected.
• Trend Shift confirmed after long accumulation.
• Liquidity Engineering: Market makers swept the lows before reversing.
• Confluence of Structure + Indicator adds high-probability confidence.
📌 Potential Trade Idea:
Buy from the support zone with targets near resistance; manage risk below the support zone for precision.

Gold Trading Strategy XAUUSD July 18, 2025
Yesterday's trading session, after a strong correction to the 3310 area, the gold price increased sharply again.
Basic news: FED Governor Christopher Waller supports a 25 basis point interest rate cut later this month. The number of weekly unemployment claims in the US fell to 221,000, lower than the forecast of 233,000 and the previous period's level of 228,000; data shows that the US labor market remains stable, strengthening the economic growth outlook.
Technical analysis: The M30 and H1 time frames have not clearly shown the trend of the gold price, when the tug-of-war between buying and selling is quite large. However, in the H4 and D1 frames, there are signs that the gold price will increase again. If the gold price continues to trade in the 3290 - 3300 area, it shows a new multi-frame compression process. This area is very important as it can be a trading point that brings us great profits.
Important price zones today: 3318 - 3323, 3287 - 3292 and 3352 - 3357.
Today's trading trend: BUY (hold).
Recommended orders:
Plan 1: BUY XAUUSD zone 3318 - 3320
SL 3315
TP 3323 - 3233 - 3343 - 3353.
Plan 2: BUY XAUUSD zone 3288 - 3290
SL 3285
TP 3293 - 3303 - 3320 - 3340 - Open.
Plan 3: SELL XAUUSD zone 3353 - 3355
SL 3358
TP 3350 - 3340 - 3330 - 3310.
Wish you a lucky, safe and profitable weekend trading day.🌟🌟🌟🌟🌟

BREAK OUT GOLD On H1 frame, gold has signs of breakout, so pay attention to the support area 3342
XAUUSD BUY Zone: 3341 - 3343
Stoploss: 3337 (60pips)
Takeprofit: 3346 - 3350 - 3354

Gold XAUUSD Trading Strategy on July 17, 2025:
Yesterday's trading session was as we expected when the gold price adjusted from the 334x area, however, the gold price did not approach 3300 as we expected for a long-term trading point.
Basic news: News that President Trump considered firing FED Chairman Jerome Powell caused the USD to plummet, gold prices to skyrocket and stocks to fall. The US PPI and core PPI last month both recorded a 0% increase, lower than the forecast of 0.2% and the previous period's level of 0.1%. Data showed that inflationary pressure from the manufacturing side continued to cool down.
Technical analysis: After adjusting from the 334x area and approaching the nearest bottom of 3320, the gold price immediately increased sharply. RSI on the H1, H4 and D1 time frames crossed the average line, showing a renewed uptrend. Currently, the higher bottom pattern is compressing at the 3320 - 3357 border. If the price breaks this compression zone, it will fluctuate very strongly.
Important price zones today: 3325 - 3330, 3352 - 3357 and 3300 - 3305.
Today's trading trend: BUY.
Recommended orders:
Plan 1: BUY XAUUSD zone 3325 - 3327
SL 3322
TP 3330 - 3340 - 3360 - 3380.
Plan 2: BUY XAUUSD zone 3300 - 3302
SL 3297
TP 3305 - 3315 - 3335 - 3360.
Plan 3: SELL XAUUSD zone 3355 - 3357
SL 3360
TP 3352 - 3342 - 3332 - 3322.
Wish you a safe, successful and profitable trading day.🌟🌟🌟🌟🌟

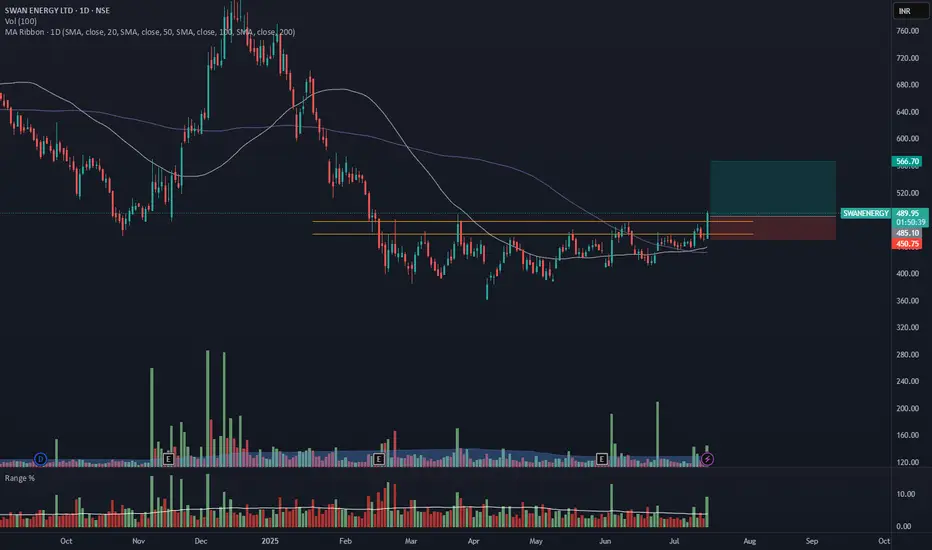
SWANENERGY - Daily Timeframe Breakout (Resistance Zone Break)SWAN ENERGY has shown a breakout above a key horizontal resistance level on the daily chart, accompanied by a nearly 2.5 times volume surge near the breakout zone, as seen earlier, supported by strong momentum.
🔍 Breakout Context:
- Price might break above the ~₹484 horizontal resistance, which had held for over 6 months.
The breakout zone has been supported by 2.5X volume and a range 3X of average near the resistance zone.
- The price is also trading above both the 50- and 100-day SMAs, indicating strong trend continuation.
- This aligns with a bullish continuation setup.
📉 Trade Plan:
- CMP: ₹485.2
- Entry: Near ₹484
- Target: ₹566 (~16.5% upside from CMP)
- Stop-Loss: ₹450
- Risk-Reward Ratio: ~ 1 : 2.3
📌 Note:
- Wait for the closing of this candle, enter the trade near 3:20 PM, or get confirmation on 75min/1Hr TF.
- Avoid chasing the extended move unless confident in intraday momentum.
⚠️ Disclaimer: This post is for educational purposes only and not financial advice. Always do your research or consult a financial advisor before trading.
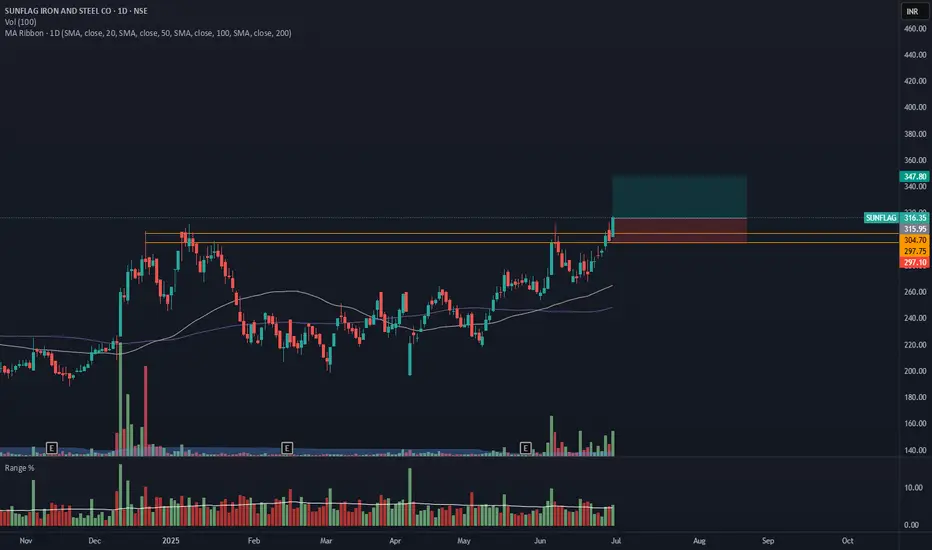
SUNFLAG- Breakout from DTFSUNFLAG has resistance weakening on the Daily charts and has given a breakout with good volume.
The target of this pattern signals an upside potential of 10% from the current price level in the medium term.
The stock is trading above its 50- and 100-day simple moving averages (SMAs). The range is more than 1.2X, and the Volume is also >6X the average.
CMP- Rs. 316
Target Price- Rs347 ( 10% upside)
SL - 297
Disclaimer: This is not a buy/sell recommendation. For educational purpose only. Kindly consult your financial advisor before entering a trade.
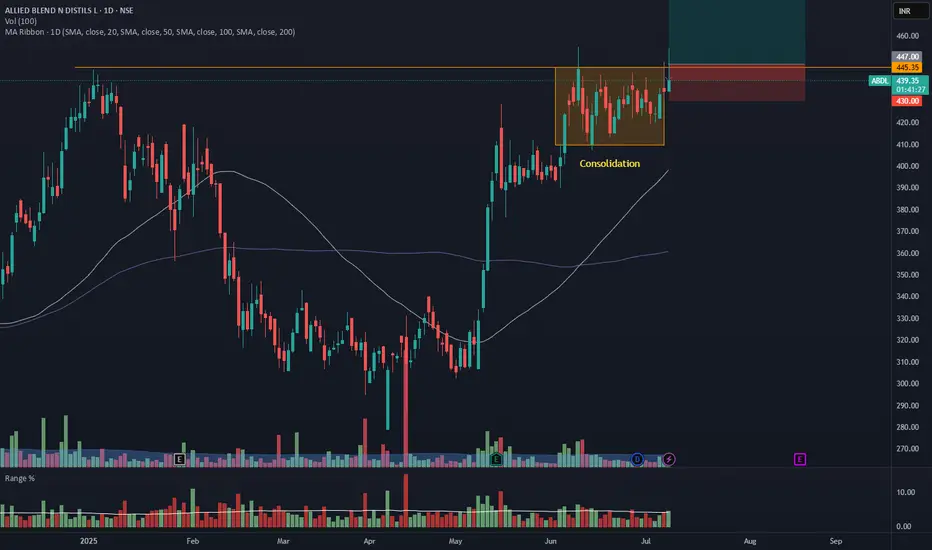
ABDL - Daily Timeframe Breakout Idea (Resistance Zone Break)Allied Blenders and Distillers Ltd. has shown a breakout above a key horizontal resistance level on the daily chart, accompanied by a nearly 2 times volume surge near the breakout zone, as seen earlier, supported by strong momentum.
🔍 Breakout Context:
- Price might break above the ~₹446 horizontal resistance, which had held for over 6 months.
The breakout zone has been supported by 2X volume and a range 1.5X of average near the resistance zone.
- The price is also trading above both the 50- and 100-day SMAs, indicating strong trend continuation.
- This aligns with a bullish continuation setup.
📉 Trade Plan:
- CMP: ₹439.15
- Entry: Near ₹446
- Target: ₹481 (~7.5% upside from CMP)
- Stop-Loss: ₹430
- Risk-Reward Ratio: ~ 1 : 2
📌 Note:
- Look for a confirmation candle to enter the trade.
- Avoid chasing the extended move unless confident in intraday momentum.
⚠️ Disclaimer: This post is for educational purposes only and not financial advice. Always do your research or consult a financial advisor before trading.
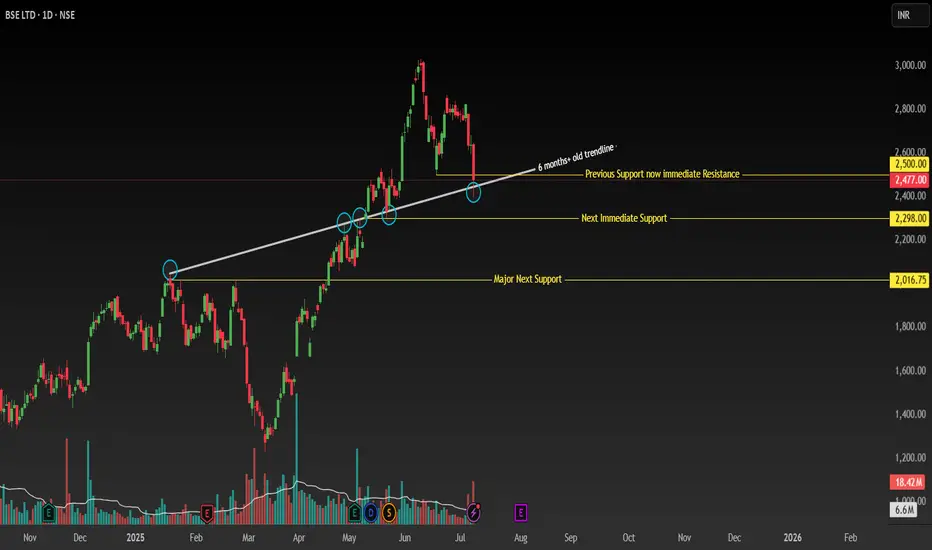
BSE - Support Break with Bullish Recovery SetupSymbol: BSE (Bombay Stock Exchange)
Timeframe: Daily
Key Levels:
✅ Breakdown: 2500 (closed below) → Next support: 2300 → 2000 (major).
✅ Bullish Anchor: Price > 200 MA + ascending trendline (Jan 20, 2025 breakout now support).
📊 Technical Structure
Critical Support Break:
-Daily close below 2500 (confirmed breakdown of key support).
-Next supports: 2300 (immediate) → 2000 (major swing low).
Bullish Anchors:
-Price above 200-day MA (long-term uptrend intact).
Ascending Trendline Support:
-Originating from Jan 20, 2025 (resistance until May 13 breakout).
-Now acting as dynamic support (resistance-turned-support).
Key Reversal Signal: Watch for reclaim of 2500
-Requires strong bullish candle + above-average volume.
-Confirms failed breakdown and resumption of uptrend.
🎯 Trading Plan
Scenario 1: Buy Dips (Conservative)
Entry Zone:
-Layer 1: 2300 (trendline + horizontal support confluence).
-Layer 2: 2000 (swing low + 200 MA reinforcement).
-Stop Loss: 1950 (below 2000 structure).
-Targets: 2500 → 2700 → 2900.
Scenario 2: Breakout Re-entry (Aggressive)
Trigger: Daily close above 2500 with: Bullish candle (preferably >1.5% gain).
-Volume ≥ 20% above 10-day average.
-Stop Loss: 2450 (below breakout level).
-Targets: 2700 → 2900 (measured move).
⚠️ Risk Management
Position Size: ≤3% capital per trade.
Invalidation Conditions:
-Close below 2000 (invalidates bullish thesis).
-Failed 2500 reclaim (weak volume/rejection candle).
Disclaimer: Not financial advice. Conduct your own due diligence. Past performance ≠ future results. Risk capital only.
🔥 Boost if this analysis helps your strategy!
💡 Comment below any stocks you want me to analyse next!
NYKAA - Breakout from DTFNYKAA has resistance weakening on the Daily charts and has given a breakout with good volume.
The target of this pattern signals an upside potential of 10% from the current price level in the medium term.
The stock is trading above its 50- and 100-day simple moving averages (SMAs). The range is more than >1.2X, and the Volume is also >2X the average.
CMP- Rs. 108
Target Price- Rs228 ( 10% upside)
SL -202
Disclaimer: This is not a buy/sell recommendation. For educational purpose only. Kindly consult your financial advisor before entering a trade.

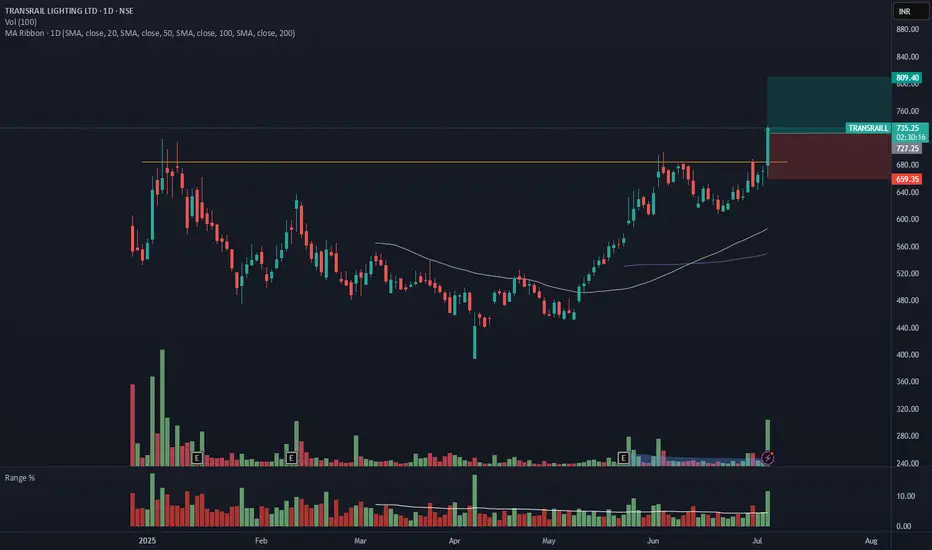
TRANSRAILL - Breakout from Daily TFTRANSRAILL has resistance weakening on the Daily charts and has given a breakout with good volume.
The target of this pattern signals an upside potential of ~10% from the current price level in the medium term.
The stock is trading above its 50- and 100-day simple moving averages (SMAs). The range is more than >2X, and the Volume is also >6X the average.
CMP- Rs. 727
Target Price- Rs.805( ~10% upside)
SL -859
Note- The breakout candle has gone up, extended, so be mindful of your position.
Disclaimer: This is not a buy/sell recommendation. For educational purpose only. Kindly consult your financial advisor before entering a trade.
MAZDOCK - – INTRADAY ZONE ANALYSIS________________________________________________________________________________📈 MAZAGON DOCK SHIPBUILDERS LTD. – INTRADAY ZONE ANALYSIS
📆 Date: July 1, 2025 | ⏱ Timeframe: 15-Minute Chart
🔍 Educational Breakdown – For Learning & Study Use Only
________________________________________________________________________________
🔹 Price Action Zones
🔴 Top Range (Resistance): ₹3341
🟢 Bottom Range (Support): ₹3094
⚪ No Trade Zone: (Trade only with trend + confirmation in this zone)
________________________________________________________________________________
🧩 Chart Pattern: No visible chart pattern seen.
________________________________________________________________________________
🔁 Reversal Candlestick Patterns:
🔴 Top Range:
✅ Multiple strong rejection candles near ₹3341 along with long upper wicks and volume drop — suggesting supply zone holding.
🟢 Bottom Range:
✅ Bullish Marubozu and wide-range green candles seen around ₹3094, confirming strong buyer interest and a potential reversal zone.
________________________________________________________________________________
🧠 1. Trade Plan (Based on Reason and Logic)
🔼 Bullish Trade:
Idea: Go long if price retests ₹3120–₹3094 demand zone with bullish confirmation (strong bullish candle, reversal candles, volume support, long wick)
Stop Loss: Below ₹3090
Risk-Reward: 1:1 | 1:2+
Logic: Strong buyer reaction from demand zone previously suggests continued interest if tested again.
________________________________________________________________________________
🔽 Bearish Trade:
Idea: Short if price retests ₹3341–₹3310 and rejects with bearish candle formation (strong bearish candle, reversal candles, volume support, long wick).
Stop Loss: Above ₹3347.55
Risk-Reward: 1:1 | 1:2+
Logic: Supply zone confirmed with rejections earlier. Reversal here can lead to downside till mid or demand zone.
________________________________________________________________________________
📦 2. Trade Plan Based on Demand/Supply Zones
🟥 Supply Zone: ₹3341 – ₹3310
SL: ₹3347.55
Plan: Enter short if price shows rejection with bearish confirmation at this zone.
Risk-Reward: 1:1 | 1:2+
🟩 Demand Zone: ₹3120 – ₹3094
SL: ₹3090
Plan: Enter long on bullish reversal setup from this demand area.
Risk-Reward: 1:1 | 1:2+
________________________________________________________________________________
📌 Disclaimer
This analysis is for educational and study purposes only. It does not constitute investment advice. The author is not SEBI-registered. Please consult a SEBI-registered advisor before trading. Always use strict risk management and act only on confirmation.
________________________________________________________________________________
💬 Comments
What’s your view on MAZDOCK?
Will it break the supply zone and rally higher, or revisit the demand zone before bouncing back?
Share your thoughts and chart setups below 👇
________________________________________________________________________________

CHOLAFIN- Breakout from DTFCHOLAFIN has resistance weakening on the Daily charts and has given a breakout with good volume.
The target of this pattern signals an upside potential of ~10% from the current price level in the medium term.
The stock is trading above its 50- and 100-day simple moving averages (SMAs). The range is more than >1X, and the Volume is also >1X the average.
CMP- Rs. 1628
Est. Entry price ~ 1670
Target Price- Rs1813 ( ~10% upside)
SL -1610
Note- The candle closed isn't very promising, so we have to wait for a stronger move. The promising move should be able to close above 1670.
Disclaimer: This is not a buy/sell recommendation. For educational purpose only. Kindly consult your financial advisor before entering a trade.

EUR/JPY 15Mins TF Short Idea at Resistance ZoneEUR/JPY Hit Resistance at Zone 169.33 to 169.19 Level currently Looking Bounce to Next Support Zone at 168.70 to 168.55 Which I am Targeting and SL at 169.48

Biggest Crypto Expiry of the Quarter Is Almost Here🚨 June 27 = Big Expiry Day for BTC, ETH & Markets. Here’s What to Watch 🚀
This Friday — June 27 — marks the quarterly options expiry , and it’s shaping up to be a big one 💥
Especially for Bitcoin and Ethereum , where open interest is currently at its highest compared to all other series. One glance at the chart tells you everything — this expiry matters .
And right now, the Max Pain level for BTC sits at $101K …
Guess what? Price has already arrived.
📈 Over the past week, the heaviest trading volume was seen around:
$100K Puts
$95K Puts
So yeah — we’ve got all the signs pointing to price hanging around this zone before expiry.
It wouldn’t be surprising to see BTC drifting sideways near $100K–$101K , playing cat-and-mouse with the Max Pain level.
🧠 Why This Matters:
Large players may try to pin price near Max Pain 📌
Volatility could stay low until the final stretch ⏳
👉 Your Move:
Mark your calendar. Watch the flow.
We’ll be tracking every move as we approach expiry — follow along for updates.

Trent Price Action Decoded – Simplicity Wins!No calls, no forecasting — just pure price action. In this post, I’m simply sharing how I see Trent’s chart. Clean structure, organic movement, and a simple approach to reading the price. For those who enjoy observing the market without noise or bias.

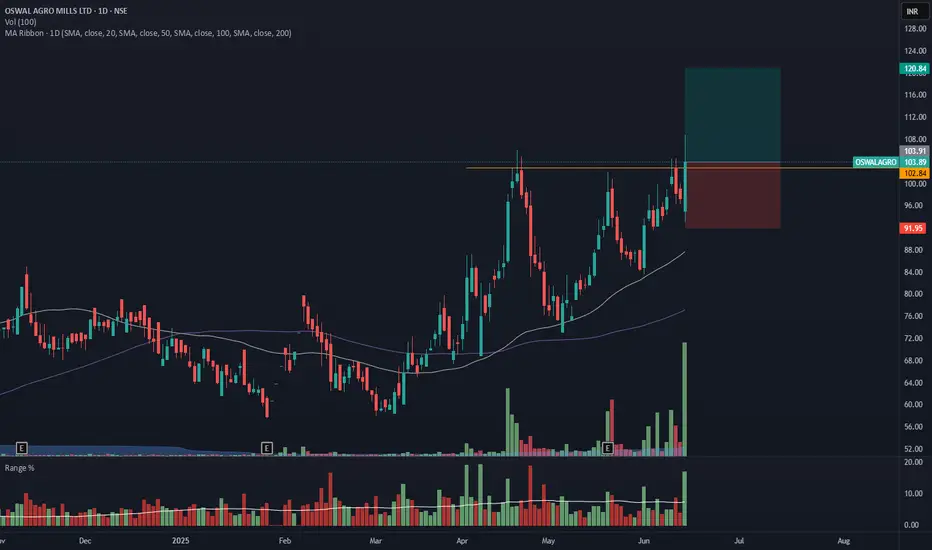
OSWALAGRO - Breakout from DTFOSWALAGRO has resistance weakening on the Daily charts and has given a breakout with good volume.
The target of this pattern signals an upside potential of 15% from the current price level in the medium term.
The stock is trading above its 50- and 100-day exponential moving averages (EMAs). The range is more than >2X, and the Volume is also >10X the average.
CMP- Rs. 104
Est. Entry price ~ 108
Target Price- Rs120 ( 15% upside)
SL -92
Note- The candle closed isn't very promising, so we have to wait for a stronger move.
Disclaimer: This is not a buy/sell recommendation. For educational purpose only. Kindly consult your financial advisor before entering a trade.
Bullish Breakout in HCL TechStock breaks above key resistance zone of ₹1770
Strong bullish candle formation on the daily chart
Breakout supported by above-average volume, confirming strength
Price broke out from ascending triangle pattern — a classic bullish continuation signal
📢 Fundamental Trigger:
HCL Tech remains strong in cloud, AI, and digital transformation services
Recent deal wins and strong Q4 results supporting bullish sentiment
Attractive valuation compared to peers like TCS & Infosys

Bullish Breakout in VIP Industries 🔍 Chart Overview:
Breakout above resistance zone at ₹420
Strong volume spike confirming buying interest
Price action broke out of a consolidation channel
Formed a bullish flag/pennant pattern before breakout
🔧 Technical Indicators:
RSI moving above 60 → bullish momentum building
MACD crossover near zero line → fresh upward signal
50 EMA support intact, stock trading above all major EMAs

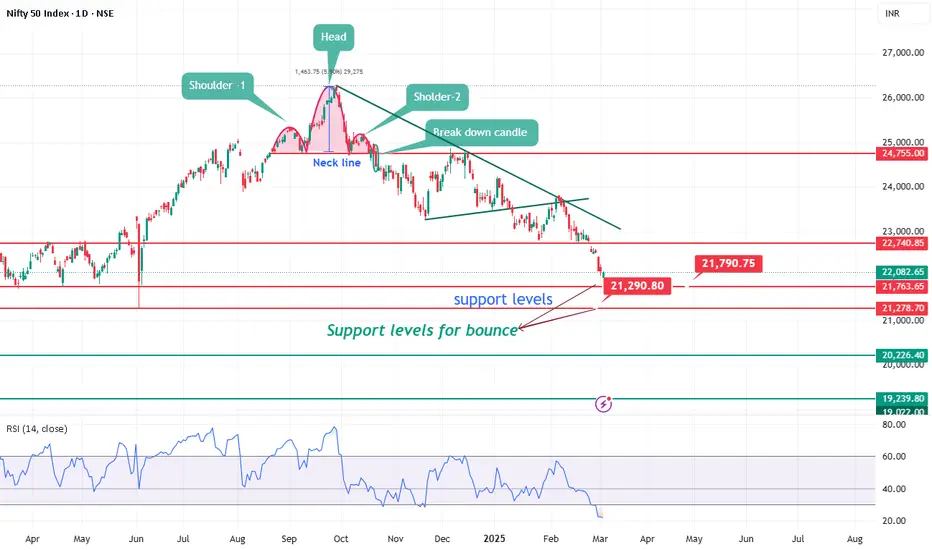
Nifty support levels for bounce.Nifty has been corrected 17% from top. As per chart index is in oversold condition on daily chart. There is still space for downside lower levels for support would be 21800 and 21222.
SBI card may test 1025 soon.Showing strength in weak market.
Analysis: -As per chart SBI card took proper support at 78.6% level and reversed. Moreover, it given break out of major trendline level 785. It is showing strength after retest of break level 785. as per chart it may test 1025 soon.
